
CXW CoreCivic, Inc. Common Stock
NYSE · Commercial Services & Supplies · Ver em SEC EDGAR ↗ fechar Out 2, 2026 10-K/10-Q Ago 6, 2026CXW Instantâneo da Ação Preço, capitalização de mercado, P/E, EPS, ROE, dívida/patrimônio, intervalo de 52 semanas
CXW Gráfico de Preço da Ação OHLCV diário com indicadores técnicos — panorâmica, zoom e personalize sua visualização
A granularidade da barra se adapta ao período selecionado — passe o mouse sobre o gráfico para ver a abertura/máxima/mínima/fechamento de uma barra.
| Data ex | Desdobramento | Tipo |
|---|---|---|
| 9 de Julho de 2007 | 2-for-1 | Para frente |
| 14 de Setembro de 2006 | 3-for-2 | Para frente |
| 18 de Maio de 2001 | 1-for-10 | Reverso |
Sobre CoreCivic, Inc. Common Stock Visão geral da empresa da Wikipedia
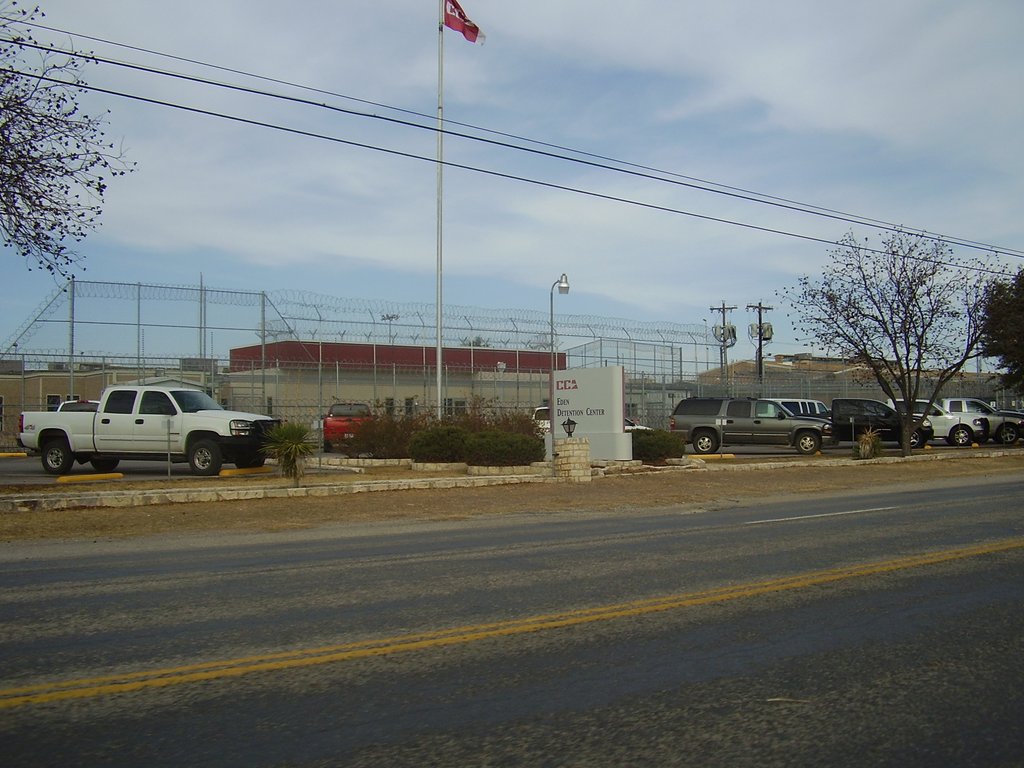
CoreCivic, Inc. is an American private prison operator and one of the largest for-profit prison, jail and detention contractors in the United States. It has been the target of divestment campaigns, FBI investigations and lawsuits alleging civil rights violations and forced labor at some of its owned or operated 82 state and federal correctional and detention facilities in the U.S.
As of 2024, the company, based in Brentwood, Tennessee, was the second largest private corrections company in the United States and the nation's largest owner of partnership correctional, detention, and residential reentry facilities. In 2025, CoreCivic expected to make $300 million in new ICE contracts under a Trump administration plan to incarcerate 100,000 immigrant detainees.
The company's reported revenue in 2024 was $2 billion, with a net income of $68.9 million. In 2025, CoreCivic reported their total revenue was $2.2 billion, up 13% for the year prior.
Previously known as the Corrections Corporation of America (CCA), the company rebranded itself as CoreCivic in 2016. The company said the decision was based on a need to diversify its portfolio, though the rebranding occurred amid controversies over the for-profit prison industry.
Ownership
As of 2025, CoreCivic (US:CXW) had 492 institutional owners and shareholders on file with the Securities Exchange Commission (SEC). The largest shareholders were BlackRock, Inc., Vanguard Group Inc, River Road Asset Management, LLC, and Cooper Creek Partners Management, among others. Public pension fund investors included worker retirement systems in Kentucky, Texas, Oregon, Virginia, New Jersey and Illinois.
On January 1, 2026, Patrick Swindle took over from Damon Hininger as President and CEO.
History
Corrections Corporation of America (CCA) was founded in Nashville, Tennessee, on January 28, 1983, by Thomas W. Beasley, Robert Crants and T. Don Hutto. Beasley served as the chairman of the Tennessee Republican Party; Crants was the chief financial officer of a real estate company in Nashville; Hutto was the president-elect of the American Correctional Association, and according to a 2018 Time investigation, ran a Manhattan-sized Tennessee cotton plantation where Black convicts picked cotton for no pay. A founding member of its board of directors was Maurice Sigler, the former chairman of the United States Board of Parole. The initial investment came from Jack C. Massey, co-founder of the Hospital Corporation of America. An early investor prior to the IPO was Vanderbilt University Law School, where Beasley had completed his Juris Doctor degree. Additionally, the Tennessee Valley Authority was another early financial backer.
CCA, CoreCivic's predecessor, was launched amid the 1980's Tennessee prison crisis, when a federal judge ruled the state prisons "unfit for human habitation" due to lack of medical care, overcrowding and violent outbreaks. Beasley's goal was to solve the prison crisis and make a big profit at the same time.
Early contracts
In 1984, CCA turned the Olympic Motel in Houston into a make-shift detention center after contracting with the United States Immigration and Naturalization Service (INS).
In 1984, CCA also took over the operations of the Tall Trees non-secure juvenile facility, for the Juvenile Court of Memphis and Shelby County. Two years later, CCA built the 200-bed Shelby Training Center in Memphis to house juvenile male offenders.
In 1989, it opened the New Mexico Women's Correctional Facility in Grants, New Mexico; it had constructed this facility of 204 beds.
In the 1980s, CCA officials met with representatives of the Mitterrand administration in France. They did not win any contracts there for CCA prisons.
In 1990, CCA opened the first medium-security privately operated prison, the state-owned Winn Correctional Center, in Winn Parish, Louisiana.
It opened the Leavenworth Detention Center, operated for the U.S. Marshals Service, in 1992. This 256-bed facility was the first maximum-security private prison under direct contract to a federal agency.
CCA entered the United Kingdom in 1992, when it entered a partnership with Mowlem and Sir Robert McAlpine to form UK Detention Services. It opened the 650-bed Blackenhurst prison in Worcestershire, England.
In 2011, responding to an initiative from the state of Ohio to reduce "overhead costs by saving $13 million annually while adding 700 beds to house inmates in the overcrowded system", CCA agreed to buy the Lake Erie Correctional Institution for $72.7 million. This is a change in company policy, as previously CCA had always constructed its own prisons. The purchase was contingent on the Ohio Department of Rehabilitation and Correction agreeing to a high level of occupancy under the contract. The state failed to find buyers for many other prisons which it offered for sale.
In 2012, CCA sent a letter to prison officials in 48 states, offering to buy prisons from these states in exchange for a 20-year management contract with a guaranteed occupancy rate of 90%. Many community organizations have criticized the proposals, arguing that the contractual obligations of states to fill the prisons to 90% occupancy are poor public policy, creating an incentive to criminalize behavior and lengthen sentences in order to keep the prisons filled. They believe that these contractual clauses end up costing taxpayers more than state-run prisons and add to over-incarceration.
Later contracts
In 2016, the Obama administration provided the CCA a $1 billion no-bid contract to detain asylum seekers from Central America.
CCA was renamed CoreCivic in October 2016.
In 2018, Williamson County commissioners in Taylor, Texas, voted 4–1, in the wake of a widely publicized crisis of immigrant family separation to end the county's participation in an Intergovernmental Agreement (IGA) with CoreCivic, effective in 2019. The T. Don Hutto Residential Center in Taylor was holding imprisoned mothers separated from their children.
In 2020, CoreCivic announced it would withdraw from its contract to operate the Metro Detention Facility in Nashville, Tennessee, where CoreCivic was the target of frequent protests.
In 2025, the Trump administration awarded CoreCivic a $130-million U.S. Immigration and Customs Enforcement (ICE) contract to reopen a state prison in California City, located in the remote Mojave Desert. After reopening the prison as a detention center with a 2,560 bed capacity, CoreCivic met with criticism for not obtaining required city permits and for keeping detainees "locked behind metal doors in cold cells for most of the day". One hundred detainees organized a hunger strike to protest "inhumane" conditions, such as denial of medication, backed up toilets, and segregation units.
In 2025, the Trump administration awarded CoreCivic $100 million contract to reopen Oklahoma's 2,160-bed Diamondback Correctional Facility that had been closed since 2010.
In 2025, CoreCivic announced it would reopen South Texas Family Residential Center, under ICE contract, with capacity to detain up to 2,400 people.
In 2025, the Trump administration awarded CoreCivic a $60 million contract to operate a 1,033 bed detention center in Leavenworth, Kansas, though the operation stalled amid legal disagreement over a special use permit .
Federal investigations
After a 15-month investigation, the Federal Bureau of Investigation (FBI) decided in 2015 not to prosecute CoreCivic under federal corruption statutes for alleged falsification of staffing records and understaffing at the Idaho Correctional Center (ICC).The FBI said any falsification of records could be attributed to low-level employees with no intention of defrauding the state of Idaho.
In August 2024, the U.S. Department of Justice (DOJ) launched a federal civil rights investigation into CoreCivic's management of the Trousdale Turner Correctional Center in Tennessee. The investigation centered on reports of dangerous prison conditions, including sexual abuse, murders, staffing shortages and high turn-over rates among guards.
In 2025, the FBI launched an investigation of CoreCivic guards smuggling drugs at the Cibola County Correctional Center (CCCC) in New Mexico, where 20% of those at the facility are immigrants in ICE custody and where at least 15 Cibola detainees have died prematurely since 2018.
Ending contracts with private prisons
On August 18, 2016, Deputy U.S. Attorney General Sally Yates announced that the Justice Department intended to end its Bureau of Prisons contracts with for-profit prison operators, because its own analysis concluded "the facilities are both less safe and less effective at providing correctional services" than the Federal Bureau of Prisons. In a memorandum, Yates continued, for-profit "prisons served an important role during a difficult period, but time has shown that they compare poorly to our own Bureau facilities. They simply do not provide the same level of correctional services, programs, and resources; they do not save substantially on costs; and as noted in a recent report by the Department's Office of Inspector General, they do not maintain the same level of safety and security. The rehabilitative services that the Bureau provides, such as educational programs and job training, have proved difficult to replicate and outsource and these services are essential to reducing recidivism and improving public safety." Following Yates' announcement, U.S. Homeland Security Secretary Jeh C. Johnson announced that they would be reviewing the government's use of private detention facilities for housing undocumented immigrants.
In 2017, however, after the change in administrations, officials under President Donald Trump said that both the Department of Justice and Department of Homeland Security would continue to use private prisons.
In 2021, President Biden ordered the Justice Department not to renew contracts with private prison companies, such as CoreCivic and GEO Group.
In 2025, President Trump reversed former President Biden's executive order banning Department of Justice contracts with private prisons.
Employment issues
In 2002 CCA agreed to pay more than $152,000 in back wages to 96 Oklahoma women denied employment because of gender discrimination. A U.S. Department of Labor audit showed women applicants, who were equally or better qualified than men hired, were rejected.
In 2008 CCA was ranked as one of the 100 best corporate citizens by Corporate Responsibility Officer magazine. The national military magazine GI Jobs highlighted CCA as a solid employer for veterans. In 2010 it ranked CCA as one of the "Top 50 Military Friendly Jobs".
But in 2010, a Muskogee, Oklahoma federal court jury found CCA guilty of violating the employment rights of a shift supervisor by terminating his job when he was deployed to Iraq. It determined that CCA should pay about $53,000 in damages for violation of the Uniformed Services Employment and Re-employment Rights Act.
Between 2022-2024, the state of Tennessee fined CoreCivic more than $29.5 million for inadequate staffing at four facilities. The Trousdale Turner Correctional Center had a 188% turnover rate in 2023, and understaffing is cited as cause in a lawsuit related to an inmate's death and a civil rights investigation by the US Department of Justice.
CCA has been criticized for hiring executives from agencies with which it has contracted, in what is known as a "revolving door" of personnel. For instance, Harley Lappin and J. Michael Quinlan, former directors of the Federal Bureau of Prisons, were hired soon after they resigned from BOP following scandal at the agency.
Termination of employee with ties to Neo-Nazi website
In 2019 an anonymous leak of data from the Neo-Nazi website Iron March provided analysts with user data including usernames, private messages, email addresses, and IP addresses that enabled identification of some of the site's users. Travis Frey, a captain at the Nevada Southern Detention Center, operated by CoreCivic, was identified as the Iron March user named "In Hoc Signo Vinces", a phrase used on the insignia of the Marine All-Weather Fighter Attack Squadron 533. Frey joined Iron March in 2013 and posted on the site in 2016 and 2017, while working at a CoreCivic location in Indianapolis. In January 2020, Frey was placed on administrative leave and later fired by CoreCivic.
Role in deporting people on false pretenses
In 2025, a CoreCivic employee, Charles Cross Jr., played an instrumental role in characterizing a gay Venezuelan makeup artist as a member of the Tren de Aragua gang, which the Trump administration used as justification to deport the Venezuelan man to El Salvador's Terrorism Confinement Center. Cross was fired from the Milwaukee Police Department in 2016 for driving a car into a family's home while drunk. CoreCivic hired him four months later.
Business practices
CoreCivic has been accused of maximizing profits by using forced labor in their immigration detention facilities, paying as little as $1 per day. They have faced numerous lawsuits for violating anti-trafficking laws.
In 2021 CoreCivic agreed to pay $56 million to settle a lawsuit from shareholders accusing the company of inflating stock prices. One shareholder, Amalgamated Bank, claims a $1.2 million loss from 2016. The lawsuit also alleges CoreCivic "ran unsafe, low quality prisons that caused multiple deaths and did not save money". U.S. District Judge Aleta Trauger declined to dismiss the case due to evidence from CoreCivic internal communications.
Facility incidents and controversies
T. Don Hutto Residential Center
The T. Don Hutto Residential Center is a former medium-security prison in Taylor, Texas, which, from 2006 to 2009, held accompanied immigrant detainees ages 2 and up under a pass-through contract with the Immigration and Customs Enforcement (ICE) division of the Department of Homeland Security (DHS). After local and national protests because of the poor quality of treatment, federal officials announced on August 6, 2009, that it would no longer house immigrant families in this prison. Instead, only female detainees will be housed there. In September 2009, the last families left the facility and were relocated to the Berks Family Residential Center in Pennsylvania. In November 2015, a hunger strike at the Hutto Center quickly grew to include 500 immigrant women. They were protesting their extended detention in this center.
Eloy Detention Center
The Eloy Detention Center of Arizona had 16 detainee deaths between 2005 and December 2019, including five by suicide. Opened and operated by CoreCivic since its opening in 1994, the 1,550-bed facility has "evolved into one of the most controversial immigration detention facilities in the United States", according to the nonprofit Detention Watch Network.
Following a detainee's 2006 death at Eloy, government investigators reported that "detainee welfare is in jeopardy". A subsequent detainee death at the facility resulted in "another scathing report", according to the New York Times.
A January 2010 investigation by the ACLU and New York Times found that the Eloy center had more fatalities "than any other immigration jail under contract to the federal government".
In June 2015, following the death of a detainee, 200 Eloy detainees declared a hunger strike, demanding investigations into the facility's deaths and use of excessive force as well as access to adequate medical care, legal resources, and more. In July, Congressman Raúl Grijalva, D-Ariz., called Eloy "the deadliest immigration detention center in the U.S" and called for an independent investigation into the most recent suicide. By July 2016, a three-month measles outbreak affecting at least 22 victims was spread by unvaccinated employees. Pinal County's health director presumed the outbreak likely originated with a migrant, but detainees had since received vaccinations. Convincing CoreCivic's workers to become vaccinated or verify proof of immunity was far more difficult, he said.
In 2024, the nonprofit Florence Immigrant & Refugee Rights Project reported that detainees at Eloy experienced substandard medical care, incidents of verbal and physical abuse, unsanitary dining conditions and frequent lockdowns.
South Texas Family Residential Center
In 2019, the Los Angeles Times reported that the South Texas Family Residential Center in Dilley, Texas, held 1,735 people and about 1,000 of the detainees were children.
In April 2016, an application for a child-care license for the Dilley detention facility, which is run by CoreCivic, was pending. This facility houses 2,400 children and female detainees. A license inspection by the Texas Department of Family and Protective Services in April of that facility had found 12 deficiencies. Those included: all playgrounds showed worn AstroTurf and exposed seams, creating a potential tripping hazard; and unsecured medical supplies, such as scalpels and used syringes, were seen on top of counters. No temporary license was to be issued until those problems were corrected.
Bent County Correctional Facility
In June 2026, in Bent County Correctional Facility in Las Animas, Colorado, two incarcerated men, Charles Gates and Michael Fisher, were killed, and a third was seriously injured. Gates' death was ruled a homicide; no one has been charged in the crime as of September 2026. Gates' mother has filed a wrongful death suit against CoreCivic for failing "in their duty to keep prisoners safe."
Laredo Processing Center
The Laredo Processing Center in Laredo, Texas, has 404 beds for both male and female detainees. It has been operated by CCA since 1985. In 2022, nonprofit organizations including the American Civil Liberties Union (ACLU) filed suit against ICE for unlawfully keeping attorneys from communicating with their clients in detention in Laredo as well as three other detention centers.
Cibola County Correctional Center
In 2016, the Federal Bureau of Prisons cancelled their contract with Cibola County Correctional Center in Milan, New Mexico, after 16 years of CCA operations. The facility was under examination for poor medical care and at least three questionable inmate deaths. The medical unit was found to be acting out of compliance in 2014 and given several warnings on incidents leading up to the announcement of closure. An inmate uprising in 2014 resulted in two top officials being put on leave.
Also in 2016, a new contract with ICE re-opened the facility. In 2017, a unit was opened for transgender ICE detainees. In May 2018, Roxsana Hernández, a 33-year-old Honduran transgender woman, died in ICE custody following her detention at Cibola. CoreCivic had been told to preserve video evidence related to Hernández's death, but when asked for the footage, they said it had been overwritten and was "no longer available".
In 2019, 29 transgender women detainees wrote a letter citing the inadequate medical care and mistreatment they had received. Also in 2019, a transgender detainee was reported to have been made to wait thirteen days for medical treatment after complaining of rectal bleeding. Additionally, it was later determined that the detainee was HIV-positive. A DHS official sharply criticized the situation, noting that the lack of action put the detainee "at risk for severe medical complications" and "also exposed other detainees and facility and ICE staff to an infectious and potentially deadly disease".
Davis Correctional Facility
The Davis Correctional Facility, which opened in Holdenville, Oklahoma, was operated by CoreCivic as a medium- to maximum-security men's prison from its opening in 1996 until 2023. It held 1,600 beds. In October 2023, the Oklahoma Department of Corrections (ODOC) took over operations at the facility, which has changed its name to the Allen Gamble Corrections Center and as of 2026, holds more than 1,700 beds.
Prior to ODOC taking control of the facility, Davis was described as a private prison "plagued by violence and staffing shortages". In 2022, 18 people were stabbed — 3 of whom died — at the Davis facility. One corrections officer told Oklahoma Watch that he had guarded as many as 240 inmates by himself.
In July 2022, correctional officer Alan Hershberger was assaulted by inmate Gregory Thompson, who attacked him with a "homemade weapon". Hershberger, who had been working with the company since late 2021, was a veteran of the U.S. Navy, the Army Reserves, and the Army National Guard. Thompson was already serving a life sentence for first-degree murder in 2003 and five years on a manslaughter charge involving the 2009 stabbing death of another inmate.
Significant violence has continued at the facility even after changing management: 14 inmates have been killed have occurred at the prison between October 2023 and February 2026, the highest homicide rate of any lockdown facility in Oklahoma.
California City Detention Center
Seven immigrants sued ICE and DHS in November 2025, alleging inhumane conditions at CoreCivic's California City Detention Facility in the remote Mojave Desert. Represented by the Prison Law Office and the ACLU, detainees reported freezing cells infested with insects, lack of medical care, shower stalls full of sewage, and limited access to lawyers. The lawsuit came on the heels of a detainee hunger strike following the center's re-opening without proper permits. A spokesman for CoreCivic's 2,500-bed facility said "the safety, health and well-being of the individuals entrusted to our care is our top priority. " The facility was a former state prison that had been closed in March 2024.
Adams County Correctional Facility
In May 2012, a riot at CCA-operated Adams County Correctional Facility in Natchez, Mississippi involving up to 300 inmates resulted in the death of a corrections officer, Catlin Carithers, and injury to 16 staff members and three prisoners. Twenty-five employees were held hostage during the disturbance. It was quelled by facility staff with assistance from the Mississippi Highway Patrol and the Federal Bureau of Prisons. According to a company statement, the fatality was the second time a CCA employee had "lost his life to inmate assault".
In August 2026, 70 detainees had signed a petition to the warden demanding an end to cell overcrowding and beds on the floor. Several weeks later, about 100 detainees in the facility protested spoiled food and a lack of hot water.
Lake Erie Correctional Institute
In the fall of 2012, state auditors of the Lake Erie Correctional Institution in Conneaut, Ashtabula County, Ohio, which CCA had acquired and operated since January of that same year, deducted $500,000 for contract violations and inadequate staffing. The prison had suffered a high rate of violence and contraband drugs after CCA took it over.
Idaho State Correctional Center
In 2000. CCA opened the Idaho State Correctional Center, in Kuna, Ada County, Idaho, the first private prison in the state. By 2008, the Idaho Department of Correction (IDOC) found there were four times as many inmate assaults on other inmates at this facility as the other seven prisons in Idaho combined. The facility was known to be so violent that inmates called it the "Gladiator School".
2010
In March 2010, the ACLU filed suit in federal court against CCA in Idaho, alleging that the prison was violating inmates' constitutional rights under the Eighth Amendment banning cruel and unusual punishment.The suit cited 30 violent incidents and held CCA for understaffing and taking measures to stop the violence. CCA settled the case with the ACLU, agreeing to make changes in its management of the facility.
In December 2010, the Associated Press released a video showing an inmate beaten unconscious, and ultimately suffering brain damage, as guards watched without taking action. CCA called the video release "an unnecessary security risk to our staff, the inmates entrusted to our care and ultimately to the public" and that it was cooperating with investigators.
2012
In November 2012, eight inmates filed a federal lawsuit alleging that CCA prison officials partially ceded control of the Idaho Correctional Center to gang leaders. The lawsuit claimed CCA used gang members from the Aryan Knights and the Severely Violent Criminals to manage the institution. Investigators reported IDOC was aware the prison housed members of the same gangs together in some cell blocks to reduce violent clashes.
2013-2014
In 2013, CCA confirmed that an internal review showed that records involving about 4,800 employee hours had been falsified over a period of seven months, at its Idaho State Correctional Center in Kuna, Ada County, Idaho. A subsequent KPMG audit showed the actual overbilling was for over 26,000 hours. By this time, the ACLU filed a motion to hold the CCA warden in contempt of court for not making the necessary improvements required by their previous settlement. In February 2014, the federal judge hearing the case awarded $349,000 in attorney fees to the ACLU for its costs in bringing the action.
Governor Butch Otter, announced that the state would assume command of the facility at the end of CCA's contract in June 2014, and ordered Idaho State Police to investigate to see if criminal charges should be brought. Later, the state announced that the FBI was taking over the investigation, as well as investigating CCA operations in other states. In May 2015, the FBI announced that they were declining to prosecute.
Metro Detention Facility
CCA operated the Metro Detention Facility in Nashville, Davidson County, Tennessee for more than 25 years, ending its contract in 2020. Prior to the split from CoreCivic, Nashville Metro Council members Emily Benedict and Freddie O'Connell issued a press release saying of the company, Their profits are based on imprisoning as many people as possible at the lowest possible cost because that is how they make money for themselves and their shareholders. The motivation of their business is profit, not people. Their business model is dependent on laws that cause more people to be jailed, and stay jailed.In July 2017, federal lawsuits were brought against CoreCivic by Metro inmates and employees after the corporation had failed to adequately respond with referrals, diagnosis, medication, treatment, and prevention to a widespread, long-term scabies outbreak. At least 40 male inmates and as many as 80 females were infected, and inmates who complained reportedly suffered retaliation from management. Laundering of clothes and bedding were not frequent enough or managed appropriately to contain the outbreak, and the scabies spread to courthouse employees and their families.
Winn Correctional Facility
In 2015, journalist Shane Bauer went undercover to work as a guard at Winn Correctional Facility, in Winn Parish, Louisiana, then operated by CCA. In his report for Mother Jones, he exposed the violence among inmates, poor medical and mental healthcare for prisoners, mismanagement and lack of training for staff. He later fleshed out his findings in his 2018 book American Prison.
Cimarron Correctional Facility
In 2015 violence increased at Cimarron Correctional Facility in Cushing, Oklahoma, including a riot involving 200–300 prisoners in June 2015 that resulted in eleven inmates being hospitalized. On September 13, 2015, a fight between white gangs broke out that resulted in the deaths of four inmates and hospitalization of four others because of their injuries. It was the deadliest event in Oklahoma corrections' history. CCA declined multiple requests for a recorded interview after the Cimmaron events. Corrections Commissioner Joe Allbaugh said, "We don't have the flexibility in our system to segregate these gangs, so they are together in close quarters and so sometimes things happen."
The director of the American Civil Liberties Union (ACLU) of Oklahoma says the non-profit receives numerous complaints about treatment in private prisons: "I would say we get roughly double the number per capita from private prison inmates from public prison inmates." The complaints range from safety concerns to lack of appropriate food and medical care.
Oklahoma sent a "notice to cure" in October 2015 to inform Cimarron Correctional Facility that it was more than seven months behind in reporting use of force standards and reportable incidents. According to DOC's contract with CCA, the business has five days to submit proper reporting, but the state was waiting on reports dating back to March 2015.
The ACLU's Brady Henderson said this demonstrated a practice within the prison system of concealing records of activities. "Even in public facilities, there's an incredible amount of secrecy", a lack of transparency. "It's already hard to know. It gets 10 times harder with a private facility", he said.
In 2015 Allbaugh said that because of overcrowding in the Oklahoma system, his agency would continue to do business with private prison companies. "As much as I don't think the state ought to be doing business with private prisons, I'm glad they're around because they're our only relief valve available to us during this crunch." In March 2016, video from a contraband cell phone was released that showed a group of inmates throwing another prisoner off a tier.
In 2017, two guards at Cimarron, a man and a woman, separately admitted to having had sexual relationships with male inmates there. The woman said she bore a child as a result.
Co-operation with local law enforcement in a school drug sweep
In 2012, CCA conducted a drug sweep of Vista Grande High School in Casa Grande, Arizona in concert with local law enforcement. Caroline Isaacs, the program director of the Tucson office of the American Friends Service Committee said, "It is chilling to think that any school official would be willing to put vulnerable students at risk this way."
Stewart Detention Center
The immigration detention facility Stewart Detention Center in Lumpkin, Georgia reported 10 detainee deaths between 2017 and 2024. On May 15, 2017, Panamanian detainee Jean Jimenez died by suicide at age 27 after having schizophrenia-related hallucinations. Medical experts concluded that inadequate mental health staffing contributed to Jimenez's death.
In 2018, the Southern Poverty Law Center (SPLC) filed a class-action lawsuit on behalf of three former detainees against CoreCivic for the practices at Stewart Detention Center. They claimed that the facility used forced labour to maintain their facility in order to maximize profits. Immigrants would be punished for not working through solitary confinement and the deprivation of basic necessities which the facility charged for. Plaintiff Wilhen Hill Barrientos describes his experience: "When I arrived at Stewart I was faced with an impossible choice – either work for a few cents an hour or live without basic things like soap, shampoo, deodorant and food." A settlement was made in the Wilhen Hill Barrientos, et al., v. CoreCivic, Inc. case in 2023.
Otay Mesa Detention Center
Four detainee deaths were reported at the Otay Mesa Detention Center in San Diego, California between 2017 and 2024.
A class-action lawsuit was filed against CoreCivic in 2017 by immigrants formerly detained at Otay Mesa. Consolidated with the Gonzalez V. CoreCivic Inc. case of the same year, the Owino V. CoreCivic Inc. lawsuit echoed many of the same forced labour claims and brought it to a nationwide scale, including every detained immigrant who worked under threat of punishment at any CoreCivic facility between December 23, 2008 and 2025. As of 2025, this case was still ongoing.
Crossroads Correctional Center
In 1999, CCA opened the Crossroads Correctional Center in Shelby, Montana, a multi-security facility.
In 2009, the ACLU filed suit against CCA, Crossroads Correctional Center and the state of Montana on behalf of indigenous inmates who had been subjected to group strip searches, and prevented them from celebrating sweat lodge ceremonies.
Closed facilities
Colorado
CCA closed the Huerfano County Correctional Center in Walsenburg, Colorado, in 2010. CCA appealed an initial county assessment of $30.5 million in property taxes for 2010. CCA's contract with the county had specified that CCA would pay only $19 million for 2011 and $15 million for each of the next three years.
It also closed Kit Carson Correctional Facility in Burlington, Colorado, in 2016.
Kentucky
As of June 2013, the state of Kentucky did not renew its contract with CCA for the Marion Adjustment Center in St. Mary, Kentucky. This was its last contract for private operations at the time, temporarily ending three decades of contracting with private companies to operate prisons for the state.
Until 2015, the Lee Adjustment Center, in Beattyville, Lee County, Kentucky, held Vermont prisoners in addition to those from Kentucky. In September 2004 a riot broke out involving Kentucky and Vermont prisoners. In November 2017, due to facility overcrowding, the Kentucky Department of Corrections signed a contract allowing CoreCivic to reactivate the vacant prison to house up to 800 male inmates. These inmates would be transferred from the Kentucky State Reformatory. The facility reopened and began accepting inmates in March 2018.
The Otter Creek Correctional Center, located in Wheelwright, Floyd County, Kentucky, reported a riot in July 2001, involving male prisoners from Kentucky and Indiana. It was closed by CCA and converted to a women's prison. In August 2009, following numerous reports of sexual abuse of female inmates from Hawaii and Kentucky by staff, including a chaplain, Hawaii removed its inmates from Otter Creek. CCA closed the facility in 2013. The prison was leased to the Kentucky Department of Corrections and reopened under state management as the Southeast State Correctional Complex in September 2020.
Minnesota
Appleton, Minnesota, in Swift County, is home to a vacant medium-security prison, the Prairie Correctional Facility, which CCA closed in 2010. Although the state corrections needed additional capacity, neither the Department of Corrections nor the governor favored leasing the prison or contracting with CCA to operate it. In November 2015, state Corrections Commissioner Tom Roy said he was not ruling out use of Appleton, but said he did not like the basic principle underlying private prisons. "The notion of incarceration for profit", he said, "I don't think is very popular in this state." Results of a study reported in 2018 that opening the facility would be too costly.
However, in 2026, Appleton officials announced that they would be reopening the Prairie Correctional Facility as a 1,600 bed ICE detention center. According to KARE 11, "CoreCivic's proposal, also called a memorandum of understanding, includes paying Swift County $200,000 in September and another $540,000 every year thereafter. But the agreement is just that - and it's not binding."
Oklahoma
In May 2004 rioting broke out at the Diamondback Correctional Facility in Watonga, Oklahoma, constructed in 1998. CCA closed it in 2010 after losing a federal contract. The town hoped to find other uses for the facility, but the prison was still vacant as of March 2017. The North Fork Correctional Facility, in Sayre, Oklahoma, near the Texas border, was constructed in 1998. Rioting occurred again in April and June 2000, and in October 2011. It was closed in November 2015.
In January 2016, Joe Allbaugh, best known for managing the gubernatorial campaign of George W. Bush and serving as the Director of the Federal Emergency Management Agency prior to Hurricane Katrina, was appointed by Governor Mary Fallin as the Interim Corrections Director of Oklahoma. He had no correctional experience.
In 2016, Allbaugh initiated a contract to lease North Fork from CCA. He directed the transfer of state prisoners to North Fork from county jail work centers located closer to major cities like Tulsa and Oklahoma City. In the work centers, the inmates were closer to their families and worked in their communities performing maintenance functions such as litter pickup and park maintenance. The move would make it more difficult for families and friends to maintain the connections with inmates.
The contract negotiated by Allbaugh's staff to lease CCA's empty 2,600-bed for-profit prison in Sayre while closing the state's 15 inmate work centers was voted on in May 2016, by the Oklahoma Department of Corrections. No one was authorized to discuss the contract publicly.
Kansas
In late 2021, Leavenworth Detention Center, owned by CoreCivic since 1992, was closed due to President Biden's executive order on private prisons. In 2025, CoreCivic prepared to reopen the once-maximum security prison to hold up to 1,000 ICE detainees, despite a court order blocking the reopening. The City of Leavenworth argued CoreCivic lacked a necessary special use permit to reopen the facility. Nevertheless, CoreCivic advertised job openings, made roof repairs and erected a new sign with the facility's new name, Midwest Regional Reception Center.
Illegal recording and transmittal of attorney meetings at Leavenworth
On September 7, 2016, Kansas City District Court Judge Julie A. Robinson found CoreCivic illegally recorded phone calls between attorneys and their incarcerated pre-trial clients at its Leavenworth, Kansas prison. Defense attorneys representing inmates objected after discovering their privileged conferences with clients had been recorded, despite CoreCivic having repeatedly assured them the meetings would be kept private. Robinson scolded prosecutors for speeding forward with an alleged prison contraband case, which she called a "horrendous situation". Robinson said, "You all need to get your act together" and authorized wide latitude devoted to an investigation into recordings of phone calls and video of meetings between attorneys and inmates at Leavenworth Detention Center. Robinson said she planned to order the U.S. Department of Justice to pay for the investigation, which is expected to cost hundreds of thousands of dollars. Prosecutors said they obtained the recordings inadvertently while gathering evidence of a prison contraband ring that could have involved as many as 95 inmates and 60 non-inmates. A grand jury subpoena issued to the U.S. Attorney's office resulted in the provision of illegal recordings of meetings between attorneys and clients. Dozens of attorney-client phone calls were provided to other lawyers in the case. Robinson said it appeared the rights of some inmates had been violated. The FBOP forbids recording in attorney-client meeting rooms yet CoreCivic contends that silent video recordings of inmate-attorney meetings "are a standard practice" throughout the country and are used for prison security.
In August 2016, Robinson ordered the recordings be halted. CoreCivic offered prisoners attorneys an option that such recordings be disabled for case conferences with their clients but a defense attorney informed the court that calls between himself and a client at Leavenworth had been recorded despite his multiple requests that such recordings end and his receipt of assurances from CoreCivic that the practice had been terminated. Barry Pollack, president of the National Association of Criminal Defense Lawyers said, "You have a failure on the part of the institution that is recording something that it shouldn't be. Here, they turned it over to the prosecutors." "Anyone facing prison time needs legal counsel, and essentially, they aren't getting it." The illegalities involved caused review of sentencing in cases. One defendant, Michelle Reulet, was released almost three years early after it was learned CCA illegally shared recordings of her meetings with her attorney with the U.S. Prosecutor's office.
Tennessee
In late 2021, the West Tennessee Detention Facility in Mason, Tennessee, was closed due to President Biden's executive order on private prisons.
Divestment
In response to a teacher petition campaign, the California State Teachers' Retirement System (CalSTRS) voted in November 2018 to divest from CoreCivic and GEO Group. The Board of CalSTRS voted to withdraw its $13.7 million investment in the private prison companies following news that the Trump administration was separating families detained at the Mexican border. Cathy Campbell, president of the Berkeley Federation of Teachers, said, "This really came out of a movement of educators from their deep love of children and the families they serve."
On the heels of the CalSTRS decision to divest, in 2019, the California Public Employees Retirement System (CalPERS), the state's largest pension fund, voted to withdraw $10.8 million from CoreCivic and GEO Group. Emily Claire Goldman of Educators for Migrant Justice campaigned for CalPERS to divest from the for-profit detention centers. Goldman said, "California public employees took a stand and made their voices heard after learning that their retirement savings were propping up the very companies that have played a critical role in the migrant abuse crisis, as well as mass incarceration, and the school-to-prison pipeline." Amanda Gilchrist, a spokeswoman for CoreCivic, said, "While we know this is a highly charged, emotional issue for many people, much of the information about our company being shared by special interest groups is wrong and politically motivated, resulting in some investors reaching misguided conclusions about what we do."
In 2019, JP Morgan Chase, Wells Fargo, SunTrust, Bank of America, and Barclays announced they would stop loaning to private prison companies for facility expansion.
In July 2026, following extended pressure campaigns from advocates and the city councils of two New Jersey cities, Montclair and Jersey City, Citizens Bank announced it would end its lending relationships with CoreCivic and GEO Group.
Lobbying
CoreCivic spent almost $2 million on lobbying in 2025, an increase from $1.8 million in 2024.
Trump-Vance
CoreCivic donated $500,000 to the Trump-Vance Inaugural Committee in December 2024, doubling its donation of $250,000 to President Trump's 2016 Inaugural Committee. CoreCivic made the 2024 donation a month before Trump reversed President Biden's executive order banning U.S. Department of Justice contracts with private prisons.
Amid forecasts of hundreds of millions of dollars in new ICE contracts, CoreCivic met daily with the Trump administration following the November 2020, presidential election. Michael A. Hallett, a professor of criminal justice at the University of North Florida, said ICE was handing CoreCivic "the keys to the treasury" in no-bid contracts.
Earlier lobbying
CCA lobbyists have worked to shape and support private prison legislation in many localities, including Texas, New York, Illinois and Tennessee. Between 2002 and 2012, CCA spent $17.4 million lobbying the Department of Homeland Security, U.S. Immigration and Customs Enforcement (ICE), the Office of Management and Budget, the Bureau of Prisons, both houses of Congress, and others. This sum included $1.9 million in campaign contributions.
According to the Boston Phoenix, CCA spent more than $2.7 million from 2006 through September 2008 on lobbying for stricter criminal laws and mandatory sentencing terms, in order to generate prisoners. CCA responded that it does not lobby lawmakers to increase jail time or push for longer sentences under any circumstance, noting that it "educates officials on the benefits of public-private partnership but does not lobby on crime and sentencing policies".
Among its risk factors listed in its 10-K annual report, as required by the Securities and Exchange Commission, CCA includes the following:
The demand for our facilities and services could be adversely affected by the relaxation of enforcement efforts, leniency in conviction or parole standards and sentencing practices or through the decriminalization of certain activities that are currently proscribed by our criminal laws. For instance, any changes with respect to drugs and controlled substances or illegal immigration could affect the number of persons arrested, convicted, and sentenced, thereby potentially reducing demand for correctional facilities to house them.
At the federal level, the corporation's lobbying focuses largely on immigrant detention. In 2012, CCA spent nearly $1.8 million lobbying Congress and federal bureaucracies on issues relating to homeland security, law enforcement, immigrant detention, and information disclosure legislation.
Fonte: Wikipedia (Inglês), CC BY-SA 4.0 · Ver na Wikipedia ↗
Desempenho de 10 Anos Tendências de receita, lucro líquido, margens e EPS
Avaliação Rácios P/E, P/S, P/B, EV/EBITDA — a ação está cara ou barata?
| Métrica | Tendência de 5 anos | CXW | média 5A | Mediana de Pares | Veredito |
|---|---|---|---|---|---|
| P/E (TTM) | 26.7média 5A ≈13.1 | ≈13.1 | · | · | |
| P/S (TTM) | 1.3média 5A ≈0.9 | ≈0.9 | · | · | |
| P/B (MRQ) | 2.3média 5A ≈1.2 | ≈1.2 | · | · | |
| Preço / FCF (TTM) | 56.1média 5A ≈16.8 | ≈16.8 | · | · | |
| Preço / Fluxo de Caixa (TTM) | 16.5média 5A ≈7.8 | ≈7.8 | · | · | |
| EV / Revenue (EV / Receita) | 2.0média 5A ≈1.4 | ≈1.4 | · | · | |
| EV / FCF | 84.6média 5A ≈27.6 | ≈27.6 | · | · | |
| Price / Tangible Book (Preço / Valor Patrimonial Tangível) | 2.4média 5A ≈1.2 | ≈1.2 | · | · | |
| PEG Ratio | ≈1.4 | · | · | · |
A mediana dos pares é calculada em uma base padronizada por métrica e pode não corresponder sempre à base TTM/MRQ mostrada para esta ação.
Lucratividade Margens bruta, operacional e líquida; ROE, ROA, ROIC
| Métrica | Tendência de 5 anos | CXW | média 5A | Mediana de Pares | Veredito |
|---|---|---|---|---|---|
| Margem de Impostos Pré-Tributação (TTM) | 7.0%média 5A ≈6.1% | ≈6.1% | 4.9% | Primeira linha | |
| Margem de Lucro Líquido (TTM) | 5.1%média 5A ≈3.2% | ≈3.2% | 3.2% | Primeira linha | |
| ROA (TTM) | 3.9%média 5A ≈2.1% | ≈2.1% | 2.9% | Primeira linha | |
| ROE (TTM) | 8.8%média 5A ≈4.5% | ≈4.5% | 17.9% | Fraco |
Saúde financeira Dívida, liquidez, solvência — força do balanço patrimonial
| Métrica | Tendência de 5 anos | CXW | média 5A | Mediana de Pares | Veredito |
|---|---|---|---|---|---|
| Dívida / Patrimônio Líquido (MRQ) | 0.9média 5A ≈0.9 | ≈0.9 | 0.9 | Em linha | |
| Índice de liquidez corrente (MRQ) | 1.3média 5A ≈1.6 | ≈1.6 | 1.3 | Em linha | |
| Quick Ratio (Índice de Liquidez Seca) | 1.5média 5A ≈1.4 | ≈1.4 | 1.1 | Em linha | |
| Dívida de Longo Prazo / Patrimônio Líquido (MRQ) | 0.9média 5A ≈0.8 | ≈0.8 | 0.9 | Em linha |
Crescimento Crescimento da receita, EPS e lucro líquido: YoY, CAGR 3 anos, CAGR 5 anos
| Métrica | Tendência de 5 anos | CXW | média 5A | Mediana de Pares | Veredito |
|---|---|---|---|---|---|
| Revenue YoY (Receita Ano a Ano) | 12.7%média 5A ≈3.1% | ≈3.1% | · | · | |
| Revenue CAGR 3Y (CAGR Receita 3A) | 6.2%média 5A ≈2.6% | ≈2.6% | · | · | |
| Revenue CAGR 5Y (CAGR Receita 5A) | 3.0% | · | · | · | |
| EPS YoY | 74.2%média 5A ≈12.2% | ≈12.2% | · | · | |
| Net Income YoY (Lucro Líquido Ano a Ano) | 69.2%média 5A ≈8.8% | ≈8.8% | · | · | |
| EPS CAGR 3Y (CAGR de LPA 3A) | 1.6% | · | · | · | |
| EPS CAGR 5Y (CAGR de LPA 5A) | 19.1% | · | · | · | |
| Net Income CAGR 3Y (CAGR de Lucro Líquido 3A) | -1.6% | · | · | · | |
| Net Income CAGR 5Y (CAGR de Lucro Líquido 5A) | 16.6% | · | · | · |
Eficiência de Capital Giro de ativos, giro de estoques, giro de contas a receber
| Métrica | Tendência de 5 anos | CXW | média 5A | Mediana de Pares | Veredito |
|---|---|---|---|---|---|
| Asset Turnover (Giro do Ativo) | 0.7média 5A ≈0.6 | ≈0.6 | 0.7 | Em linha | |
| Receivables Turnover (Giro de Contas a Receber) | 6.0média 5A ≈6.3 | ≈6.3 | 5.9 | Primeira linha | |
| Revenue / Employee (Receita anual ÷ funcionários (número de funcionários reportado, yfinance). Derivado — não é um conceito SEC-XBRL armazenado.) | ≈$162.0K | · | · | · |
valor · ≈ média 5A · mediana do setor · veredicto relativo à mediana
Dividendos Rendimento, índice de pagamento, histórico de dividendos, CAGR de 5 anos
| Data ex | Valor | Moeda | Rendimento |
|---|---|---|---|
| Mar 31, 2020 | $0,44 | USD | ≈15.8% |
| Jan 3, 2020 | $0,44 | USD | ≈10.9% |
| Set 30, 2019 | $0,44 | USD | ≈10.1% |
| Jun 28, 2019 | $0,44 | USD | ≈8.4% |
| Mar 29, 2019 | $0,44 | USD | ≈8.9% |
| Dez 31, 2018 | $0,43 | USD | ≈9.6% |
| Set 28, 2018 | $0,43 | USD | ≈7.0% |
| Jun 29, 2018 | $0,43 | USD | ≈7.1% |
| Mar 29, 2018 | $0,43 | USD | ≈8.7% |
| Dez 29, 2017 | $0,42 | USD | ≈7.5% |
| Set 29, 2017 | $0,42 | USD | ≈6.3% |
| Jun 29, 2017 | $0,42 | USD | ≈6.6% |
| Mar 30, 2017 | $0,42 | USD | ≈6.1% |
| Dez 29, 2016 | $0,42 | USD | ≈8.4% |
| Set 29, 2016 | $0,54 | USD | ≈15.6% |
| Jun 29, 2016 | $0,54 | USD | ≈6.2% |
| Mar 30, 2016 | $0,54 | USD | ≈6.7% |
| Dez 30, 2015 | $0,54 | USD | ≈8.1% |
| Set 30, 2015 | $0,54 | USD | ≈7.2% |
| Jun 30, 2015 | $0,54 | USD | ≈6.3% |
Histórico de Lucros EPS real vs. estimativa, surpresa %, taxa de acerto, próxima data de resultados
| Período | Relatório | EPS Actual | EPS est. | Surpresa |
|---|---|---|---|---|
| 30 de Junho de 2026 | Ago 4, 2026 | $0.37 | $0.35 | 6.5% |
| 31 de Março de 2026 | $0.38 | $0.28 | 36.0% | |
| 31 de Dezembro de 2025 | $0.26 | $0.19 | 39.9% | |
| 30 de Setembro de 2025 | $0.24 | $0.27 | -11.3% | |
| 30 de Junho de 2025 | $0.36 | $0.20 | 78.2% | |
| 31 de Março de 2025 | $0.23 | $0.12 | 84.6% |
Fundamentos Completos Todas as métricas por ano — demonstração de resultados, balanço patrimonial, fluxo de caixa
Demonstração de Resultados
| Métrica | Tendência | 2025 | 2024 | 2023 | 2022 | 2021 | 2020 | 2019 | 2018 | 2017 | 2016 | 2015 | 2014 |
|---|---|---|---|---|---|---|---|---|---|---|---|---|---|
| Revenue | $2.21B | $1.96B | $1.90B | $1.85B | $1.86B | $1.91B | $1.98B | $1.84B | $1.77B | $1.85B | $1.76B | $1.61B | |
| SG&A Expense | $170M | $152M | $136M | $128M | $136M | $124M | $127M | $107M | $108M | $107M | $104M | $106M | |
| Operating Expenses | $1.99B | $1.78B | $1.73B | $1.68B | $1.67B | $1.74B | $1.70B | $1.59B | $1.51B | $1.55B | $1.51B | $1.41B | |
| Operating Income | · | · | · | · | · | $163M | $282M | $249M | $260M | $296M | $281M | $240M | |
| Interest Expense | $62M | $67M | $73M | $85M | $86M | $83M | $84M | · | · | · | · | · | |
| Other Non-op | $-289.0K | $2M | $576.0K | $986.0K | $-212.0K | $525.0K | $-123.0K | $-156.0K | $90.0K | $-489.0K | $58.0K | $1M | |
| Pretax Income | $157M | $92M | $96M | $165M | $86M | $60M | $197M | $168M | $192M | $228M | $230M | $202M | |
| Income Tax | $41M | $23M | $28M | $43M | $138M | $4M | $8M | $8M | $14M | $8M | $8M | $7M | |
| Net Income | $117M | $69M | $68M | $122M | $-52M | $54M | $189M | $159M | $178M | $220M | $222M | $195M | |
| EPS (Basic) | $1.09 | $0.62 | $0.59 | $1.03 | $-0.43 | $0.45 | $1.59 | $1.34 | $1.51 | $1.87 | $1.90 | $1.68 | |
| EPS (Diluted) | $1.08 | $0.62 | $0.59 | $1.03 | $-0.43 | $0.45 | $1.59 | $1.34 | $1.50 | $1.87 | $1.88 | $1.66 | |
| Shares (Basic) | 107,028,000 | 110,939,000 | 113,798,000 | 118,199,000 | 120,192,000 | 119,559,000 | 119,028,000 | 118,544,000 | 118,084,000 | 117,384,000 | 116,949,000 | 116,109,000 | |
| Shares (Diluted) | 107,028,000 | 110,939,000 | 113,798,000 | 118,199,000 | 120,192,000 | 120,929,000 | 119,164,000 | 118,716,000 | 118,465,000 | 117,791,000 | 117,785,000 | 117,312,000 | |
| EBITDA | · | · | · | · | · | $163M | $282M | $249M | $260M | $296M | $432M | $354M |
Balanço Patrimonial
| Métrica | Tendência | 2025 | 2024 | 2023 | 2022 | 2021 | 2020 | 2019 | 2018 | 2017 | 2016 | 2015 | 2014 |
|---|---|---|---|---|---|---|---|---|---|---|---|---|---|
| Cash & Equivalents | $98M | $107M | $122M | $149M | $300M | $113M | $92M | $53M | $52M | $38M | $65M | $74M | |
| Receivables | $446M | $289M | $312M | $312M | $283M | $268M | $281M | $271M | $254M | $230M | $234M | $249M | |
| Prepaid Expense | $50M | $39M | $26M | $32M | $27M | $33M | $36M | $29M | $21M | $31M | $41M | $30M | |
| Current Assets | $611M | $450M | $475M | $514M | $627M | $717M | $435M | $374M | $327M | $299M | $342M | $353M | |
| PP&E (Net) | $2.13B | $2.06B | $2.11B | $2.18B | $2.28B | $2.35B | $2.70B | $2.83B | $2.55B | $2.84B | $2.88B | $2.66B | |
| PP&E (Gross) | $4.14B | $3.97B | $3.94B | $3.89B | $3.94B | $3.91B | $4.21B | $4.35B | $3.94B | $4.19B | $4.08B | $3.81B | |
| Accum. Depreciation | $2.01B | $1.91B | $1.82B | $1.72B | $1.66B | $1.56B | $1.51B | $1.52B | $1.39B | $1.35B | $1.19B | $1.15B | |
| Goodwill | $9M | $5M | $5M | $5M | $5M | $6M | $51M | $48M | $41M | $38M | $36M | $16M | |
| Intangibles | $8M | $7M | $7M | $8M | $9M | $11M | · | · | · | · | · | · | |
| Other Non-current Assets | $322M | $224M | $310M | $342M | $365M | $397M | $351M | $141M | $89M | $83M | $85M | $69M | |
| Total Assets | $3.26B | $2.93B | $3.11B | $3.24B | $3.50B | $3.71B | $3.79B | $3.66B | $3.27B | $3.27B | $3.36B | $3.12B | |
| Accounts Payable | $353M | $274M | $286M | $285M | $306M | $274M | $337M | $352M | $278M | $260M | $318M | $318M | |
| Current Liabilities | $369M | $286M | $297M | $451M | $341M | $313M | $369M | $366M | $291M | $272M | $325M | $319M | |
| Capital Leases | $100M | $18M | $71M | $97M | $121M | $145M | $51M | · | · | · | · | · | |
| Deferred Tax | $98M | $89M | $97M | $100M | $88M | · | · | · | · | · | · | · | |
| Other Non-current Liabilities | $170M | $78M | $132M | $155M | $178M | $216M | $106M | $61M | $53M | $52M | $58M | $39M | |
| Total Liabilities | $1.85B | $1.44B | $1.63B | $1.81B | $2.13B | $2.30B | $2.41B | $2.24B | $1.82B | $1.81B | $1.89B | $1.64B | |
| Long-term Debt | $1.22B | $985M | $1.10B | $1.25B | $1.53B | $1.79B | $1.96B | $1.80B | $1.45B | $1.45B | $1.45B | $1.20B | |
| Total Debt | $1.22B | $985M | $1.10B | $1.25B | $1.53B | $1.79B | $1.96B | $1.80B | $1.45B | $1.45B | $1.45B | $1.20B | |
| Common Stock | $1M | $1M | $1M | $1M | $1M | $1M | $1M | $1M | $1M | $1M | $1M | $1M | |
| Retained Earnings | $-123M | $-240M | $-309M | $-376M | $-499M | $-447M | $-446M | $-393M | $-344M | $-323M | $-301M | $-268M | |
| Stockholders' Equity | $1.41B | $1.49B | $1.48B | $1.43B | $1.37B | $1.39B | $1.38B | $1.42B | $1.45B | $1.46B | $1.46B | $1.48B | |
| Liabilities + Equity | $3.26B | $2.93B | $3.11B | $3.24B | $3.50B | $3.71B | $3.79B | $3.66B | $3.27B | $3.27B | $3.36B | $3.12B | |
| Shares Outstanding | 100,051,000 | 109,861,000 | 112,733,000 | 114,988,000 | 120,285,000 | 119,638,000 | 119,096,000 | 118,674,000 | 118,204,000 | 117,554,000 | 117,232,000 | 116,764,000 |
Fluxo de Caixa
| Métrica | Tendência | 2025 | 2024 | 2023 | 2022 | 2021 | 2020 | 2019 | 2018 | 2017 | 2016 | 2015 | 2014 |
|---|---|---|---|---|---|---|---|---|---|---|---|---|---|
| D&A | $129M | $128M | $127M | $128M | $135M | $151M | $145M | $157M | $147M | $167M | $152M | $114M | |
| Stock-based Comp | $28M | $26M | $21M | $18M | $19M | $17M | $17M | $13M | $13M | $18M | $15M | $14M | |
| Deferred Tax | $9M | $-8M | $-3M | $11M | $99M | $5M | $-1M | $-4M | $921.0K | $-4M | $6M | $-3M | |
| Amort. of Intangibles | $800.0K | $500.0K | $500.0K | $1M | $2M | $9M | $7M | $6M | $3M | $3M | $2M | $1M | |
| Restructuring | · | · | · | · | · | · | · | · | · | $4M | $0 | $0 | |
| Other Non-cash | · | · | · | · | · | · | · | · | · | · | $5M | $104M | |
| Operating Cash Flow | $195M | $269M | $232M | $154M | $263M | $356M | $354M | $323M | $341M | $375M | $400M | $424M | |
| CapEx | $142M | $70M | $68M | $83M | $81M | $159M | $191M | $487M | $115M | $135M | $415M | $263M | |
| Investing Cash Flow | $-206M | $-54M | $-59M | $73M | $238M | $13M | $-245M | $-291M | $-125M | $-122M | $-409M | $-197M | |
| Debt Issued | $435M | $547M | $250M | $100M | $741M | $374M | $1.15B | $810M | $476M | $389M | $807M | $250M | |
| Net Debt Issued | $423M | $535M | $240M | $85M | $705M | $342M | $1.13B | $802M | $466M | $384M | $264M | $-5M | |
| Stock Repurchased | $229M | $77M | $43M | $80M | $2M | $4M | $4M | $3M | $6M | $4M | $9M | $4M | |
| Net Stock Activity | $-229M | $-77M | $-43M | $-80M | $-2M | $-4M | $-4M | $-3M | $-6M | $-4M | $-9M | $-4M | |
| Dividends Paid | $45.0K | $136.0K | $131.0K | $886.0K | $3M | $106M | $210M | $204M | $200M | $255M | $251M | $234M | |
| Financing Cash Flow | $2M | $-222M | $-206M | $-375M | $-328M | $-351M | $-65M | $-10M | $-202M | $-281M | $381.0K | $-230M | |
| Net Change in Cash | · | · | · | · | · | · | · | · | $14M | $-28M | $-9M | $-4M | |
| Taxes Paid | $37M | $37M | $26M | $28M | $36M | $1M | $16M | $13M | $8M | $-2M | $10M | $20M | |
| Free Cash Flow | $53M | $199M | $164M | $70M | $182M | $196M | $164M | $-164M | $227M | $241M | $-16M | $161M | |
| Levered FCF | $7M | $148M | $113M | $7M | $233M | · | · | · | · | · | · | · |
Lucratividade
| Métrica | Tendência | 2025 | 2024 | 2023 | 2022 | 2021 | 2020 | 2019 | 2018 | 2017 | 2016 | 2015 | 2014 |
|---|---|---|---|---|---|---|---|---|---|---|---|---|---|
| Operating Margin | · | · | · | · | · | 8.5% | 14.2% | 13.6% | · | · | 16.0% | 14.9% | |
| Net Margin | 5.3% | 3.5% | 3.6% | 6.6% | -2.8% | 2.8% | 9.5% | 8.7% | · | · | 12.6% | 12.1% | |
| Pretax Margin | 7.1% | 4.7% | 5.1% | 9.0% | 4.6% | 3.1% | 9.9% | 9.1% | · | · | 13.1% | 12.5% | |
| EBITDA Margin | · | · | · | · | · | 8.5% | 14.2% | 13.6% | · | · | 24.6% | 22.0% | |
| ROA | 3.8% | 2.3% | 2.1% | 3.6% | -1.4% | 1.4% | 5.1% | 4.6% | 5.4% | 6.6% | 6.9% | 6.4% | |
| ROE | 8.0% | 4.6% | 4.7% | 8.7% | -3.8% | 3.9% | 13.7% | 11.2% | 12.2% | 15.2% | 15.1% | 13.1% | |
| ROIC | · | · | · | · | · | 4.7% | 8.1% | 7.4% | 8.3% | 9.8% | 9.3% | 8.6% |
Liquidez e Solvência
| Métrica | Tendência | 2025 | 2024 | 2023 | 2022 | 2021 | 2020 | 2019 | 2018 | 2017 | 2016 | 2015 | 2014 |
|---|---|---|---|---|---|---|---|---|---|---|---|---|---|
| Current Ratio | 1.7 | 1.6 | 1.6 | 1.1 | 1.8 | 2.3 | 1.2 | 1.0 | 1.1 | 1.1 | 1.1 | 1.1 | |
| Quick Ratio | 1.5 | 1.4 | 1.5 | 1.0 | 1.7 | 1.2 | 1.0 | 0.9 | 1.1 | 1.0 | 0.9 | 1.0 | |
| Debt / Equity | 0.9 | 0.7 | 0.7 | 0.9 | 1.1 | 1.3 | 1.4 | 1.3 | 1.0 | 1.0 | 1.0 | 0.8 | |
| LT Debt / Equity | 0.9 | 0.7 | 0.7 | 0.8 | 1.1 | 1.3 | 1.4 | 1.3 | 1.0 | 1.0 | 1.0 | 0.8 |
Eficiência
| Métrica | Tendência | 2025 | 2024 | 2023 | 2022 | 2021 | 2020 | 2019 | 2018 | 2017 | 2016 | 2015 | 2014 |
|---|---|---|---|---|---|---|---|---|---|---|---|---|---|
| Asset Turnover | 0.7 | 0.6 | 0.6 | 0.5 | 0.5 | 0.5 | 0.5 | 0.5 | · | · | 0.5 | 0.5 | |
| Receivables Turnover | 6.0 | 6.5 | 6.1 | 6.2 | 6.8 | 6.9 | 7.2 | 7.0 | · | · | 7.3 | 6.5 |
Por Ação
| Métrica | Tendência | 2025 | 2024 | 2023 | 2022 | 2021 | 2020 | 2019 | 2018 | 2017 | 2016 | 2015 | 2014 |
|---|---|---|---|---|---|---|---|---|---|---|---|---|---|
| Book Value / Share | $14.05 | $13.59 | $13.11 | $12.46 | $11.41 | $11.62 | $11.56 | $11.92 | $12.28 | $12.41 | $12.48 | $12.69 | |
| Revenue / Share | $20.66 | $17.68 | $16.54 | $15.49 | $15.50 | $15.76 | $16.62 | $15.46 | · | · | · | · | |
| Cash Flow / Share | $1.82 | $2.43 | $2.02 | $1.29 | $2.19 | $2.94 | $2.97 | $2.72 | $2.88 | $3.19 | · | · | |
| Cash / Share | $0.98 | $0.98 | $1.08 | $1.30 | $2.49 | $0.95 | $0.77 | $0.44 | $0.44 | $0.32 | $0.56 | $0.64 | |
| Dividend / Share | · | · | · | $0.00 | $0.00 | $0.44 | $1.76 | $1.72 | $1.68 | $2.04 | $2.16 | $2.04 | |
| EPS (TTM) | $1.08 | $0.62 | $0.59 | $1.03 | $-0.43 | $0.45 | $1.59 | $1.34 | $1.50 | $1.87 | $1.88 | $1.66 |
Taxas de Crescimento
| Métrica | Tendência | 2025 | 2024 | 2023 | 2022 | 2021 | 2020 | 2019 | 2018 | 2017 | 2016 | 2015 | 2014 |
|---|---|---|---|---|---|---|---|---|---|---|---|---|---|
| Revenue YoY | 12.7% | 3.4% | 2.8% | -0.93% | -2.2% | · | · | · | · | · | · | · | |
| Revenue CAGR 3Y | 6.2% | 1.7% | -0.16% | · | · | · | · | · | · | · | · | · | |
| Revenue CAGR 5Y | 3.0% | · | · | · | · | · | · | · | · | · | · | · | |
| EPS YoY | 74.2% | 5.1% | -42.7% | · | · | · | · | · | · | · | · | · | |
| EPS CAGR 3Y | 1.6% | · | 9.4% | · | · | · | · | · | · | · | · | · | |
| EPS CAGR 5Y | 19.1% | · | · | · | · | · | · | · | · | · | · | · | |
| Net Income YoY | 69.2% | 1.9% | -44.7% | · | · | · | · | · | · | · | · | · | |
| Net Income CAGR 3Y | -1.6% | · | 7.7% | · | · | · | · | · | · | · | · | · | |
| Net Income CAGR 5Y | 16.6% | · | · | · | · | · | · | · | · | · | · | · | |
| Dividends Paid CAGR 5Y | -78.8% | · | · | · | · | · | · | · | · | · | · | · |
Avaliação (TTM)
| Métrica | Tendência | 2025 | 2024 | 2023 | 2022 | 2021 | 2020 | 2019 | 2018 | 2017 | 2016 | 2015 | 2014 |
|---|---|---|---|---|---|---|---|---|---|---|---|---|---|
| Revenue TTM | $2.21B | $1.96B | $1.90B | $1.85B | $1.86B | $1.91B | $1.98B | $1.84B | $1.77B | $1.85B | $1.76B | $1.61B | |
| Net Income TTM | $117M | $69M | $68M | $122M | $-52M | $54M | $189M | $159M | $178M | $220M | $222M | $195M | |
| Market Cap | $1.91B | $2.39B | $1.64B | $1.33B | $1.20B | $784M | $2.07B | $2.12B | $2.66B | $2.88B | $3.11B | $4.24B | |
| Enterprise Value | $3.03B | $3.27B | $2.61B | $2.43B | $2.43B | $2.46B | $3.94B | $3.86B | $4.05B | $4.28B | $4.49B | $5.37B | |
| P/E | 17.7 | 35.1 | 24.6 | 11.2 | -23.2 | 14.6 | 10.9 | 13.3 | 15.0 | 13.1 | 14.1 | 21.9 | |
| P/S | 0.9 | 1.2 | 0.9 | 0.7 | 0.6 | 0.4 | 1.0 | 1.2 | 1.5 | 1.6 | 1.8 | 2.6 | |
| P/B | 1.4 | 1.6 | 1.1 | 0.9 | 0.9 | 0.6 | 1.5 | 1.5 | 1.8 | 2.0 | 2.1 | 2.9 | |
| P / Tangible Book | 1.4 | 1.6 | 1.1 | 0.9 | 0.9 | 0.6 | · | · | · | · | · | · | |
| P / Cash Flow | 9.8 | 8.9 | 7.1 | 8.7 | 4.6 | 2.2 | 5.8 | 6.6 | 7.8 | 7.7 | 7.8 | 10.0 | |
| P / FCF | 36.2 | 12.0 | 10.0 | 19.0 | 6.6 | 4.0 | 12.6 | -12.9 | 11.7 | 11.9 | -198.5 | 26.4 | |
| EV / EBITDA | · | · | · | · | · | 15.1 | 14.0 | 15.5 | 15.6 | 14.4 | 10.4 | 15.2 | |
| EV / FCF | 57.5 | 16.4 | 15.9 | 34.6 | 13.4 | 12.5 | 24.1 | -23.5 | 17.9 | 17.8 | -287.2 | 33.3 | |
| EV / Revenue | 1.4 | 1.7 | 1.4 | 1.3 | 1.3 | 1.3 | 2.0 | 2.1 | 2.3 | 2.3 | 2.6 | 3.3 | |
| Dividend Yield | 0.00% | 0.01% | 0.01% | 0.07% | 0.21% | 13.5% | 10.1% | 9.7% | 7.5% | 8.9% | 8.1% | 5.5% | |
| Earnings Yield | 5.7% | 2.9% | 4.1% | 8.9% | -4.3% | 6.9% | 9.2% | 7.5% | 6.7% | 7.6% | 7.1% | 4.6% | |
| Payout Ratio | 0.04% | 0.20% | 0.19% | 0.72% | -4.8% | 195.7% | 110.9% | 128.3% | 112.5% | 116.2% | 113.0% | 120.0% | |
| Annual Payout | $45.0K | $136.0K | $131.0K | $886.0K | $3M | $106M | $210M | $204M | $200M | $255M | $251M | $234M |
Demonstração de Resultados
| Métrica | Tendência | Q2 2026 | Q1 2026 | Q4 2025 | Q3 2025 | Q2 2025 | Q1 2025 | Q4 2024 | Q3 2024 | Q2 2024 | Q1 2024 | Q4 2023 | Q3 2023 | Q2 2023 | Q1 2023 | Q4 2022 | Q3 2022 |
|---|---|---|---|---|---|---|---|---|---|---|---|---|---|---|---|---|---|
| Revenue | $685M | $615M | $604M | $580M | $538M | $489M | $479M | $492M | $490M | $501M | $491M | $484M | $464M | $458M | $471M | $464M | |
| SG&A Expense | $44M | $44M | $44M | $45M | $44M | $36M | $41M | $41M | $34M | $36M | $37M | $34M | $33M | $33M | $35M | $30M | |
| Operating Expenses | $616M | $545M | $548M | $530M | $473M | $441M | $441M | $447M | $442M | $446M | $438M | $446M | $426M | $418M | $419M | $434M | |
| Interest Expense | $22M | $18M | $18M | $17M | $13M | $15M | $16M | $16M | $17M | $19M | $18M | $18M | $18M | $19M | $20M | $21M | |
| Other Non-op | $797.0K | $-8.0K | $-223.0K | $4.0K | $-35.0K | $-35.0K | $1M | $767.0K | $444.0K | $-58.0K | $619.0K | $-74.0K | $78.0K | $-47.0K | $52.0K | $-71.0K | |
| Pretax Income | $48M | $52M | $36M | $37M | $52M | $32M | $25M | $30M | $28M | $9M | $37M | $20M | $19M | $21M | $33M | $93M | |
| Income Tax | $10M | $14M | $10M | $10M | $14M | $7M | $6M | $9M | $9M | $-500.0K | $10M | $6M | $4M | $8M | $8M | $24M | |
| Net Income | $37M | $38M | $27M | $26M | $39M | $25M | $19M | $21M | $19M | $10M | $26M | $14M | $15M | $12M | $24M | $68M | |
| EPS (Basic) | $0.38 | $0.38 | $0.26 | $0.25 | $0.35 | $0.23 | $0.18 | $0.19 | $0.17 | $0.08 | $0.23 | $0.12 | $0.13 | $0.11 | $0.19 | $0.59 | |
| EPS (Diluted) | $0.37 | $0.38 | $0.26 | $0.24 | $0.35 | $0.23 | $0.18 | $0.19 | $0.17 | $0.08 | $0.23 | $0.12 | $0.13 | $0.11 | $0.20 | $0.58 | |
| Shares (Basic) | 98,891,000 | 98,720,000 | · | 106,853,000 | 108,627,000 | 109,489,000 | · | 110,271,000 | 110,954,000 | 112,306,000 | · | 113,605 | 113,628 | 114,533,000 | · | 116,569,000 | |
| Shares (Diluted) | 98,891,000 | 98,720,000 | · | 106,853,000 | 108,627,000 | 109,489,000 | · | 110,271,000 | 110,954,000 | 112,306,000 | · | 113,605 | 113,628 | 114,533,000 | · | 117,450,000 |
Balanço Patrimonial
| Métrica | Tendência | Q2 2026 | Q1 2026 | Q4 2025 | Q3 2025 | Q2 2025 | Q1 2025 | Q4 2024 | Q3 2024 | Q2 2024 | Q1 2024 | Q4 2023 | Q3 2023 | Q2 2023 | Q1 2023 | Q4 2022 | Q3 2022 |
|---|---|---|---|---|---|---|---|---|---|---|---|---|---|---|---|---|---|
| Cash & Equivalents | $109M | $210M | $98M | $57M | $131M | $74M | $107M | $108M | $60M | $111M | · | $104M | $42M | $51M | · | $185M | |
| Receivables | $463M | $480M | $446M | $351M | $300M | $282M | $289M | $265M | $274M | $274M | · | $269M | $262M | $256M | · | $293M | |
| Prepaid Expense | $78M | $37M | $50M | $43M | $40M | $43M | $39M | $34M | $39M | $33M | · | $33M | $37M | $28M | · | $31M | |
| Current Assets | $667M | $743M | $611M | $472M | $487M | $413M | $450M | $416M | $383M | $426M | · | $420M | $354M | $356M | · | $530M | |
| PP&E (Net) | $2.15B | $2.12B | $2.13B | $2.12B | $2.06B | $2.06B | $2.06B | $2.07B | $2.08B | $2.10B | · | $2.13B | $2.14B | $2.15B | · | $2.18B | |
| PP&E (Gross) | · | · | $4.14B | · | · | · | $3.97B | · | · | · | · | · | · | · | · | · | |
| Accum. Depreciation | $2.07B | $2.04B | $2.01B | $1.98B | $1.95B | $1.93B | $1.91B | $1.89B | $1.87B | $1.85B | · | $1.80B | $1.77B | $1.74B | · | $1.69B | |
| Goodwill | $59M | $9M | $9M | $9M | $5M | $5M | $5M | $5M | $5M | $5M | · | $5M | $5M | $5M | · | $5M | |
| Intangibles | · | · | $8M | · | · | · | $7M | · | · | · | · | · | · | · | · | · | |
| Other Non-current Assets | $403M | $313M | $322M | $326M | $332M | $337M | $224M | $231M | $236M | $301M | · | $312M | $323M | $335M | · | $350M | |
| Total Assets | $3.46B | $3.37B | $3.26B | $3.11B | $3.07B | $3.00B | $2.93B | $2.91B | $2.90B | $3.03B | · | $3.07B | $3.03B | $3.06B | · | $3.27B | |
| Accounts Payable | $390M | $288M | $353M | $320M | $290M | $254M | $274M | $263M | $255M | $254M | · | $290M | $260M | $259M | · | $296M | |
| Current Liabilities | $506M | $305M | $369M | $334M | $304M | $267M | $286M | $275M | $266M | $365M | · | $304M | $274M | $272M | · | $473M | |
| Capital Leases | · | · | $100M | · | · | · | $18M | · | · | · | · | · | · | · | · | · | |
| Deferred Tax | $110M | $111M | $98M | $93M | $93M | $95M | $89M | $91M | $89M | $92M | · | $98M | $96M | $101M | · | $98M | |
| Other Non-current Liabilities | $163M | $167M | $170M | $173M | $180M | $184M | $78M | $79M | $80M | $125M | · | $133M | $140M | $149M | · | $160M | |
| Total Liabilities | $2.02B | $1.97B | $1.85B | $1.64B | $1.59B | $1.53B | $1.44B | $1.44B | $1.46B | $1.58B | · | $1.61B | $1.59B | $1.64B | · | $1.87B | |
| Long-term Debt | $1.35B | $1.40B | $1.22B | $1.04B | $1.02B | $983M | $985M | $992M | $1.02B | $1.09B | · | $1.07B | $1.07B | $1.11B | · | $1.29B | |
| Total Debt | $1.35B | $1.40B | · | $1.04B | $1.02B | $983M | · | $992M | $1.02B | $1.09B | · | $1.07B | $1.07B | $1.11B | · | $1.29B | |
| Common Stock | $989.0K | $989.0K | $1M | $1M | $1M | $1M | $1M | $1M | $1M | $1M | · | $1M | $1M | $1M | · | $1M | |
| Retained Earnings | $-48M | $-86M | $-123M | $-150M | $-176M | $-215M | $-240M | $-259M | $-280M | $-299M | · | $-335M | $-349M | $-364M | · | $-401M | |
| Stockholders' Equity | $1.44B | $1.40B | $1.41B | $1.47B | $1.48B | $1.48B | $1.49B | $1.48B | $1.45B | $1.44B | · | $1.46B | $1.44B | $1.42B | · | $1.40B | |
| Liabilities + Equity | $3.46B | $3.37B | $3.26B | $3.11B | $3.07B | $3.00B | $2.93B | $2.91B | $2.90B | $3.03B | · | $3.07B | $3.03B | $3.06B | · | $3.27B | |
| Shares Outstanding | 98,893,000 | 98,887,000 | 100,051,000 | 105,383,000 | 107,311,000 | 109,318,000 | 109,861,000 | 110,271,000 | 110,271,000 | 111,568,000 | · | 113,605,000 | 113,605,000 | 113,685,000 | · | 114,981,000 |
Fluxo de Caixa
| Métrica | Tendência | Q2 2026 | Q1 2026 | Q4 2025 | Q3 2025 | Q2 2025 | Q1 2025 | Q4 2024 | Q3 2024 | Q2 2024 | Q1 2024 | Q4 2023 | Q3 2023 | Q2 2023 | Q1 2023 | Q4 2022 | Q3 2022 |
|---|---|---|---|---|---|---|---|---|---|---|---|---|---|---|---|---|---|
| D&A | $36M | $33M | $34M | $33M | $31M | $31M | $32M | $32M | $32M | $32M | $32M | $33M | $32M | $31M | $32M | $32M | |
| Stock-based Comp | $6M | $7M | $7M | $7M | $7M | $7M | $7M | $8M | $5M | $6M | $5M | $5M | $5M | $5M | $6M | $2M | |
| Deferred Tax | $-1M | $13M | $5M | $684.0K | $-2M | $5M | $-2M | $2M | $-3M | $-5M | $-1M | $2M | $-6M | $2M | $2M | $6M | |
| Operating Cash Flow | $133M | $14M | $-376.0K | $54M | $97M | $44M | $39M | $91M | $68M | $70M | $22M | $84M | $36M | $90M | $35M | $24M | |
| CapEx | $38M | $21M | $45M | $38M | $35M | $25M | $23M | $18M | $19M | $11M | $28M | $18M | $16M | $6M | $31M | $18M | |
| Investing Cash Flow | $-182M | $-23M | $-39M | $-107M | $-35M | $-25M | $-19M | $-13M | $-18M | $-4M | $-20M | $-18M | $-11M | $-11M | $-29M | $125M | |
| Debt Issued | $155M | $310M | $260M | $125M | $40M | $10M | $0 | $0 | $47M | $500M | $125M | $25M | $30M | $70M | $0 | $0 | |
| Net Debt Issued | · | $306M | · | · | · | $7M | · | · | · | $497M | · | · | · | $68M | · | · | |
| Stock Repurchased | $48.0K | $55M | $95M | $40M | $43M | $51M | $8M | $0 | $20M | $49M | $13M | $0 | $699.0K | $30M | $807.0K | $39M | |
| Net Stock Activity | · | $-55M | · | · | · | $-51M | · | · | · | $-49M | · | · | · | $-30M | · | · | |
| Dividends Paid | · | · | $0 | $0 | $45.0K | $0 | $0 | $0 | $116.0K | $20.0K | $0 | $0 | $0 | $131.0K | $0 | $0 | |
| Financing Cash Flow | $-52M | $121M | $80M | $-18M | $-7M | $-54M | $-16M | $-28M | $-102M | $-76M | $8M | $-3M | $-35M | $-176M | $-44M | $-77M | |
| Taxes Paid | $27M | $-451.0K | $9M | $22M | $6M | $-97.0K | $10M | $6M | $21M | $-96.0K | $7M | $5M | $13M | $200.0K | $3M | $11M | |
| Free Cash Flow | · | $-7M | · | · | · | $20M | · | · | · | $60M | · | · | · | $84M | · | · | |
| Levered FCF | · | $-20M | · | · | · | $8M | · | · | · | $40M | · | · | · | $72M | · | · |
Lucratividade
| Métrica | Tendência | Q2 2026 | Q1 2026 | Q4 2025 | Q3 2025 | Q2 2025 | Q1 2025 | Q4 2024 | Q3 2024 | Q2 2024 | Q1 2024 | Q4 2023 | Q3 2023 | Q2 2023 | Q1 2023 | Q4 2022 | Q3 2022 |
|---|---|---|---|---|---|---|---|---|---|---|---|---|---|---|---|---|---|
| Net Margin | 5.4% | 6.2% | · | 4.5% | 7.2% | 5.1% | · | 4.3% | 3.9% | 1.9% | · | 2.9% | 3.2% | 2.7% | · | 14.7% | |
| Pretax Margin | 6.9% | 8.5% | · | 6.3% | 9.7% | 6.6% | · | 6.1% | 5.6% | 1.8% | · | 4.0% | 4.1% | 4.5% | · | 19.9% | |
| ROA | 1.1% | 1.2% | · | 0.87% | 1.3% | 0.83% | · | 0.71% | 0.64% | 0.31% | · | 0.44% | 0.47% | 0.38% | · | 2.0% | |
| ROE | 2.5% | 2.6% | · | 1.8% | 2.6% | 1.7% | · | 1.4% | 1.3% | 0.67% | · | 0.97% | 1.1% | 0.88% | · | 5.0% |
Liquidez e Solvência
| Métrica | Tendência | Q2 2026 | Q1 2026 | Q4 2025 | Q3 2025 | Q2 2025 | Q1 2025 | Q4 2024 | Q3 2024 | Q2 2024 | Q1 2024 | Q4 2023 | Q3 2023 | Q2 2023 | Q1 2023 | Q4 2022 | Q3 2022 |
|---|---|---|---|---|---|---|---|---|---|---|---|---|---|---|---|---|---|
| Current Ratio | 1.3 | 2.4 | · | 1.4 | 1.6 | 1.6 | · | 1.5 | 1.4 | 1.2 | · | 1.4 | 1.3 | 1.3 | · | 1.1 | |
| Quick Ratio | 1.1 | 2.3 | · | 1.2 | 1.4 | 1.3 | · | 1.4 | 1.3 | 1.1 | · | 1.2 | 1.1 | 1.1 | · | 1.0 | |
| Debt / Equity | 0.9 | 1.0 | · | 0.7 | 0.7 | 0.7 | · | 0.7 | 0.7 | 0.8 | · | 0.7 | 0.7 | 0.8 | · | 0.9 | |
| LT Debt / Equity | 0.9 | 1.0 | · | 0.7 | 0.7 | 0.7 | · | 0.7 | 0.7 | 0.7 | · | 0.7 | 0.7 | 0.8 | · | 0.8 |
Eficiência
| Métrica | Tendência | Q2 2026 | Q1 2026 | Q4 2025 | Q3 2025 | Q2 2025 | Q1 2025 | Q4 2024 | Q3 2024 | Q2 2024 | Q1 2024 | Q4 2023 | Q3 2023 | Q2 2023 | Q1 2023 | Q4 2022 | Q3 2022 |
|---|---|---|---|---|---|---|---|---|---|---|---|---|---|---|---|---|---|
| Asset Turnover | 0.2 | 0.2 | · | 0.2 | 0.2 | 0.2 | · | 0.2 | 0.2 | 0.2 | · | 0.2 | 0.1 | 0.1 | · | 0.1 | |
| Receivables Turnover | 1.8 | 1.6 | · | 1.9 | 1.9 | 1.8 | · | 1.8 | 1.8 | 1.9 | · | 1.7 | 1.7 | 1.8 | · | 1.8 |
Por Ação
| Métrica | Tendência | Q2 2026 | Q1 2026 | Q4 2025 | Q3 2025 | Q2 2025 | Q1 2025 | Q4 2024 | Q3 2024 | Q2 2024 | Q1 2024 | Q4 2023 | Q3 2023 | Q2 2023 | Q1 2023 | Q4 2022 | Q3 2022 |
|---|---|---|---|---|---|---|---|---|---|---|---|---|---|---|---|---|---|
| Book Value / Share | $14.55 | $14.11 | · | $13.95 | $13.77 | $13.49 | · | $13.39 | $13.13 | $12.94 | · | $12.84 | $12.67 | $12.49 | · | $12.19 | |
| Revenue / Share | $6.93 | $6.23 | · | $5.43 | $4.95 | $4.46 | · | $4457.73 | $4417.23 | $4.46 | · | $4.23 | $4.07 | $3.97 | · | $3.95 | |
| Cash Flow / Share | · | $0.14 | · | · | · | $0.41 | · | · | · | $0.63 | · | · | · | $0.78 | · | · | |
| Cash / Share | $1.10 | $2.12 | · | $0.54 | $1.22 | $0.68 | · | $0.98 | $0.55 | $1.00 | · | $0.91 | $0.37 | $0.45 | · | $1.61 | |
| EPS (TTM) | $1.25 | $1.23 | · | $1.00 | $0.95 | $0.77 | · | $0.67 | $0.60 | $0.56 | · | $0.56 | $1.02 | $0.98 | · | $1.07 |
Avaliação (TTM)
| Métrica | Tendência | Q2 2026 | Q1 2026 | Q4 2025 | Q3 2025 | Q2 2025 | Q1 2025 | Q4 2024 | Q3 2024 | Q2 2024 | Q1 2024 | Q4 2023 | Q3 2023 | Q2 2023 | Q1 2023 | Q4 2022 | Q3 2022 |
|---|---|---|---|---|---|---|---|---|---|---|---|---|---|---|---|---|---|
| Revenue TTM | $2.48B | $2.34B | · | $2.09B | $2.00B | $1.95B | · | $1.97B | $1.97B | $1.94B | · | $1.88B | $1.86B | $1.85B | · | $1.85B | |
| Net Income TTM | $128M | $129M | · | $109M | $104M | $84M | · | $76M | $69M | $65M | · | $66M | $120M | $116M | · | $126M | |
| Market Cap | $3.00B | $1.87B | · | $2.14B | $2.26B | $2.22B | · | $1.39B | $1.43B | $1.74B | · | $1.28B | $1.07B | $1.05B | · | $1.02B | |
| Enterprise Value | $4.24B | $3.06B | · | $3.13B | $3.15B | $3.13B | · | $2.28B | $2.39B | $2.72B | · | $2.24B | $2.10B | $2.10B | · | $2.12B | |
| P/E | 24.3 | 15.4 | · | 20.4 | 22.2 | 26.4 | · | 18.9 | 21.6 | 27.9 | · | 20.1 | 9.2 | 9.4 | · | 8.3 | |
| P/S | 1.2 | 0.8 | · | 1.0 | 1.1 | 1.1 | · | 0.7 | 0.7 | 0.9 | · | 0.7 | 0.6 | 0.6 | · | 0.6 | |
| P/B | 2.1 | 1.3 | · | 1.5 | 1.5 | 1.5 | · | 0.9 | 1.0 | 1.2 | · | 0.9 | 0.7 | 0.7 | · | 0.7 | |
| P / Tangible Book | 2.2 | 1.3 | · | 1.5 | 1.5 | 1.5 | · | 0.9 | 1.0 | 1.2 | · | 0.9 | 0.7 | 0.7 | · | 0.7 | |
| P / Cash Flow | · | 135.8 | · | · | · | 49.9 | · | · | · | 24.8 | · | · | · | 11.6 | · | · | |
| EV / Revenue | 1.7 | 1.3 | · | 1.5 | 1.6 | 1.6 | · | 1.2 | 1.2 | 1.4 | · | 1.2 | 1.1 | 1.1 | · | 1.1 | |
| Dividend Yield | 0.00% | 0.00% | · | 0.00% | 0.00% | 0.01% | · | 0.01% | 0.01% | 0.00% | · | 0.01% | 0.01% | 0.01% | · | 0.09% | |
| Earnings Yield | 4.1% | 6.5% | · | 4.9% | 4.5% | 3.8% | · | 5.3% | 4.6% | 3.6% | · | 5.0% | 10.8% | 10.7% | · | 12.1% | |
| Payout Ratio | · | · | · | · | · | 0.00% | · | · | · | 0.21% | · | · | · | 1.1% | · | · | |
| Annual Payout | $45.0K | $45.0K | · | $45.0K | $45.0K | $116.0K | · | $136.0K | $136.0K | $20.0K | · | $131.0K | $131.0K | $151.0K | · | $886.0K |
Período mais recente à esquerda · valores nulos mostrados como ·
Demonstrações Financeiras Demonstração de resultados, balanço patrimonial, fluxo de caixa — anual, últimos 5 anos
| Métrica | 2025-12-31 | 2024-12-31 | 2023-12-31 | 2022-12-31 | 2021-12-31 |
|---|---|---|---|---|---|
| Receita | $2.21B | $1.96B | $1.90B | $1.85B | $1.86B |
| Lucro líquido | $117M | $69M | $68M | $122M | $-52M |
| EPS Diluído | $1.08 | $0.62 | $0.59 | $1.03 | $-0.43 |
| Métrica | 2025-12-31 | 2024-12-31 | 2023-12-31 | 2022-12-31 | 2021-12-31 |
|---|---|---|---|---|---|
| Dívida / Patrimônio Líquido | 0.9 | 0.7 | 0.7 | 0.9 | 1.1 |
| Índice de liquidez corrente | 1.7 | 1.6 | 1.6 | 1.1 | 1.8 |
| Índice de Liquidez Seca | 1.5 | 1.4 | 1.5 | 1.0 | 1.7 |
| Métrica | 2025-12-31 | 2024-12-31 | 2023-12-31 | 2022-12-31 | 2021-12-31 |
|---|---|---|---|---|---|
| Fluxo de caixa livre | $53M | $199M | $164M | $70M | $182M |
Investidores institucionais (13F) 311 declarantes · $2.9B total · Em 30 de Setembro de 2026
Instituições que relatam a posse desta ação em seu Formulário 13F trimestral da SEC. Apenas posições compradas; um único declarante pode aparecer duas vezes para opções separadas. Grandes posições de compra/venda compensatórias geralmente refletem market-making ou inventário protegido, não convicção direcional.
| Novas posições | Posições encerradas | Aumentou | Diminuído | Variação líquida de ações |
|---|---|---|---|---|
| 73 (+17 vs trimestre anterior) | 30 (0 vs trimestre anterior) | 89 (+15 vs trimestre anterior) | 85 (-3 vs trimestre anterior) | +3.4M |
Comparado a Q1 2026. Os registros do Formulário 13F da SEC devem ser feitos em até 45 dias após o final do trimestre, mais um pequeno período de tolerância para registrantes atrasados — trimestres ainda dentro desse período são ignorados em favor do par mais recente totalmente reportado.
| Instituição | Valor | Ações | % de 13F rastreado | Tipo |
|---|---|---|---|---|
| BlackRock, Inc. | $480.557.341 | 15.818.214 | 16,60% | Ações |
| VANGUARD GROUP INC | $242.955.349 | 12.713.519 | 8,39% | Ações |
| River Road Asset Management, LLC | $220.150.797 | 7.246.570 | 7,60% | Ações |
| VANGUARD PORTFOLIO MANAGEMENT LLC | $207.554.155 | 6.831.934 | 7,17% | Ações |
| GOLDMAN SACHS GROUP INC | $142.064.809 | 4.676.261 | 4,91% | Ações |
| VANGUARD CAPITAL MANAGEMENT LLC | $130.238.908 | 4.286.995 | 4,50% | Ações |
| STATE STREET CORP | $115.370.723 | 3.797.588 | 3,99% | Ações |
| Rubric Capital Management LP | $86.505.106 | 2.847.436 | 2,99% | Ações |
| GEODE CAPITAL MANAGEMENT, LLC | $77.074.409 | 2.536.413 | 2,66% | Ações |
| MORGAN STANLEY | $69.158.301 | 2.276.441 | 2,39% | Ações |
| LEE DANNER & BASS INC | $65.161.789 | 2.144.891 | 2,25% | Ações |
| Allianz Asset Management GmbH | $64.685.369 | 2.129.209 | 2,23% | Ações |
| Shay Capital LLC | $54.289.060 | 1.787.000 | 1,88% | Ações |
| Philosophy Capital Management LLC | $50.043.911 | 1.647.265 | 1,73% | Ações |
| CHARLES SCHWAB INVESTMENT MANAGEMENT INC | $49.946.421 | 1.644.056 | 1,73% | Ações |
| NORTHERN TRUST CORP | $34.091.252 | 1.122.161 | 1,18% | Ações |
| Luxor Capital Group, LP | $33.960.283 | 1.117.850 | 1,17% | Ações |
| Park West Asset Management LLC | $27.310.010 | 898.947 | 0,94% | Ações |
| JB CAPITAL PARTNERS LP | $25.677.480 | 845.210 | 0,89% | Ações |
| SUSQUEHANNA INTERNATIONAL GROUP, LLP | $25.212.362 | 829.900 | 0,87% | Opção de compra |
| Qube Research & Technologies Ltd | $21.275.023 | 700.297 | 0,73% | Ações |
| VANGUARD FIDUCIARY TRUST CO | $19.746.484 | 649.983 | 0,68% | Ações |
| DEUTSCHE BANK AG\ | $18.805.068 | 618.995 | 0,65% | Ações |
| Bank of New York Mellon Corp | $18.515.569 | 609.466 | 0,64% | Ações |
| PEAK6 LLC | $18.288.760 | 602.000 | 0,63% | Opção de compra |
| CITADEL ADVISORS LLC | $17.261.794 | 568.196 | 0,60% | Ações |
| BRIDGEWAY CAPITAL MANAGEMENT, LLC | $17.250.706 | 567.831 | 0,60% | Ações |
| MILLENNIUM MANAGEMENT LLC | $16.873.508 | 555.415 | 0,58% | Ações |
| GOLDENTREE ASSET MANAGEMENT LP | $16.283.680 | 536.000 | 0,56% | Ações |
| TWO SIGMA INVESTMENTS, LP | $15.027.194 | 494.641 | 0,52% | Ações |
| Philadelphia Financial Management of San Francisco, LLC | $14.559.159 | 479.235 | 0,50% | Ações |
| PRINCIPAL FINANCIAL GROUP INC | $14.518.936 | 477.911 | 0,50% | Ações |
| RAYMOND JAMES FINANCIAL INC | $14.139.399 | 465.418 | 0,49% | Ações |
| CITADEL ADVISORS LLC | $13.440.112 | 442.400 | 0,46% | Opção de compra |
| WELLS FARGO & COMPANY/MN | $13.020.868 | 428.600 | 0,45% | Opção de compra |
| Nearwater Capital Markets, Ltd | $10.633.000 | 350.000 | 0,37% | Ações |
| Nuveen, LLC | $10.385.495 | 341.853 | 0,36% | Ações |
| JANE STREET GROUP, LLC | $10.365.656 | 341.200 | 0,36% | Opção de compra |
| Invesco Ltd. | $10.224.875 | 336.566 | 0,35% | Ações |
| Empowered Funds, LLC | $10.217.736 | 336.331 | 0,35% | Ações |
| Philosophy Capital Management LLC | $9.114.000 | 3.000 | 0,31% | Opção de compra |
| ALGERT GLOBAL LLC | $9.017.969 | 296.839 | 0,31% | Ações |
| JPMORGAN CHASE & CO | $8.948.636 | 290.868 | 0,31% | Ações |
| Caption Management, LLC | $8.661.338 | 285.100 | 0,30% | Opção de compra |
| VOYA INVESTMENT MANAGEMENT LLC | $8.564.244 | 281.904 | 0,30% | Ações |
| TUDOR INVESTMENT CORP ET AL | $8.401.285 | 276.540 | 0,29% | Ações |
| IMC-Chicago, LLC | $8.229.486 | 270.885 | 0,28% | Ações |
| VICTORY CAPITAL MANAGEMENT INC | $8.151.470 | 268.317 | 0,28% | Ações |
| SUSQUEHANNA INTERNATIONAL GROUP, LLP | $8.148.129 | 268.207 | 0,28% | Ações |
| WELLS FARGO & COMPANY/MN | $8.103.696 | 266.744 | 0,28% | Ações |
Ativistas e proprietários de 5%+ 6 participações
Investidores que apresentaram o Schedule 13D da SEC — propriedade benéfica acima de 5% com a intenção de influenciar o emissor (participações ativistas, campanhas no conselho, M&A). Cada linha mostra o estado mais recente conhecido da posição desse declarante.
| Declarante | Declarado | Participação | Status | Propósito | Declaração |
|---|---|---|---|---|---|
| Mason Capital Management LLC, Kenneth M. Garschina, Michael E. Martino ×2 declarações | 5 de Janeiro de 2022 | · | Declaração inicial | · | SEC |
| Corvex Management LP, Keith Meister, Marcato, L.P., Marcato II, L.P., Marcato International Master Fund Ltd., Marcato Capital Management LLC, Richard T. McGuire ×4 declarações | 5 de Setembro de 2012 | · | Declaração inicial | Investimento passivo | SEC |
| Loeb Partners Corporation, Loeb Arbitrage Fund, Loeb Offshore Fund, Ltd. ×2 declarações | 8 de Março de 2004 | · | Declaração inicial | · | SEC |
| Pessoa de relato não divulgada, Pessoa de relato não divulgada | 7 de Dezembro de 2001 | · | Declaração inicial | Investimento passivo | SEC |
| Pessoa de relato não divulgada | 2 de Agosto de 2001 | · | Declaração inicial | Investimento passivo | SEC |
| Pessoa de relato não divulgada | 22 de Maio de 2001 | · | Declaração inicial | · | SEC |
Purpose is an automated classification of the filer's own stated purpose (SEC Item 4) — not investment advice. "—" means no clear purpose was stated or the text could not be classified.
Executivos da empresa 46 insiders · 19 diretores · 21 conselheiros
| Investidor com informação privilegiada | Função | Última atividade | Ações detidas | Compras 12m | Vendas 12m | Líquido 12m |
|---|---|---|---|---|---|---|
| Swindle, Patrick D. | President & CEO | 20 de Fevereiro de 2026 F | 316.058 | 0 | 0 | $0 |
| David Garfinkle | EVP & Chief Financial Officer | 21 de Agosto de 2026 S | 293.353 | 0 | 4 | $-3.511.345 |
| Irving E Lingo JR | EVP, Chief Financial Officer | 13 de Março de 2007 D | 7.907 | 0 | 0 | $0 |
| James A Seaton | EVP, Chief Operating Officer | 17 de Fevereiro de 2004 A | · | 0 | 0 | $0 |
| Carter, Cole G. | Chief Administrative Officer | 1 de Outubro de 2026 S | 165.883 | 0 | 8 | $-2.535.750 |
| Daren Swenson | EVP, Chief Corr & Reentry Ofcr | 11 de Setembro de 2026 S | 142.666 | 0 | 1 | $-697.000 |
| Anthony L Grande | EVP, Chief Development Officer | 26 de Agosto de 2026 S | 144.782 | 0 | 4 | $-1.688.586 |
| Laura A Groschen | EVP, Chf Info & Digital Ofcr | 17 de Fevereiro de 2026 A | 77.720 | 0 | 0 | $0 |
| David K Churchill | Chief Human Resources Officer | 21 de Fevereiro de 2025 F | 168.120 | 0 | 0 | $0 |
| Kim White | EVP, Human Resources | 25 de Fevereiro de 2019 F | 42.518 | 0 | 0 | $0 |
| Scott D Irwin | EVP, General Counsel & Secy. | 22 de Fevereiro de 2018 F | 20.905 | 0 | 0 | $0 |
| John D Ferguson | Executive Chairman | 29 de Março de 2016 S | 50.573 | 0 | 0 | $0 |
| Steve E Groom | EVP, GENERAL COUNSEL & SECY. | 16 de Março de 2016 S | 19.873 | 0 | 0 | $0 |
| Brian D Collins | EVP & Chief HR Officer | 28 de Maio de 2013 M | 51.448 | 0 | 0 | $0 |
| Richard P Seiter | Executive Vice President & CCO | 5 de Maio de 2011 S | 33.638 | 0 | 0 | $0 |
| G A Puryear IV | EVP, General Counsel | 25 de Fevereiro de 2010 F | 48.296 | 0 | 0 | $0 |
| William K Rusak | Chief Human Resources Officer | 25 de Fevereiro de 2009 F | 30.201 | 0 | 0 | $0 |
| Kenneth A Bouldin | EVP, Chief Development Officer | 15 de Agosto de 2007 D | 16.874 | 0 | 0 | $0 |
| Anthony M Dadante | EVP, Chief People Officer | 7 de Março de 2006 F | 19.245 | 0 | 0 | $0 |
| John R Prann JR | Conselheiro | 26 de Agosto de 2026 S | 5.000 | 0 | 5 | $-3.351.524 |
| Mark A Emkes | Conselheiro | 24 de Agosto de 2026 S | 141.274 | 0 | 1 | $-1.027.500 |
| Stacey Tank | Conselheiro | 18 de Fevereiro de 2026 A | 14.833 | 0 | 0 | $0 |
| Catherine Hernandez-Blades | Conselheiro | 18 de Fevereiro de 2026 A | 24.639 | 0 | 0 | $0 |
| Stacia Hylton | Conselheiro | 18 de Fevereiro de 2026 A | 91.320 | 0 | 0 | $0 |
| Alexander R Fischer | Conselheiro | 18 de Fevereiro de 2026 A | 30.775 | 0 | 0 | $0 |
| Dawn S. Smith | Conselheiro | 18 de Fevereiro de 2026 A | 14.833 | 0 | 0 | $0 |
| Nina A Tran | Conselheiro | 18 de Fevereiro de 2026 A | 14.833 | 0 | 0 | $0 |
| Robert J Dennis | Conselheiro | 19 de Fevereiro de 2025 A | 84.426 | 0 | 0 | $0 |
| Anne L Mariucci | Conselheiro | 11 de Novembro de 2024 S | 101.936 | 0 | 0 | $0 |
| ALVARADO DONNA M | Conselheiro | 17 de Fevereiro de 2023 A | 124.908 | 0 | 0 | $0 |
| Charles L Overby | Conselheiro | 1 de Dezembro de 2021 G | 61.257 | 0 | 0 | $0 |
| Michael C Jacobi | Conselheiro | 2 de Março de 2017 S | 1 | 0 | 0 | $0 |
| Joseph V Russell | Conselheiro | 9 de Dezembro de 2015 P | 248.806 | 0 | 0 | $0 |
| CORRENTI JOHN D | Conselheiro | 19 de Fevereiro de 2015 A | 23.078 | 0 | 0 | $0 |
| HORNE JOHN R | Conselheiro | 31 de Dezembro de 2013 A | 58.758 | 0 | 0 | $0 |
| William F Andrews | Conselheiro | 15 de Novembro de 2013 S | 164.130 | 0 | 0 | $0 |
| Dennis Deconcini | Conselheiro | 20 de Maio de 2013 J | 17.105 | 0 | 0 | $0 |
| Henri L Wedell | Conselheiro | 31 de Dezembro de 2012 M | 656.281 | 0 | 0 | $0 |
| Lucius E Burch III | Conselheiro | 14 de Maio de 2009 A | 378.616 | 0 | 0 | $0 |
| Harley G. Lappin | · | 14 de Agosto de 2026 S | 50.328 | 0 | 2 | $-825.567 |
| Thurgood Marshall JR | · | 13 de Agosto de 2026 S | 45.274 | 0 | 1 | $-241.400 |
| Lucibeth Mayberry | · | 12 de Agosto de 2026 S | 149.329 | 0 | 1 | $-3.994.800 |
| Devin Ignatius Murphy | · | 12 de Agosto de 2026 S | 63.826 | 0 | 1 | $-273.631 |
| Damon T Hininger | · | 20 de Fevereiro de 2026 F | 1.002.450 | 0 | 0 | $0 |
| Todd Mullenger | · | 16 de Março de 2014 F | 125.291 | 0 | 0 | $0 |
| Jimmy Turner | · | 17 de Fevereiro de 2004 A | 10.126 | 0 | 0 | $0 |
Executivos de declarações SEC Formulário 3/4/5; líquido = apenas P/V de mercado aberto
Participação em ETFs Detido por 41 ETFs
O peso reflete apenas participações diretas em ações (N-PORT); fundos alavancados ou baseados em derivativos podem deter exposição adicional a swaps não mostrada.
| Fundo | Peso | Unidades | Em | Fonte |
|---|---|---|---|---|
| PSCI · Invesco Exchange-Traded Fund Trust … | 1,05% | 86.418 SH | 1 de Outubro de 2026 | Diário |
| BSJR · Invesco Exchange-Traded Self-Indexe… | 0,87% | 7.518.000 | 1 de Outubro de 2026 | Diário |
| RZV · Invesco Exchange-Traded Fund Trust | 0,36% | 31.169 SH | 1 de Outubro de 2026 | Diário |
| VIOV · VANGUARD ADMIRAL FUNDS | 0,32% | 209.833 SH | 19 de Agosto de 2026 | Diário |
| JPSE · J.P. Morgan Exchange-Traded Fund Tr… | 0,27% | 54.242 NS | 31 de Julho de 2026 | N-PORT |
| FYT · First Trust Exchange-Traded AlphaDE… | 0,24% | 15.734 NS | 31 de Julho de 2026 | N-PORT |
| QVMS · Invesco Exchange-Traded Fund Trust … | 0,20% | 14.424 SH | 1 de Outubro de 2026 | Diário |
| VTWV · VANGUARD SCOTTSDALE FUNDS | 0,19% | 85.931 SH | 19 de Agosto de 2026 | Diário |
| FYX · First Trust Exchange-Traded AlphaDE… | 0,19% | 86.142 NS | 31 de Julho de 2026 | N-PORT |
| VIOO · VANGUARD ADMIRAL FUNDS | 0,16% | 345.801 SH | 19 de Agosto de 2026 | Diário |
| RWJ · Invesco Exchange-Traded Fund Trust … | 0,15% | 91.539 SH | 1 de Outubro de 2026 | Diário |
| SMDX · Tidal Trust III | 0,14% | 6.303 NS | 31 de Julho de 2026 | N-PORT |
| BBSC · J.P. Morgan Exchange-Traded Fund Tr… | 0,11% | 26.685 NS | 31 de Julho de 2026 | N-PORT |
| IWM · iShares Trust | 0,11% | 2.517.562 SH | 11 de Setembro de 2026 | Diário |
| PKW · Invesco Exchange-Traded Fund Trust | 0,10% | 49.251 SH | 1 de Outubro de 2026 | Diário |
| RSSL · Global X Funds | 0,09% | 47.073 NS | 31 de Julho de 2026 | N-PORT |
| VTWO · VANGUARD SCOTTSDALE FUNDS | 0,09% | 565.887 SH | 19 de Agosto de 2026 | Diário |
| VBR · VANGUARD INDEX FUNDS | 0,06% | 1.367.955 SH | 19 de Agosto de 2026 | Diário |
| FAB · First Trust Exchange-Traded AlphaDE… | 0,05% | 2.721 NS | 31 de Julho de 2026 | N-PORT |
| NFRA · FlexShares Trust | 0,04% | 42.366 NS | 31 de Julho de 2026 | N-PORT |
| FIDU · FIDELITY COVINGTON TRUST | 0,04% | 31.640 NS | 31 de Julho de 2026 | N-PORT |
| VIS · VANGUARD WORLD FUND | 0,04% | 117.305 SH | 19 de Agosto de 2026 | Diário |
| WSML · iShares Trust | 0,03% | 5.954 SH | 11 de Setembro de 2026 | Diário |
| VXF · VANGUARD INDEX FUNDS | 0,03% | 1.135.030 SH | 19 de Agosto de 2026 | Diário |
| VB · VANGUARD INDEX FUNDS | 0,03% | 2.155.180 SH | 19 de Agosto de 2026 | Diário |
| OMFS · Invesco Exchange-Traded Self-Indexe… | 0,02% | 1.869 SH | 1 de Outubro de 2026 | Diário |
| PRF · Invesco Exchange-Traded Fund Trust | 0,01% | 44.768 SH | 1 de Outubro de 2026 | Diário |
| TILT · FlexShares Trust | 0,01% | 7.426 NS | 31 de Julho de 2026 | N-PORT |
| IWV · iShares Trust | 0,01% | 31.430 SH | 11 de Setembro de 2026 | Diário |
| ITOT · iShares Trust | 0,00% | 130.648 SH | 11 de Setembro de 2026 | Diário |
| VTI · VANGUARD INDEX FUNDS | 0,00% | 2.974.542 SH | 19 de Agosto de 2026 | Diário |
| VT · VANGUARD INTERNATIONAL EQUITY INDEX… | 0,00% | 81.407 SH | 19 de Agosto de 2026 | Diário |
| VTHR · VANGUARD SCOTTSDALE FUNDS | 0,00% | 8.111 SH | 19 de Agosto de 2026 | Diário |
| IJR · iShares Trust | · | 6.030.210 SH | 10 de Setembro de 2026 | Diário |
| IJS · iShares Trust | · | 882.495 SH | 8 de Setembro de 2026 | Diário |
| IWN · iShares Trust | · | 924.253 SH | 11 de Setembro de 2026 | Diário |
| SVAL · iShares Trust | · | 29.706 SH | 3 de Setembro de 2026 | Diário |
| ISCB · iShares Trust | · | 4.346 SH | 11 de Setembro de 2026 | Diário |
| ISCV · iShares Trust | · | 21.771 SH | 11 de Setembro de 2026 | Diário |
| SMLF · iShares Trust | · | 193.902 SH | 11 de Setembro de 2026 | Diário |
| SMMV · iShares Trust | · | 6.493 SH | 19 de Agosto de 2026 | Diário |
CXW Consenso dos analistas Opiniões de analistas otimistas e pessimistas, preço-alvo de 12 meses, potencial de alta
Preço-alvo de 12 meses
5 analistas · 2026-10-02Alvo médio $41.80 +25,0%
Comparação de pares (subindústria GICS) Métricas chave vs pares do setor
Base do ano fiscal, preços no fechamento do último ano fiscal de cada empresa.
Minhas Métricas Sua lista pessoal — linhas selecionadas de Fundamentos Completos
Escolha as métricas que importam para si — clique no + ao lado de qualquer linha em Fundamentos Completos acima.
Sua seleção é salva e acompanha você em todos os tickers.