
MTB M&T Bank Corporation Common Stock
NYSE · Banking · SEC EDGAR'da Görüntüle ↗ 10-K/10-Q Ağu 4, 2026MTB Hisse Senedi Özeti Fiyat, piyasa değeri, P/E, EPS, ROE, borç/öz sermaye, 52 haftalık aralık
MTB Hisse Senedi Fiyat Grafiği Teknik göstergeler ile günlük OHLCV — kaydır, yakınlaştır ve görünümünüzü özelleştirin
Çubuk çözünürlüğü seçilen döneme uyum sağlar — bir çubuk için açılış/yüksek/düşük/kapanış değerlerini görmek için grafiğin üzerine gelin.
| Ex-tarihi | Bölünme | Tür |
|---|---|---|
| 06 Ekim 2000 | 10-for-1 | İleri |
| 25 Eylül 1987 | 2-for-1 | İleri |
M&T Bank Corporation Common Stock Hakkında Wikipedia'dan şirket genel bakışı
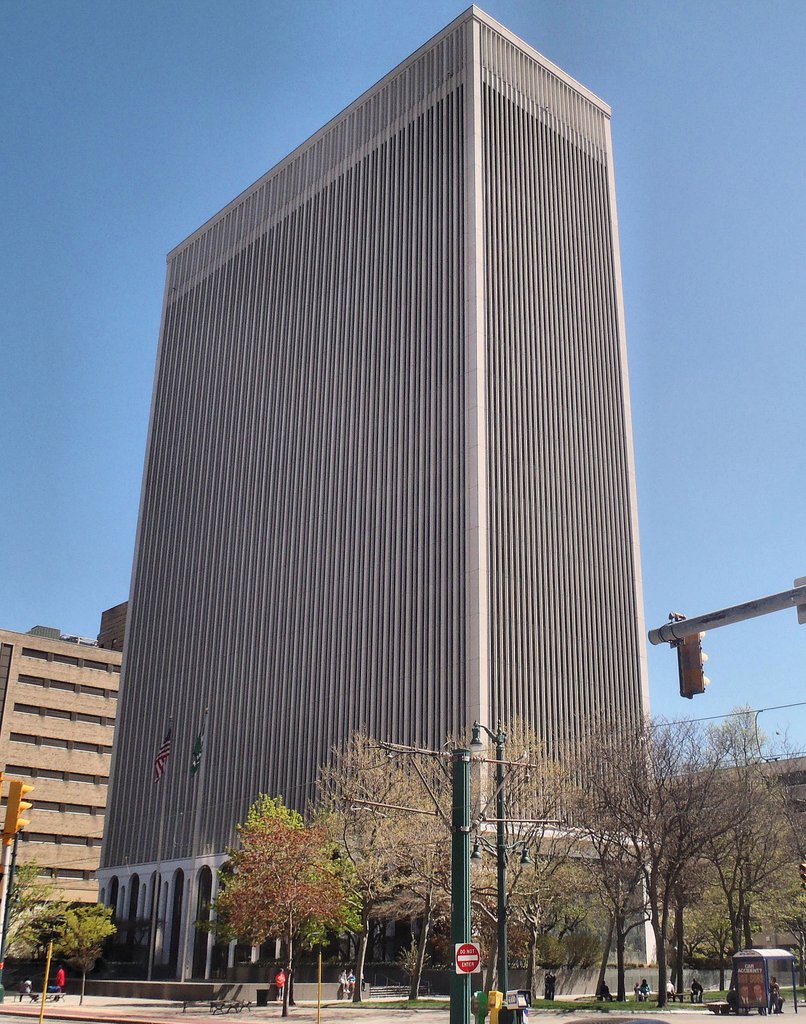
M&T Bank Corporation (Manufacturers and Traders Trust Company) is an American bank holding company headquartered in Buffalo, New York. It operates 940+ branches in 12 states and Washington D.C. across the Eastern United States, from Maine to Virginia. Until May 1998, the bank's holding company was named First Empire State Corporation.
M&T Bank has been profitable in every quarter since 1976. Along with Northern Trust, M&T was one of two banks in the S&P 500 not to lower their dividends during the 2008 financial crisis.
The bank owns the Buffalo Savings Bank building in downtown Buffalo, Bridgeport Center in Bridgeport, Connecticut, and the M&T Tech Hub in the Seneca One Tower. It also sponsors M&T Bank Stadium, home of the Baltimore Ravens, as well as M&T Bank Auditorium and M&T Bank Atrium of the University at Buffalo. M&T Bank is the official bank of the Buffalo Bills in Western New York and of their home Highmark Stadium in Orchard Park. Wilmington Trust is a subsidiary of M&T Bank Corporation, offering global corporate and institutional services, private banking, investment management, and fiduciary services.
History
19th century
In the mid-19th century, few banking options existed for the growing number of manufacturers in the city of Buffalo. As a result, businessmen Pascal Pratt and Bronson Rumsey founded M&T Bank in 1856 as "Manufacturers and Traders Trust Company". Henry Martin, former president of the Attica and Buffalo Railroad, was appointed the first president and assigned a salary of $1,000 a year. The company opened its first office on August 29 of that year at 2 East Swan Street in Buffalo. In 1885, Martin retired as president, at the age of 83, and was succeeded by Pascal Pratt, who had served as Vice President since the bank was formed.
20th century
In 1901, the bank built a new headquarters on a site purchased for $210,000 near the southwest corner of Main and Swan Streets in Buffalo. The granite neo-classical building was designed by architect E. B. Green of Green & Wicks. By 1914, Robert Livingston Fryer was the bank's President. In 1917, Harry T. Ramsdell, the bank's fourth president, served as a district chairman for a special subscription committee of the national Liberty Loan program.
Following the 1925 merger with Fidelity Trust, the $100 million company was headed by Fidelity's President, 36-year-old Lewis G. Harriman. Harriman and a group of investors including A. H. Schoellkopf, from the founding family of the Niagara Mohawk power company, and James V. Forrestal, who would become the first U.S. Secretary of Defense, own enough shares to control both Fidelity and M&T.
In 1961, M&T acquired an entire block on Main Street between North Division and Eagle Streets in downtown Buffalo and began plans for a $12 million skyscraper to become the bank's new headquarters. In 1963, architect Minoru Yamasaki, who was featured on the cover of Time magazine that year as he was designing the World Trade Center in New York City, was retained by M&T to design its new building in Buffalo, which was completed in 1967. In 1964, Charles W. Millard succeeded Harriman as chairman of M&T.
In 1969, M&T's stockholders voted to create a multi-bank holding company known as First Empire State Corporation. In 1983, the bank which had assets of $2 billion and operated 60 offices, named Robert G. Wilmers as chairman and CEO, a position he held until his death in December 2017. In 1995, First Empire formed a national bank subsidiary, M&T Bank, N.A.
21st century
In 2008, M&T received a $600 million investment by the United States Treasury as a result of the Troubled Asset Relief Program (TARP) and M&T assumed another $482 million in TARP obligations from its acquisitions. In 2012, the bank repaid $700 million of TARP funds.
In June 2014, a U.S. District Judge ordered M&T Bank to forfeit $560,000 that had been laundered through its Perry Hall, Maryland, branch; from 2011 to 2013, Deanna Bailey went to the branch and had head teller Sabrina Fitts convert cash amounts from $20,000 to $100,000 into larger bills. Fitts accepted a 1% transaction fee in exchange for not filing a currency transaction report. This violated the Bank Secrecy Act of 1970.
On December 16, 2017, non-executive chairman Robert T. Brady became acting chairman and CEO. On December 20, 2017, René F. Jones was appointed chairman and CEO. In 2021, M&T Bank contributed $33.9 million to over 3,000 nonprofit organizations across eight states and the District of Columbia. The bank has donated more than $279.4 million to nonprofits over the past decade, and over $437.5 million to nonprofits over the past two decades.
In May 2022, M&T announced a $25 million initiative to support lower-income communities and underrepresented groups. The new Amplify Fund will be deployed over three years with most of the funds set to be distributed to Connecticut-based organizations and other north-eastern states where People’s United had operated. M&T announced that $9 to $11 million will be distributed by the end of 2022, with the rest of the funds to be distributed over the next two years and expects to fund approximately 60 to 70 organizations in the initiatives first phase. In August 2022, M&T announced a partnership with Stefon Diggs; Diggs served as a brand ambassador for M&T’s “Football Brings Us Together” campaign. In October 2022, M&T launched its Multicultural Banking Center in East Hartford, Connecticut; the bank has 118 multicultural locations. In 2022, M&T was listed as one of the Best Places to Work for Disability Inclusion by the Disability Equality Index (DEI) for its fourth consecutive year.
Mergers and acquisitions
Between 1945 and 1966, M&T acquired 18 local banking institutions. Between 1987 and 2022, M&T Bank acquired 24 financial institutions, as follows:
1920s
December 1925: merged with Fidelity Trust Company under the name Manufacturers and Traders Trust Company
May 1927: acquired the People's Bank of Buffalo
1940s
June 1945: acquired the First National Bank of Kenmore
October 1945: acquired the Citizens National Bank of Lancaster
December 1945: acquired the American Bank of Lackawanna
1980s
December 1987: acquired East New York Savings, which operated 15 branches in metropolitan New York City
1990s
January 1990: acquired $486 million in deposits and 11 offices in Rochester from Monroe Savings Bank of Rochester, New York
September 1990: acquired $1.3 billion in deposits and 13 offices (9 in Buffalo and 4 in Rochester) of Empire of America Savings Bank of Buffalo
May 1991: acquired $2.1 billion in deposits and 14 branches of Goldome Bank of Buffalo
July 1992: acquired $1.1 billion asset Central Trust of Rochester, New York, and the $300 million asset Endicott Trust of Binghamton, New York.
December 1994: acquired $146 million in deposits from the Hudson Valley branches of Chemical Bank; and $470 million in assets and $339 million in deposits from Ithaca Bancorp of Ithaca, New York.
July 1995: acquired Hudson Valley branches of Chase Manhattan
January 1997: acquired Green Point Bank branches of Westchester, New York
June 1999: acquired First National Bank of Rochester
April 1998: acquired OnBank of Syracuse, New York
September 1999: acquired 29 Chase Bank Branches in Buffalo, Jamestown, and Binghamton New York.
2000s
October 2000: acquired Keystone Financial of Central Pennsylvania
February 2001: acquired Premier Nation Bancorp of Newburgh
April 2003: acquired Allfirst Bank of Baltimore, a subsidiary of Allied Irish Banks of Ireland, in exchange for 26.7 million shares of M&T and $886 million in cash. At the direction of Irish government financial regulators, AIB sold its 22% ownership interest in M&T in 2010.
June 2006: acquired 21 Citibank branches in Buffalo and Rochester
December 2007: acquired Partners Trust Financial Group, including 33 branches in upstate New York, for $555 million.
December 2007: acquired 12 First Horizon National Corporation branches in the greater Washington, D.C., and Baltimore markets.
May 2009: acquired Provident Bank of Maryland in a stock transaction.
August 2009: The Federal Deposit Insurance Corporation (FDIC) seized Bradford Bank and sold all its deposits and most assets to M&T. M&T and the FDIC agreed to share future losses on $338 million worth of Bradford's assets.
2010s
November 2010: acquired K Bank of Baltimore, Maryland
May 2011: acquired Wilmington Trust for $351 million in stock.
August 2012: M&T announced the acquisition of Hudson City Bancorp for $3.7 billion. The bank had $25 billion in deposits and $28 billion in loans and 135 brick-and-mortar branch locations including 97 in New Jersey. The acquisition was delayed for 3 years due to a money laundering case involving an M&T branch and the acquisition closed on November 2, 2015.
2020s
April 2022: acquired People's United Bank in an all-stock transaction valued at approximately $8.3 billion. The acquisition was completed on April 2, 2022.
Kaynak: Wikipedia (İngilizce), CC BY-SA 4.0 · Wikipedia'da Görüntüle ↗
10 Yıllık Performans Gelir, net kar, marjlar ve EPS trendleri
Değerleme P/E, P/S, P/B, EV/EBITDA oranları — hisse senedi pahalı mı ucuz mu?
| Metrik | 5 Yıllık trend | MTB | 5Y ort. | Akran Ortalaması | Sonuç |
|---|---|---|---|---|---|
| P/E (TTM) | 11.75Y ort. ≈11.4 | ≈11.4 | 12.3 | Aşırı değerli | |
| PEG Ratio (PEG Oranı) | ≈1.0 | · | · | · |
Akran ortalaması, metrik başına standartlaştırılmış bir temelde hesaplanır ve bu hisse senedi için gösterilen TTM/MRQ temelini her zaman eşleşmeyebilir.
Kârlılık Brüt, faaliyet ve net kâr marjları; ROE, ROA, ROIC
| Metrik | 5 Yıllık trend | MTB | 5Y ort. | Akran Ortalaması | Sonuç |
|---|---|---|---|---|---|
| EBITDA Margin (FAVÖK Marjı) | 19.5% | · | 6.6% | En üst düzey | |
| Vergi Öncesi Kar Marjı (TTM) | 230.3%5Y ort. ≈109.6% | ≈109.6% | 41.4% | En üst düzey | |
| Net Kâr Marjı (TTM) | 178.1%5Y ort. ≈84.8% | ≈84.8% | 32.3% | En üst düzey | |
| ROA (TTM) | 1.4%5Y ort. ≈1.3% | ≈1.3% | 1.2% | Aynı seviyede | |
| ROE (TTM) | 10.7%5Y ort. ≈9.5% | ≈9.5% | 9.5% | Aynı seviyede |
Finansal Sağlık Borç, likidite, solventlik — bilanço gücü
| Metrik | 5 Yıllık trend | MTB | 5Y ort. | Akran Ortalaması | Sonuç |
|---|---|---|---|---|---|
| Borç / Öz Sermaye (MRQ) | 0.25Y ort. ≈0.1 | ≈0.1 | 0.2 | Aynı seviyede |
Büyüme Gelir, EPS ve net gelir büyümesi: YOY, 3 Yıllık CAGR, 5 Yıllık CAGR
| Metrik | 5 Yıllık trend | MTB | 5Y ort. | Akran Ortalaması | Sonuç |
|---|---|---|---|---|---|
| Revenue YoY (Gelir Yıllık Bazda) | 7.5%5Y ort. ≈-13.0% | ≈-13.0% | · | · | |
| Revenue CAGR 3Y (Gelir 3 Yıllık Bileşik Büyüme Oranı) | 2.8%5Y ort. ≈-23.6% | ≈-23.6% | · | · | |
| Revenue CAGR 5Y (Gelir 5 Yıllık Bileşik Büyüme Oranı) | -22.6% | · | · | · | |
| EPS YoY (EPS YB) | 16.1%5Y ort. ≈13.6% | ≈13.6% | · | · | |
| Net Income YoY (Net Gelir Yıllık Bazda) | 10.2%5Y ort. ≈17.3% | ≈17.3% | · | · | |
| EPS CAGR 3Y (EPS Bileşik Yıllık Büyüme Oranı 3Y) | 13.8%5Y ort. ≈10.8% | ≈10.8% | · | · | |
| EPS CAGR 5Y (EPS Bileşik Yıllık Büyüme Oranı 5Y) | 11.3% | · | · | · | |
| Net Income CAGR 3Y (Net Gelir Bileşik Yıllık Büyüme Oranı 3Y) | 12.7%5Y ort. ≈17.0% | ≈17.0% | · | · | |
| Net Income CAGR 5Y (Net Gelir Bileşik Yıllık Büyüme Oranı 5Y) | 16.1% | · | · | · |
Sermaye Verimliliği Aktif devir hızı, stok devir hızı, alacak devir hızı
| Metrik | 5 Yıllık trend | MTB | 5Y ort. | Akran Ortalaması | Sonuç |
|---|---|---|---|---|---|
| Asset Turnover (Aktif Devir Hızı) | 0.05Y ort. ≈0.0 | ≈0.0 | 0.0 | Zayıf | |
| Revenue / Employee (Çalışan Başına Gelir) | ≈$76.8K | · | · | · |
değer · ≈ 5Y ort. · sektör ortalaması · ortalamaya göre değerlendirme
Temettüler Temettü verimi, ödeme oranı, temettü geçmişi, 5 Yıllık CAGR
| Ex-tarihi | Miktar | Para Birimi | Temettü Verimi |
|---|---|---|---|
| Eyl 1, 2026 | $1,50 | USD | ≈2.6% |
| Haz 1, 2026 | $1,50 | USD | ≈2.8% |
| Mar 2, 2026 | $1,50 | USD | ≈2.7% |
| Ara 1, 2025 | $1,50 | USD | ≈3.0% |
| Eyl 2, 2025 | $1,50 | USD | ≈2.8% |
| Haz 2, 2025 | $1,35 | USD | ≈3.0% |
| Mar 3, 2025 | $1,35 | USD | ≈2.9% |
| Ara 2, 2024 | $1,35 | USD | ≈2.5% |
| Eyl 3, 2024 | $1,35 | USD | ≈3.1% |
| Haz 3, 2024 | $1,35 | USD | ≈3.5% |
| Mar 1, 2024 | $1,30 | USD | ≈3.8% |
| Kas 30, 2023 | $1,30 | USD | ≈4.1% |
| Ağu 31, 2023 | $1,30 | USD | ≈4.1% |
| May 31, 2023 | $1,30 | USD | ≈4.2% |
| Mar 3, 2023 | $1,30 | USD | ≈3.2% |
| Kas 30, 2022 | $1,20 | USD | ≈2.8% |
| Ağu 31, 2022 | $1,20 | USD | ≈2.6% |
| May 31, 2022 | $1,20 | USD | ≈2.6% |
| Şub 25, 2022 | $1,20 | USD | ≈2.5% |
| Kas 29, 2021 | $1,20 | USD | ≈3.0% |
Kazanç Geçmişi EPS gerçekleşen vs tahmin, sürpriz %, kazanma oranı, bir sonraki kazanç tarihi
| Dönem | Rapor | EPS Gerçek | EPS Tahmin | Sürpriz |
|---|---|---|---|---|
| 30 Eylül 2026 | Eki 16, 2026 | $5.04 | $5.01 | 0.66% |
| 30 Haziran 2026 | Tem 15, 2026 | $5.32 | $4.71 | 13.0% |
| 31 Mart 2026 | $4.13 | $4.05 | 2.0% | |
| 31 Aralık 2025 | $4.67 | $4.52 | 3.4% | |
| 30 Eylül 2025 | $4.82 | $4.47 | 7.8% | |
| 30 Haziran 2025 | $4.24 | $4.03 | 5.1% | |
| 31 Mart 2025 | $3.32 | $3.43 | -3.3% |
Tüm Temeller Tüm metrikler yıla göre — gelir tablosu, bilanço, nakit akışı
Gelir Tablosu
| Metrik | Eğilim | 2025 | 2024 | 2023 | 2022 | 2021 | 2020 | 2019 | 2018 | 2017 | 2016 | 2015 | 2014 |
|---|---|---|---|---|---|---|---|---|---|---|---|---|---|
| Revenue | $1.66B | $1.54B | $1.48B | $1.52B | $5.99B | $5.95B | $6.19B | $5.93B | $5.63B | $5.30B | $4.67B | $4.46B | |
| Interest Expense | · | · | $3.11B | $425M | $114M | $326M | $749M | $526M | $387M | $426M | $328M | $280M | |
| Interest Income | $10.49B | $11.03B | $10.22B | $6.25B | $3.94B | $4.19B | $4.88B | $4.60B | $4.17B | $3.90B | $3.17B | $2.96B | |
| Pretax Income | $3.69B | $3.31B | $3.62B | $2.61B | $2.46B | $1.77B | $2.55B | $2.51B | $2.32B | $2.06B | $1.67B | $1.64B | |
| Income Tax | $841M | $722M | $878M | $620M | $596M | $416M | $618M | $590M | $916M | $743M | $595M | $576M | |
| Net Income | $2.85B | $2.59B | $2.74B | $1.99B | $1.86B | $1.35B | $1.93B | $1.92B | $1.41B | $1.32B | $1.08B | $1.07B | |
| EPS (Basic) | $17.10 | $14.71 | $15.85 | $11.59 | $13.81 | $9.94 | $13.76 | $12.75 | $8.72 | $7.80 | $7.22 | $7.47 | |
| EPS (Diluted) | $17.00 | $14.64 | $15.79 | $11.53 | $13.80 | $9.94 | $13.75 | $12.74 | $8.70 | $7.78 | $7.18 | $7.42 | |
| Shares (Basic) | 157,875,000 | 166,479,000 | 166,361,000 | 163,174,000 | 128,649,000 | 128,638,000 | 134,428,000 | 143,992,000 | 152,159,000 | 156,780,000 | 136,803,000 | 130,950,000 | |
| Shares (Diluted) | 158,791,000 | 167,319,000 | 167,002,000 | 164,030,000 | 128,812,000 | 128,704,000 | 134,462,000 | 144,151,000 | 152,551,000 | 157,304,000 | 137,533,000 | 131,844,000 | |
| EBITDA | $323M | $316M | · | · | · | · | · | · | · | · | · | · |
Bilanço
| Metrik | Eğilim | 2025 | 2024 | 2023 | 2022 | 2021 | 2020 | 2019 | 2018 | 2017 | 2016 | 2015 | 2014 |
|---|---|---|---|---|---|---|---|---|---|---|---|---|---|
| Cash & Equivalents | · | · | · | · | · | · | · | · | $1.42B | $1.32B | $1.37B | $1.37B | |
| PP&E (Net) | $1.63B | $1.71B | $1.74B | $1.65B | $1.14B | $1.16B | $1.14B | $647M | $646M | $675M | $667M | $613M | |
| PP&E (Gross) | $2.44B | $2.46B | $2.34B | $2.19B | $1.03B | $1.73B | $1.59B | $1.49B | $1.49B | $1.44B | $1.41B | $1.31B | |
| Accum. Depreciation | $1.36B | $1.33B | $1.22B | $1.16B | $1.79B | $978M | $891M | $844M | $841M | $762M | $740M | $701M | |
| Goodwill | $8.46B | $8.46B | $8.46B | $8.49B | $4.59B | $4.59B | $4.59B | $4.59B | $4.59B | $4.59B | $4.59B | $3.52B | |
| Intangibles | $64M | $94M | $147M | $209M | $4M | $14M | $29M | $47M | $72M | $98M | $140M | $35M | |
| Total Assets | $213.51B | $208.10B | $208.26B | $200.73B | $155.11B | $142.60B | $119.87B | $120.10B | $118.59B | $123.45B | $122.79B | $96.69B | |
| Short-term Debt | $2.15B | $1.06B | $5.32B | $3.56B | $47M | $59M | $62M | $4.40B | $175M | $163M | $2.13B | $193M | |
| Total Liabilities | $184.33B | $179.08B | $181.31B | $175.41B | $137.20B | $126.41B | $104.16B | $104.64B | $102.34B | $106.96B | $106.61B | $84.35B | |
| Long-term Debt | $10.91B | $12.61B | $8.20B | $3.96B | $3.49B | $4.38B | $6.99B | $8.44B | $8.14B | $9.49B | $10.65B | $9.01B | |
| Total Debt | $2.15B | $1.06B | $5.32B | $3.55B | $47M | $59M | $62M | $4.40B | $175M | $163M | $2.13B | $193M | |
| Common Stock | $90M | $90M | $90M | $90M | $80M | $80M | $80M | $80M | $80M | $80M | $80M | $66M | |
| Paid-in Capital | $10.01B | $10.00B | $10.02B | $10.00B | $6.63B | $6.62B | $6.59B | $6.58B | $6.59B | $6.68B | $6.68B | $3.41B | |
| Retained Earnings | $20.88B | $19.08B | $17.52B | $15.75B | $14.65B | $13.44B | $12.82B | $11.52B | $10.16B | $9.22B | $8.43B | $7.81B | |
| Treasury Stock | $4.92B | $2.37B | $2.23B | $1.75B | $5.08B | $5.14B | $4.82B | $3.53B | $1.45B | $432M | · | · | |
| AOCI | $277M | $-164M | $-459M | $-790M | $-127M | $-62M | $-207M | $-420M | $-364M | $-295M | $-252M | $-181M | |
| Stockholders' Equity | $29.18B | $29.03B | $26.96B | $25.32B | $17.90B | $16.19B | $15.72B | $15.46B | $16.25B | $16.49B | $16.17B | $12.34B | |
| Liabilities + Equity | $213.51B | $208.10B | $208.26B | $200.73B | $155.11B | $142.60B | $119.87B | $120.10B | $118.59B | $123.45B | $122.79B | $96.69B |
Nakit Akışı
| Metrik | Eğilim | 2025 | 2024 | 2023 | 2022 | 2021 | 2020 | 2019 | 2018 | 2017 | 2016 | 2015 | 2014 |
|---|---|---|---|---|---|---|---|---|---|---|---|---|---|
| D&A | $323M | $316M | $304M | $282M | · | · | · | $105M | $110M | $107M | $99M | $96M | |
| Deferred Tax | $-18M | $-27M | $-97M | $-30M | $87M | $-31M | $58M | $16M | $401M | $174M | $397M | $93M | |
| Amort. of Intangibles | $42M | $53M | $62M | $56M | $10M | $15M | $19M | $25M | $31M | $43M | $26M | $34M | |
| Other Non-cash | $-153M | $733M | · | · | · | · | · | · | · | · | · | · | |
| Operating Cash Flow | $3.00B | $3.61B | $3.90B | $4.57B | $2.71B | $789M | $2.36B | $2.09B | $2.78B | $1.18B | $1.74B | $1.10B | |
| CapEx | · | · | $256M | $214M | $149M | $172M | $178M | $98M | $79M | $108M | $82M | $73M | |
| Investing Cash Flow | $-6.82B | $-9.75B | $-4.76B | $16.59B | $-13.63B | $-22.02B | $727M | $-1.41B | $3.39B | $-721M | · | · | |
| Debt Issued | $3.53B | $5.50B | $5.04B | $999M | $10M | · | · | $1.77B | $2.15B | · | $1.50B | $4.35B | |
| Net Debt Issued | $-1.85B | $4.49B | $4.21B | $91M | $-844M | $-2.67B | $-1.55B | $314M | $-1.29B | $-1.12B | $-7.41B | $3.92B | |
| Stock Repurchased | $2.63B | $396M | $594M | $1.80B | · | $374M | $1.35B | $2.19B | $1.21B | $641M | · | · | |
| Net Stock Activity | $-2.63B | $-396M | $-594M | $-1.80B | · | $-374M | $-1.35B | $-2.19B | $-1.21B | $-641M | · | · | |
| Dividends Paid | $899M | $895M | $868M | $784M | $580M | $568M | $552M | $510M | $457M | $442M | $375M | $371M | |
| Financing Cash Flow | $1.80B | $-2.88B | $4.18B | $-20.98B | $10.70B | $21.35B | $-3.25B | $-495M | $-6.08B | $-510M | · | · | |
| Net Change in Cash | · | · | · | · | · | · | · | · | $100M | $-47M | $-5M | $-300M | |
| Taxes Paid | $529M | $236M | $452M | $488M | $314M | $276M | $321M | $375M | $494M | $277M | $379M | $412M | |
| Free Cash Flow | · | · | $3.65B | $4.36B | $2.57B | $617M | $2.18B | $1.99B | $2.70B | $1.08B | $1.66B | $1.03B | |
| Levered FCF | · | · | $1.29B | $4.04B | $2.48B | $368M | $1.61B | $1.59B | $2.47B | $803M | $1.45B | $838M |
Kârlılık
| Metrik | Eğilim | 2025 | 2024 | 2023 | 2022 | 2021 | 2020 | 2019 | 2018 | 2017 | 2016 | 2015 | 2014 |
|---|---|---|---|---|---|---|---|---|---|---|---|---|---|
| Net Margin | 172.1% | 167.9% | 28.4% | 24.3% | 31.0% | 22.7% | 31.2% | 32.4% | 25.0% | 24.8% | 23.1% | 23.9% | |
| Pretax Margin | 222.8% | 214.8% | 37.5% | 31.9% | 41.0% | 29.7% | 41.1% | 42.3% | 41.3% | 38.9% | 35.9% | 35.7% | |
| EBITDA Margin | 19.5% | 20.5% | · | · | · | · | · | · | · | · | · | · | |
| ROA | 1.4% | 1.2% | 1.3% | 1.1% | 1.2% | 1.0% | 1.6% | 1.6% | 1.2% | 1.1% | 0.98% | 1.2% | |
| ROE | 9.9% | 8.9% | 10.3% | 7.9% | 10.5% | 8.4% | 12.2% | 12.4% | 8.6% | 8.0% | 7.4% | 8.6% |
Likidite ve Solventlik
| Metrik | Eğilim | 2025 | 2024 | 2023 | 2022 | 2021 | 2020 | 2019 | 2018 | 2017 | 2016 | 2015 | 2014 |
|---|---|---|---|---|---|---|---|---|---|---|---|---|---|
| Debt / Equity | 0.1 | 0.0 | 0.2 | 0.1 | 0.0 | 0.0 | 0.0 | 0.3 | 0.0 | 0.0 | 0.1 | 0.0 |
Verimlilik
| Metrik | Eğilim | 2025 | 2024 | 2023 | 2022 | 2021 | 2020 | 2019 | 2018 | 2017 | 2016 | 2015 | 2014 |
|---|---|---|---|---|---|---|---|---|---|---|---|---|---|
| Asset Turnover | 0.0 | 0.0 | 0.0 | 0.0 | 0.0 | 0.0 | 0.1 | 0.0 | 0.0 | 0.0 | 0.0 | 0.0 |
Hisse Başına
| Metrik | Eğilim | 2025 | 2024 | 2023 | 2022 | 2021 | 2020 | 2019 | 2018 | 2017 | 2016 | 2015 | 2014 |
|---|---|---|---|---|---|---|---|---|---|---|---|---|---|
| Revenue / Share | $10.44 | $9.21 | $57.74 | $49.86 | $46.52 | $46.27 | $46.05 | $41.13 | $36.92 | $33.67 | $33.94 | $33.80 | |
| Cash Flow / Share | $18.91 | $21.58 | $23.38 | $27.88 | $21.08 | $6.13 | $17.53 | $14.50 | $18.24 | $7.52 | $12.67 | $8.34 | |
| Dividend / Share | $5.70 | $5.35 | $5.20 | $4.80 | · | · | · | · | · | · | · | · | |
| Dividend Paid / Share | · | · | · | · | · | · | · | · | · | · | $2.80 | $2.80 | |
| EPS (TTM) | $17.00 | $14.64 | $15.79 | $11.53 | $13.80 | $9.94 | $13.75 | $12.74 | $8.70 | $7.78 | $7.18 | $7.42 |
Büyüme Oranları
| Metrik | Eğilim | 2025 | 2024 | 2023 | 2022 | 2021 | 2020 | 2019 | 2018 | 2017 | 2016 | 2015 | 2014 |
|---|---|---|---|---|---|---|---|---|---|---|---|---|---|
| Revenue YoY | 7.5% | 3.8% | -2.7% | -74.6% | 0.63% | · | · | · | · | · | · | · | |
| Revenue CAGR 3Y | 2.8% | -36.4% | -37.1% | · | · | · | · | · | · | · | · | · | |
| Revenue CAGR 5Y | -22.6% | · | · | · | · | · | · | · | · | · | · | · | |
| EPS YoY | 16.1% | -7.3% | 37.0% | -16.4% | 38.8% | · | · | · | · | · | · | · | |
| EPS CAGR 3Y | 13.8% | 2.0% | 16.7% | · | · | · | · | · | · | · | · | · | |
| EPS CAGR 5Y | 11.3% | · | · | · | · | · | · | · | · | · | · | · | |
| Net Income YoY | 10.2% | -5.6% | 37.6% | 7.1% | 37.4% | · | · | · | · | · | · | · | |
| Net Income CAGR 3Y | 12.7% | 11.7% | 26.5% | · | · | · | · | · | · | · | · | · | |
| Net Income CAGR 5Y | 16.1% | · | · | · | · | · | · | · | · | · | · | · | |
| Dividends Paid CAGR 5Y | 9.6% | · | · | · | · | · | · | · | · | · | · | · |
Değerleme (TTM)
| Metrik | Eğilim | 2025 | 2024 | 2023 | 2022 | 2021 | 2020 | 2019 | 2018 | 2017 | 2016 | 2015 | 2014 |
|---|---|---|---|---|---|---|---|---|---|---|---|---|---|
| Revenue TTM | $1.66B | $1.54B | $1.48B | $1.52B | $5.99B | $5.95B | $6.19B | $5.93B | $5.63B | $5.30B | $4.67B | $4.46B | |
| Net Income TTM | $2.85B | $2.59B | $2.74B | $1.99B | $1.86B | $1.35B | $1.93B | $1.92B | $1.41B | $1.32B | $1.08B | $1.07B | |
| P/E | 11.9 | 12.8 | 8.7 | 12.6 | 11.1 | 12.8 | 12.3 | 11.2 | 19.7 | 20.1 | 16.9 | 16.9 | |
| Earnings Yield | 8.4% | 7.8% | 11.5% | 8.0% | 9.0% | 7.8% | 8.1% | 8.9% | 5.1% | 5.0% | 5.9% | 5.9% | |
| Payout Ratio | 31.5% | 34.6% | 31.7% | 39.4% | 31.2% | 42.0% | 28.6% | 26.6% | 32.5% | 33.6% | 34.7% | 34.8% | |
| Annual Payout | $899M | $895M | $868M | $784M | $580M | $568M | $552M | $510M | $457M | $442M | $375M | $371M |
Gelir Tablosu
| Metrik | Eğilim | Q2 2026 | Q1 2026 | Q4 2025 | Q3 2025 | Q2 2025 | Q1 2025 | Q4 2024 | Q3 2024 | Q2 2024 | Q1 2024 | Q4 2023 | Q3 2023 | Q2 2023 | Q1 2023 | Q4 2022 | Q3 2022 |
|---|---|---|---|---|---|---|---|---|---|---|---|---|---|---|---|---|---|
| Revenue | $442M | $418M | $420M | $423M | $417M | $397M | $392M | $394M | $388M | $367M | $365M | $360M | $376M | · | · | · | |
| Interest Expense | · | · | · | · | · | · | · | · | $1.07B | $1.06B | · | $866M | $717M | $509M | · | $103M | |
| Interest Income | $2.62B | $2.54B | $2.64B | $2.68B | $2.61B | $2.56B | $2.71B | $2.79B | $2.79B | $2.75B | $2.74B | $2.64B | $2.52B | $2.33B | $2.07B | $1.78B | |
| Pretax Income | $1.06B | $863M | $971M | $1.02B | $935M | $761M | $882M | $909M | $855M | $664M | $627M | $907M | $1.16B | $926M | $1.01B | $848M | |
| Income Tax | $245M | $199M | $212M | $233M | $219M | $177M | $201M | $188M | $200M | $133M | $145M | $217M | $292M | $224M | $246M | $201M | |
| Net Income | $818M | $664M | $759M | $792M | $716M | $584M | $681M | $721M | $655M | $531M | $482M | $690M | $867M | $702M | $766M | $647M | |
| EPS (Basic) | $5.35 | $4.16 | $4.66 | $4.85 | $4.26 | $3.33 | $3.88 | $4.04 | $3.75 | $3.04 | $2.75 | $4.00 | $5.07 | $4.03 | $4.33 | $3.55 | |
| EPS (Diluted) | $5.32 | $4.13 | $4.62 | $4.82 | $4.24 | $3.32 | $3.87 | $4.02 | $3.73 | $3.02 | $2.75 | $3.98 | $5.05 | $4.01 | $4.30 | $3.53 | |
| Shares (Basic) | 145,891,000 | 149,225,000 | · | 155,558,000 | 159,221,000 | 164,209,000 | · | 166,671,000 | 166,951,000 | 166,460,000 | · | 165,909,000 | 165,842,000 | 167,732,000 | · | 174,609,000 | |
| Shares (Diluted) | 146,758,000 | 150,109,000 | · | 156,553,000 | 160,005,000 | 165,047,000 | · | 167,567,000 | 167,659,000 | 167,084,000 | · | 166,570,000 | 166,320,000 | 168,410,000 | · | 175,682,000 | |
| EBITDA | · | $79M | · | · | · | $83M | · | · | · | · | · | · | · | · | · | · |
Bilanço
| Metrik | Eğilim | Q2 2026 | Q1 2026 | Q4 2025 | Q3 2025 | Q2 2025 | Q1 2025 | Q4 2024 | Q3 2024 | Q2 2024 | Q1 2024 | Q4 2023 | Q3 2023 | Q2 2023 | Q1 2023 | Q4 2022 | Q3 2022 |
|---|---|---|---|---|---|---|---|---|---|---|---|---|---|---|---|---|---|
| PP&E (Net) | $1.73B | $1.72B | $1.63B | $1.62B | $1.65B | $1.66B | $1.71B | $1.69B | $1.72B | $1.71B | · | $1.68B | $1.67B | $1.66B | · | $1.62B | |
| PP&E (Gross) | · | · | $2.44B | · | · | · | $2.46B | · | · | · | · | · | · | · | · | · | |
| Accum. Depreciation | · | · | $1.36B | · | · | · | $1.33B | · | · | · | · | · | · | · | · | · | |
| Goodwill | $8.46B | $8.46B | $8.46B | $8.46B | $8.46B | $8.46B | $8.46B | $8.46B | $8.46B | $8.46B | · | $8.47B | $8.47B | $8.49B | · | $8.50B | |
| Intangibles | $48M | $55M | $64M | $74M | $84M | $93M | $94M | $107M | $119M | $132M | · | $162M | $177M | $192M | · | $227M | |
| Total Assets | $219.26B | $214.74B | $213.51B | $211.28B | $211.58B | $210.32B | $208.10B | $211.78B | $208.85B | $215.14B | · | $209.12B | $207.67B | $202.96B | · | $197.96B | |
| Short-term Debt | $4.61B | $7.85B | $2.15B | $2.06B | $2.07B | $1.57B | $1.06B | $2.60B | $4.76B | $4.79B | · | $6.73B | $7.91B | $7.00B | · | $918M | |
| Total Liabilities | $191.31B | $186.76B | $184.33B | $182.55B | $183.06B | $181.33B | $179.08B | $182.91B | $180.43B | $187.97B | · | $182.93B | $181.87B | $177.58B | · | $172.70B | |
| Long-term Debt | $13.57B | $11.18B | $10.91B | $12.93B | $12.38B | $10.50B | $12.61B | $11.58B | $11.32B | $11.45B | · | $7.12B | $7.42B | $7.46B | · | $3.46B | |
| Total Debt | $4.61B | $7.85B | · | $2.06B | $2.07B | $1.57B | · | $2.60B | $4.76B | $4.79B | · | $6.73B | $7.91B | $7.00B | · | $918M | |
| Common Stock | $90M | $90M | $90M | $90M | $90M | $90M | $90M | $90M | $90M | $90M | · | $90M | $90M | $90M | · | $90M | |
| Paid-in Capital | $9.97B | $9.96B | $10.01B | $9.99B | $9.98B | $9.97B | $10.00B | $9.99B | $9.98B | $9.98B | · | $10.01B | $10.00B | $9.99B | · | $9.99B | |
| Retained Earnings | $22.04B | $21.48B | $20.88B | $20.39B | $19.87B | $19.41B | $19.08B | $18.66B | $18.21B | $17.81B | · | $17.28B | $16.84B | $16.21B | · | $15.22B | |
| Treasury Stock | $6.49B | $6.05B | $4.92B | $4.42B | $4.03B | $2.96B | $2.37B | $2.23B | $2.05B | $2.13B | · | $2.26B | $2.27B | $2.28B | · | $1.16B | |
| AOCI | $-92M | $66M | $277M | $277M | $215M | $90M | $-164M | $-27M | $-551M | $-589M | · | $-942M | $-865M | $-645M | · | $-900M | |
| Stockholders' Equity | $27.95B | $27.97B | $29.18B | $28.73B | $28.52B | $28.99B | $29.03B | $28.88B | $28.42B | $27.17B | $26.96B | $26.20B | $25.80B | $25.38B | $25.32B | $25.26B | |
| Liabilities + Equity | $219.26B | $214.74B | $213.51B | $211.28B | $211.58B | $210.32B | $208.10B | $211.78B | $208.85B | $215.14B | · | $209.12B | $207.67B | $202.96B | · | $197.96B |
Nakit Akışı
| Metrik | Eğilim | Q2 2026 | Q1 2026 | Q4 2025 | Q3 2025 | Q2 2025 | Q1 2025 | Q4 2024 | Q3 2024 | Q2 2024 | Q1 2024 | Q4 2023 | Q3 2023 | Q2 2023 | Q1 2023 | Q4 2022 | Q3 2022 |
|---|---|---|---|---|---|---|---|---|---|---|---|---|---|---|---|---|---|
| D&A | $77M | $79M | $80M | $79M | $81M | $83M | $81M | $76M | $79M | $80M | $77M | $78M | · | · | · | · | |
| Deferred Tax | $16M | $14M | $20M | $-16M | $-16M | $-6M | $-14M | $1M | $-16M | $2M | $-57M | $-33M | $-18M | $11M | $59M | $-12M | |
| Amort. of Intangibles | $7M | $9M | $10M | $10M | $9M | $13M | $13M | $12M | $13M | $15M | $15M | $15M | $15M | $17M | $18M | $18M | |
| Other Non-cash | · | $255M | · | · | · | $-26M | · | · | · | · | · | · | · | · | · | · | |
| Operating Cash Flow | $1.27B | $1.01B | $523M | $1.00B | $844M | $635M | $1.68B | $-28M | $1.35B | $608M | $800M | $1.42B | $1.26B | $428M | $954M | $1.14B | |
| Investing Cash Flow | $-3.83B | $-4.32B | $-3.83B | $1M | $-853M | $-349M | $-6.90B | $-1.39B | $5.62B | $-7.08B | $3.79B | $-1.91B | $-4.90B | $-1.75B | $-3.67B | $6.22B | |
| Debt Issued | $2.69B | $508M | $0 | $747M | $2.04B | $743M | $1.49B | $646M | $0 | $3.36B | $1.00B | $546M | $325.0K | $3.49B | $500M | · | |
| Net Debt Issued | · | $296M | · | · | · | $-2.21B | · | · | · | $3.31B | · | · | · | $3.49B | · | · | |
| Stock Repurchased | $460M | $1.24B | $502M | $404M | $1.07B | $656M | $198M | $198M | $0 | $0 | $0 | $0 | $0 | $594M | $600M | $600M | |
| Net Stock Activity | · | $-1.24B | · | · | · | $-656M | · | · | · | · | · | · | · | $-594M | · | · | |
| Dividends Paid | $218M | $227M | $228M | $233M | $213M | $225M | $224M | $225M | $225M | $221M | $216M | $216M | $215M | $221M | $205M | $209M | |
| Financing Cash Flow | $3.65B | $891M | $1.25B | $-1.18B | $28M | $1.70B | $-4.28B | $1.85B | $-6.90B | $6.44B | $-1.52B | $408M | $3.68B | $1.62B | $1.98B | $-6.79B | |
| Taxes Paid | $222M | $34M | $215M | $164M | $80M | $70M | $-4M | $134M | $65M | $41M | $21M | $102M | $307M | $22M | $125M | $131M |
Kârlılık
| Metrik | Eğilim | Q2 2026 | Q1 2026 | Q4 2025 | Q3 2025 | Q2 2025 | Q1 2025 | Q4 2024 | Q3 2024 | Q2 2024 | Q1 2024 | Q4 2023 | Q3 2023 | Q2 2023 | Q1 2023 | Q4 2022 | Q3 2022 |
|---|---|---|---|---|---|---|---|---|---|---|---|---|---|---|---|---|---|
| Net Margin | 185.1% | 158.8% | · | 187.2% | 171.7% | 147.1% | · | 183.0% | 168.8% | 23.5% | · | 29.5% | 33.3% | 29.2% | · | 28.8% | |
| Pretax Margin | 240.5% | 206.5% | · | 242.3% | 224.2% | 191.7% | · | 230.7% | 220.4% | 29.4% | · | 38.9% | 44.6% | 38.5% | · | 37.8% | |
| EBITDA Margin | · | 18.9% | · | · | · | 20.9% | · | · | · | · | · | · | · | · | · | · | |
| ROA | 0.38% | 0.31% | · | 0.37% | 0.34% | 0.27% | · | 0.34% | 0.31% | 0.25% | · | 0.34% | 0.42% | 0.40% | · | 0.37% | |
| ROE | 2.9% | 2.3% | · | 2.8% | 2.5% | 2.1% | · | 2.6% | 2.4% | 2.0% | · | 2.7% | 3.4% | 3.2% | · | 3.0% |
Likidite ve Solventlik
| Metrik | Eğilim | Q2 2026 | Q1 2026 | Q4 2025 | Q3 2025 | Q2 2025 | Q1 2025 | Q4 2024 | Q3 2024 | Q2 2024 | Q1 2024 | Q4 2023 | Q3 2023 | Q2 2023 | Q1 2023 | Q4 2022 | Q3 2022 |
|---|---|---|---|---|---|---|---|---|---|---|---|---|---|---|---|---|---|
| Debt / Equity | 0.2 | 0.3 | · | 0.1 | 0.1 | 0.1 | · | 0.1 | 0.2 | 0.2 | · | 0.3 | 0.3 | 0.3 | · | 0.0 |
Verimlilik
| Metrik | Eğilim | Q2 2026 | Q1 2026 | Q4 2025 | Q3 2025 | Q2 2025 | Q1 2025 | Q4 2024 | Q3 2024 | Q2 2024 | Q1 2024 | Q4 2023 | Q3 2023 | Q2 2023 | Q1 2023 | Q4 2022 | Q3 2022 |
|---|---|---|---|---|---|---|---|---|---|---|---|---|---|---|---|---|---|
| Asset Turnover | 0.0 | 0.0 | · | 0.0 | 0.0 | 0.0 | · | 0.0 | 0.0 | 0.0 | · | 0.0 | 0.0 | 0.0 | · | 0.0 |
Hisse Başına
| Metrik | Eğilim | Q2 2026 | Q1 2026 | Q4 2025 | Q3 2025 | Q2 2025 | Q1 2025 | Q4 2024 | Q3 2024 | Q2 2024 | Q1 2024 | Q4 2023 | Q3 2023 | Q2 2023 | Q1 2023 | Q4 2022 | Q3 2022 |
|---|---|---|---|---|---|---|---|---|---|---|---|---|---|---|---|---|---|
| Revenue / Share | $3.01 | $2.78 | · | $2.70 | $2.61 | $2.41 | · | $2.35 | $2.31 | $13.53 | · | $14.02 | $15.65 | $14.28 | · | $12.76 | |
| Cash Flow / Share | · | $6.74 | · | · | · | $3.85 | · | · | · | $3.64 | · | · | · | $2.54 | · | · | |
| Dividend / Share | $1.50 | $1.50 | $1.50 | $1.50 | $1.35 | $1.35 | $1.35 | $1.35 | $1.35 | $1.30 | $1.30 | $1.30 | · | · | · | · | |
| EPS (TTM) | $18.89 | $17.81 | · | $16.25 | $15.45 | $14.94 | · | $13.52 | $13.48 | $14.80 | · | $17.34 | $16.89 | $12.92 | · | $10.60 |
Değerleme (TTM)
| Metrik | Eğilim | Q2 2026 | Q1 2026 | Q4 2025 | Q3 2025 | Q2 2025 | Q1 2025 | Q4 2024 | Q3 2024 | Q2 2024 | Q1 2024 | Q4 2023 | Q3 2023 | Q2 2023 | Q1 2023 | Q4 2022 | Q3 2022 |
|---|---|---|---|---|---|---|---|---|---|---|---|---|---|---|---|---|---|
| Revenue TTM | $1.70B | $1.68B | · | $1.63B | $1.60B | $1.57B | · | $1.51B | $1.48B | $1.47B | · | · | · | · | · | · | |
| Net Income TTM | $3.03B | $2.93B | · | $2.77B | $2.70B | $2.64B | · | $2.39B | $2.36B | $2.57B | · | $3.02B | $2.98B | $2.33B | · | $1.68B | |
| P/E | 12.6 | 11.6 | · | 12.2 | 12.6 | 12.0 | · | 13.2 | 11.2 | 9.8 | · | 7.3 | 7.3 | 9.3 | · | 16.6 | |
| Earnings Yield | 7.9% | 8.6% | · | 8.2% | 8.0% | 8.4% | · | 7.6% | 8.9% | 10.2% | · | 13.7% | 13.7% | 10.8% | · | 6.0% | |
| Payout Ratio | · | 34.2% | · | · | · | 38.5% | · | · | · | 41.6% | · | · | · | 31.4% | · | · | |
| Annual Payout | $906M | $901M | · | $895M | $887M | $899M | · | $887M | $878M | $868M | · | $857M | $851M | $848M | · | $733M |
En son dönem solda · null değerler · olarak gösterilir
Finansal Tablolar Gelir tablosu, bilanço, nakit akışı — yıllık, son 5 yıl
| Metrik | 2025-12-31 | 2024-12-31 | 2023-12-31 | 2022-12-31 | 2021-12-31 |
|---|---|---|---|---|---|
| Gelir | $1.66B | $1.54B | $1.48B | $1.52B | $5.99B |
| Net Gelir | $2.85B | $2.59B | $2.74B | $1.99B | $1.86B |
| Seyreltilmiş Hisse Başı Kâr | $17.00 | $14.64 | $15.79 | $11.53 | $13.80 |
| Metrik | 2025-12-31 | 2024-12-31 | 2023-12-31 | 2022-12-31 | 2021-12-31 |
|---|---|---|---|---|---|
| Borç / Öz Sermaye | 0.1 | 0.0 | 0.2 | 0.1 | 0.0 |
| Metrik | 2025-12-31 | 2024-12-31 | 2023-12-31 | 2022-12-31 | 2021-12-31 |
|---|---|---|---|---|---|
| Serbest Nakit Akışı | · | · | $3.65B | $4.36B | $2.57B |
Kurumsal Sahipler (13F) 1.228 dosya · $35.0B toplam · Tarih itibarıyla 30 Eylül 2026
Çeyreklik SEC Form 13F'lerinde bu hisse senedini tuttuklarını bildiren kurumlar. Yalnızca uzun pozisyonlar; tek bir başvuru sahibi, ayrı opsiyon bacakları için iki kez görünebilir. Büyük dengeleyici alım/satım bacakları genellikle piyasa yapımını veya korunmuş envanteri yansıtır, yönlü bir inancı değil.
| Yeni pozisyonlar | Çıkan pozisyonlar | Artırıldı | Azaldı | Net hisse senedi değişimi |
|---|---|---|---|---|
| 126 (-2 önceki Ç'ye göre) | 69 (-15 önceki Ç'ye göre) | 391 (+2 önceki Ç'ye göre) | 407 (+29 önceki Ç'ye göre) | +2.0M |
Q1 2026 ile karşılaştırıldı. SEC Form 13F başvuruları, çeyrek sonundan itibaren 45 gün içinde ve geç başvuranlar için kısa bir ek süre içinde tamamlanmalıdır — bu pencere içindeki çeyrekler, en son tam olarak raporlanan çifte tercih edilerek atlanır.
| Kurum | Değer | Hisse senetleri | % izlenen 13F'nin | Tür |
|---|---|---|---|---|
| VANGUARD GROUP INC | $3.892.311.327 | 19.318.599 | 11,13% | Hisse senetleri |
| BlackRock, Inc. | $3.057.477.122 | 12.846.003 | 8,74% | Hisse senetleri |
| FMR LLC | $2.955.432.349 | 12.417.262 | 8,45% | Hisse senetleri |
| WELLINGTON MANAGEMENT GROUP LLP | $2.332.945.697 | 9.801.881 | 6,67% | Hisse senetleri |
| VANGUARD CAPITAL MANAGEMENT LLC | $2.276.983.119 | 9.566.754 | 6,51% | Hisse senetleri |
| STATE STREET CORP | $1.692.880.398 | 7.112.644 | 4,84% | Hisse senetleri |
| VANGUARD PORTFOLIO MANAGEMENT LLC | $1.685.238.611 | 7.080.537 | 4,82% | Hisse senetleri |
| GEODE CAPITAL MANAGEMENT, LLC | $1.031.132.591 | 4.348.008 | 2,95% | Hisse senetleri |
| STATE FARM MUTUAL AUTOMOBILE INSURANCE CO | $981.217.646 | 4.122.590 | 2,81% | Hisse senetleri |
| JPMORGAN CHASE & CO | $967.801.286 | 4.045.990 | 2,77% | Hisse senetleri |
| Invesco Ltd. | $957.998.942 | 4.025.037 | 2,74% | Hisse senetleri |
| MORGAN STANLEY | $854.476.829 | 3.590.085 | 2,44% | Hisse senetleri |
| NORGES BANK | $472.484.361 | 1.985.145 | 1,35% | Hisse senetleri |
| DIMENSIONAL FUND ADVISORS LP | $378.358.333 | 1.589.579 | 1,08% | Hisse senetleri |
| NORTHERN TRUST CORP | $355.089.500 | 1.491.910 | 1,02% | Hisse senetleri |
| Bank of New York Mellon Corp | $330.977.679 | 1.390.604 | 0,95% | Hisse senetleri |
| GOLDMAN SACHS GROUP INC | $325.336.994 | 1.366.905 | 0,93% | Hisse senetleri |
| BANK OF AMERICA CORP /DE/ | $315.268.029 | 1.324.600 | 0,90% | Hisse senetleri |
| MASSACHUSETTS FINANCIAL SERVICES CO /MA/ | $284.130.879 | 1.191.392 | 0,81% | Hisse senetleri |
| Nuveen, LLC | $273.111.498 | 1.147.480 | 0,78% | Hisse senetleri |
| M&T Bank Corp | $273.051.867 | 1.147.230 | 0,78% | Hisse senetleri |
| Legal & General Group Plc | $254.657.128 | 1.069.943 | 0,73% | Hisse senetleri |
| CHARLES SCHWAB INVESTMENT MANAGEMENT INC | $238.331.790 | 1.001.352 | 0,68% | Hisse senetleri |
| JENNISON ASSOCIATES LLC | $231.986.442 | 974.692 | 0,66% | Hisse senetleri |
| MENORA MIVTACHIM HOLDINGS LTD. | $229.112.948 | 962.619 | 0,65% | Hisse senetleri |
| UBS AM, a distinct business unit of UBS ASSET MANAGEMENT AMERICAS LLC | $213.754.888 | 1.034.031 | 0,61% | Hisse senetleri |
| UBS Group AG | $206.759.287 | 868.700 | 0,59% | Hisse senetleri |
| LONDON CO OF VIRGINIA | $201.215.898 | 845.405 | 0,58% | Hisse senetleri |
| VANGUARD FIDUCIARY TRUST CO | $195.664.213 | 822.084 | 0,56% | Hisse senetleri |
| WELLS FARGO & COMPANY/MN | $166.202.355 | 698.300 | 0,48% | Hisse senetleri |
| NEUBERGER BERMAN GROUP LLC | $156.154.526 | 656.084 | 0,45% | Hisse senetleri |
| FRANKLIN RESOURCES INC | $135.911.300 | 571.032 | 0,39% | Hisse senetleri |
| PANAGORA ASSET MANAGEMENT INC | $132.828.383 | 558.079 | 0,38% | Hisse senetleri |
| FIRST TRUST ADVISORS LP | $132.340.037 | 556.027 | 0,38% | Hisse senetleri |
| DEUTSCHE BANK AG\ | $123.657.382 | 519.547 | 0,35% | Hisse senetleri |
| Brandywine Global Investment Management, LLC | $117.742.091 | 584.386 | 0,34% | Hisse senetleri |
| Boston Partners | $112.912.217 | 474.401 | 0,32% | Hisse senetleri |
| Canoe Financial LP | $108.597.623 | 499.644 | 0,31% | Hisse senetleri |
| Korea Investment CORP | $107.696.669 | 452.488 | 0,31% | Hisse senetleri |
| ALLIANCEBERNSTEIN L.P. | $97.994.996 | 474.047 | 0,28% | Hisse senetleri |
| Davis Asset Management, L.P. | $97.584.100 | 410.000 | 0,28% | Hisse senetleri |
| HSBC HOLDINGS PLC | $94.364.113 | 396.157 | 0,27% | Hisse senetleri |
| Sumitomo Mitsui Trust Group, Inc. | $93.620.995 | 393.349 | 0,27% | Hisse senetleri |
| Russell Investments Group, Ltd. | $92.581.982 | 388.827 | 0,26% | Hisse senetleri |
| Amundi | $92.565.896 | 388.916 | 0,26% | Hisse senetleri |
| STIFEL FINANCIAL CORP | $86.524.514 | 363.534 | 0,25% | Hisse senetleri |
| Mitsubishi UFJ Asset Management Co., Ltd. | $85.454.396 | 359.037 | 0,24% | Hisse senetleri |
| California Public Employees Retirement System | $85.323.015 | 358.485 | 0,24% | Hisse senetleri |
| HUNTINGTON NATIONAL BANK | $85.311.259 | 358.437 | 0,24% | Hisse senetleri |
| BNP PARIBAS FINANCIAL MARKETS | $82.513.069 | 346.679 | 0,24% | Hisse senetleri |
Aktivistler ve %5+ sahipler 5 pozisyon
SEC Çizelge 13D dosyalayan yatırımcılar — ihraççı üzerinde nüfuz etme niyetiyle %5'in üzerinde faydalı sahiplik (aktivist hisseler, yönetim kurulu kampanyaları, M&A). Her satır, o başvuru sahibinin pozisyonunun bilinen en son durumunu gösterir.
| Başvuru sahibi | Dosyalandı | Hisse | Durum | Amaç | Başvuru |
|---|---|---|---|---|---|
| The Estate of Robert G. Wilmers, Roche Foundation, Inc., Wilmers Company, L.L.C., Camden LLC, Voltaire Holdings LLC, Elisabeth Roche Wilmers, R.I. REM Investments S.A., Interlaken Foundation, Inc. | 13 Şubat 2018 | · | İlk başvuru | · | SEC |
| Robert G. Wilmers, Roche Foundation, Inc., Wilmers Company, L.L.C., Robert G. Wilmers 1999 Family Trust, Robert G. Wilmers 2000 Family Trust, Elisabeth Roche Wilmers, R.I. REM Investments S.A., Mallarme Investments Limited, Interlaken Foundation, Inc. ×4 başvurular | 21 Temmuz 2016 | · | İlk başvuru | · | SEC |
| ALLIED IRISH BANKS, P.L.C. (IRS IDENTIFICATION NO ×3 başvurular | 05 Kasım 2010 | · | İlk başvuru | · | SEC |
| Açıklanmayan raporlama kişisi | 11 Nisan 2003 | · | İlk başvuru | Pasif yatırım | SEC |
| Açıklanmayan raporlama kişisi, Açıklanmayan raporlama kişisi, Açıklanmayan raporlama kişisi, Açıklanmayan raporlama kişisi, Açıklanmayan raporlama kişisi, Açıklanmayan raporlama kişisi, Açıklanmayan raporlama kişisi, Açıklanmayan raporlama kişisi, Açıklanmayan raporlama kişisi, Açıklanmayan raporlama kişisi, Açıklanmayan raporlama kişisi, Açıklanmayan raporlama kişisi, Açıklanmayan raporlama kişisi, Açıklanmayan raporlama kişisi | 08 Şubat 2002 | · | İlk başvuru | · | SEC |
Purpose is an automated classification of the filer's own stated purpose (SEC Item 4) — not investment advice. "—" means no clear purpose was stated or the text could not be classified.
Şirket yöneticileri 86 içeriden öğrenenler · 41 yöneticiler · 41 yönetim kurulu üyeleri
| İçeriden Öğrenen | Rol | Son işlem | Sahip olunan hisse senetleri | Alımlar 12ay | Satışlar 12ay | Net 12ay |
|---|---|---|---|---|---|---|
| Rene F Jones | Chairman of the Board and CEO | 14 Eylül 2026 M | 103.831 | 0 | 1 | $-4.642.433 |
| WILMERS ROBERT G | Chairman of the Board and CEO | 04 Mayıs 2017 D | 2.214.016 | 0 | 0 | $0 |
| Daryl N. Bible | Sr. EVP & CFO | 31 Temmuz 2026 F | 26.967 | 0 | 0 | $0 |
| Richard S Gold | President & COO | 10 Şubat 2023 F | 59.123 | 0 | 0 | $0 |
| Mark J Czarnecki | President | 31 Ocak 2017 F | 61.861 | 0 | 0 | $0 |
| Kevin J Pearson | Vice Chairman | 16 Ekim 2026 S | 42.107 | 0 | 5 | $-6.632.675 |
| John R. Taylor | EVP and Controller | 17 Ağustos 2026 S | 3.062 | 0 | 3 | $-723.649 |
| Woodrow S. Tracy | Sr. Executive Vice President | 01 Temmuz 2026 M | 9.608 | 0 | 2 | $-459.825 |
| Christopher E Kay | Sr. Executive Vice President | 07 Mayıs 2026 S | 6.753 | 0 | 2 | $-1.678.657 |
| Michael A. Wisler | Sr. Executive Vice President | 26 Şubat 2026 M | 4.643 | 0 | 1 | $-1.840.805 |
| Peter D'Arcy | Sr. Executive Vice President | 13 Şubat 2026 F | 12.737 | 0 | 0 | $0 |
| Laura P. O'Hara | Sr. EVP & Chief Legal Officer | 13 Şubat 2026 F | 9.559 | 0 | 0 | $0 |
| Julianne Urban | Sr. EVP & Chief Auditor | 13 Şubat 2026 F | 8.458 | 0 | 0 | $0 |
| Neeraj Singh | Sr. Executive Vice President | 30 Ocak 2026 A | 2.632 | 0 | 0 | $0 |
| Michael J. Todaro | Sr. Executive Vice President | 31 Ocak 2025 A | 4.375 | 0 | 0 | $0 |
| Robert J Bojdak | Sr. Executive Vice President | 30 Mayıs 2024 G | 19.061 | 0 | 0 | $0 |
| Doris P. Meister | Sr. Executive Vice President | 03 Mayıs 2024 S | 0 | 0 | 0 | $0 |
| Darren J King | Sr. Executive Vice President | 01 Nisan 2024 I | 58.332 | 0 | 0 | $0 |
| Edna Jennifer Warren | Sr. Executive Vice President | 31 Ocak 2024 A | 307 | 0 | 0 | $0 |
| Scott D N Warman | Sr. Executive Vice President | 10 Şubat 2023 F | 9.914 | 0 | 0 | $0 |
| Michele D Trolli | Sr. Executive Vice President | 10 Şubat 2023 F | 11.859 | 0 | 0 | $0 |
| Michael R Spychala | EVP & Controller | 10 Şubat 2023 F | 35.256 | 0 | 0 | $0 |
| Gino A. Martocci | Executive Vice President | 11 Şubat 2022 F | 19.338 | 0 | 0 | $0 |
| John L Dangelo | Executive Vice President | 11 Şubat 2022 F | 5.655 | 0 | 0 | $0 |
| William J Farrell II | Executive Vice President | 05 Şubat 2021 F | 13.349 | 0 | 0 | $0 |
| Janet M. Coletti | Executive Vice President | 05 Şubat 2020 A | 14.529 | 0 | 0 | $0 |
| Sabeth Siddique | Chief of Reg. Affairs | 17 Nisan 2019 S | 2.191 | 0 | 0 | $0 |
| Brian E Hickey | Executive Vice President | 17 Nisan 2019 S | 13.819 | 0 | 0 | $0 |
| Drew J Pfirrman | Sr. VP/General Counsel | 25 Ağustos 2016 S | 3.090 | 0 | 0 | $0 |
| Jorge G Pereira | Vice Chairman | 01 Nisan 2015 A | 5.300 | 0 | 0 | $0 |
| Stephen J Braunscheidel | Executive Vice President | 30 Ocak 2015 F | 16.309 | 0 | 0 | $0 |
| Donald K Truslow | Executive VP and CRO | 28 Şubat 2014 F | 943 | 0 | 0 | $0 |
| PINTO MICHAEL P | Vice Chairman | 21 Kasım 2013 M | 112.132 | 0 | 0 | $0 |
| Atwood Collins III | Executive Vice President | 28 Aralık 2012 F | 78.908 | 0 | 0 | $0 |
| James J Beardi | Executive Vice President | 25 Mart 2011 F | 22.949 | 0 | 0 | $0 |
| Mark W Yonkman | Sr. VP/General Counsel | 30 Ocak 2009 A | 5.269 | 0 | 0 | $0 |
| Adam C Kugler | Executive VP & Treasurer | 15 Mayıs 2008 M | 36.475 | 0 | 0 | $0 |
| Gregory L Ford | Executive Vice President | 31 Ocak 2007 A | · | 0 | 0 | $0 |
| Emerson L Brumback | Executive Vice President | 25 Kasım 2005 S | 19.780 | 0 | 0 | $0 |
| Steven M Coen | Ex. VP & Chief Info. Officer | 27 Ekim 2004 S | 109 | 0 | 0 | $0 |
| John L Pett | Executive Vice President | 28 Ocak 2004 M | 166.221 | 0 | 0 | $0 |
| Rudina Seseri | Yönetim kurulu üyesi | 21 Ağustos 2026 S | 3.649 | 0 | 1 | $-150.168 |
| Kirk W Walters | Yönetim kurulu üyesi | 05 Ağustos 2026 S | 0 | 0 | 2 | $-208.963 |
| Richard H. Ledgett Jr. | Yönetim kurulu üyesi | 03 Ağustos 2026 S | 4.690 | 0 | 1 | $-212.177 |
| Jeremy M Jacobs Jr | Yönetim kurulu üyesi | 31 Temmuz 2026 A | 589 | 0 | 0 | $0 |
| Carlton J. Charles | Yönetim kurulu üyesi | 30 Nisan 2026 A | 3.408 | 0 | 0 | $0 |
| William Frank Cruger Jr. | Yönetim kurulu üyesi | 30 Nisan 2026 A | 9.878 | 0 | 0 | $0 |
| Jane Chwick | Yönetim kurulu üyesi | 30 Nisan 2026 A | 6.994 | 0 | 0 | $0 |
| Herbert L Washington | Yönetim kurulu üyesi | 30 Nisan 2026 A | 18.299 | 0 | 0 | $0 |
| Leslie V Godridge | Yönetim kurulu üyesi | 30 Nisan 2026 A | 5.121 | 0 | 0 | $0 |
| Denis J Salamone | Yönetim kurulu üyesi | 30 Nisan 2026 A | 45.189 | 0 | 0 | $0 |
| Melinda R Rich | Yönetim kurulu üyesi | 30 Nisan 2026 A | 24.109 | 0 | 0 | $0 |
| Gary N Geisel | Yönetim kurulu üyesi | 30 Ocak 2026 A | 16.465 | 0 | 1 | $-191.406 |
| Jefferson T Cunningham III | Yönetim kurulu üyesi | 31 Ocak 2025 A | 14.433 | 0 | 0 | $0 |
| BRADY ROBERT T | Yönetim kurulu üyesi | 30 Nisan 2024 A | 14.480 | 0 | 0 | $0 |
| John Scannell | Yönetim kurulu üyesi | 28 Nisan 2023 A | 4.393 | 0 | 0 | $0 |
| Calvin Butler JR | Yönetim kurulu üyesi | 29 Nisan 2022 A | 1.962 | 0 | 0 | $0 |
| Richard A. Grossi | Yönetim kurulu üyesi | 31 Ocak 2022 A | 4.764 | 0 | 0 | $0 |
| David S Scharfstein | Yönetim kurulu üyesi | 30 Nisan 2021 A | 3.179 | 0 | 0 | $0 |
| Angela C Bontempo | Yönetim kurulu üyesi | 30 Nisan 2021 A | 15.363 | 0 | 0 | $0 |
| Newton P S Merrill | Yönetim kurulu üyesi | 30 Nisan 2021 A | 3.969 | 0 | 0 | $0 |
| John D. Hawke Jr. | Yönetim kurulu üyesi | 02 Nisan 2018 A | 5.998 | 0 | 0 | $0 |
| Edward G. Amoroso | Yönetim kurulu üyesi | 03 Nisan 2017 A | 324 | 0 | 0 | $0 |
| Patrick W E Hodgson | Yönetim kurulu üyesi | 03 Ekim 2016 A | 1.869 | 0 | 0 | $0 |
| Richard G King | Yönetim kurulu üyesi | 01 Temmuz 2016 A | 20.198 | 0 | 0 | $0 |
| Michael D Buckley | Yönetim kurulu üyesi | 02 Nisan 2012 A | 4.122 | 0 | 0 | $0 |
| Robert J Bennett | Yönetim kurulu üyesi | 02 Nisan 2012 A | 19.636 | 0 | 0 | $0 |
| Stephen G Sheetz | Yönetim kurulu üyesi | 01 Nisan 2009 A | 34.167 | 0 | 0 | $0 |
| Daniel R Hawbaker | Yönetim kurulu üyesi | 01 Nisan 2009 A | 5.862 | 0 | 0 | $0 |
| Richard E Garman | Yönetim kurulu üyesi | 01 Nisan 2009 A | 258.914 | 0 | 0 | $0 |
| Reginald B Newman II | Yönetim kurulu üyesi | 01 Nisan 2009 A | 11.298 | 0 | 0 | $0 |
| Carlos R Carballada | Yönetim kurulu üyesi | 03 Nisan 2006 A | 10.566 | 0 | 0 | $0 |
| Patrick Callan | Yönetim kurulu üyesi | 03 Nisan 2006 A | 62.592 | 0 | 0 | $0 |
| William F Allyn | Yönetim kurulu üyesi | 03 Nisan 2006 A | 13.350 | 0 | 0 | $0 |
| Derek C Hathaway | Yönetim kurulu üyesi | 03 Ocak 2006 A | 2.311 | 0 | 0 | $0 |
| Donald Devorris | Yönetim kurulu üyesi | 01 Nisan 2005 A | 32.117 | 0 | 0 | $0 |
| James V Glynn | Yönetim kurulu üyesi | 01 Nisan 2005 A | 13.261 | 0 | 0 | $0 |
| ALLIED IRISH BANKS PLC | 10% sahip | 04 Kasım 2010 S | 0 | 0 | 0 | $0 |
| John P Barnes | · | 30 Nisan 2026 A | 15.806 | 0 | 2 | $-8.943.360 |
| Robert E Sadler JR | · | 30 Ocak 2026 A | 27.614 | 0 | 1 | $-1.140.360 |
| BAIRD BRENT D | · | 01 Nisan 2020 A | 34.897 | 0 | 0 | $0 |
| Heath B Mclendon | · | 01 Nisan 2009 A | 31.174 | 0 | 0 | $0 |
| Arthur Levitt JR | · | 01 Nisan 2009 A | 255 | 0 | 0 | $0 |
| Eugene J Sheehy | · | 25 Nisan 2005 M | 1.153 | 0 | 0 | $0 |
| John H Zachau JR | · | 18 Ocak 2005 A | 28.606 | 0 | 0 | $0 |
| Michael S Piemonte | · | 18 Ocak 2005 A | · | 0 | 0 | $0 |
SEC Form 3/4/5 başvurularından yöneticiler; net = yalnızca açık piyasa Alış/Satış
ETF sahipliği 167 ETF'ler tarafından tutuluyor
Ağırlık yalnızca doğrudan öz sermaye varlıklarını (N-PORT) yansıtır; kaldıraçlı veya türev tabanlı fonlar gösterilmeyen ek swap pozisyonlarına sahip olabilir.
| Fon | Ağırlık | Birimler | Tarih itibarıyla | Kaynak |
|---|---|---|---|---|
| IAT · iShares Trust | 4,69% | 127.844 SH | 11 Eylül 2026 | Günlük |
| PGF · Invesco Exchange-Traded Fund Trust | 4,03% | 1.025.514 | 28 Ekim 2026 | Günlük |
| KBWB · Invesco Exchange-Traded Fund Trust … | 3,98% | 1.196.396 SH | 28 Ekim 2026 | Günlük |
| GEND · Spinnaker ETF Series | 3,92% | 773 NS | 31 Temmuz 2026 | N-PORT |
| DIVY · Tidal Trust I | 2,51% | 3.163 NS | 31 Ağustos 2026 | N-PORT |
| PGX · Invesco Exchange-Traded Fund Trust … | 1,74% | 2.699.394 | 28 Ekim 2026 | Günlük |
| DFNL · Davis Fundamental ETF Trust | 1,48% | 28.771 NS | 31 Temmuz 2026 | N-PORT |
| FBCV · FIDELITY COVINGTON TRUST | 1,37% | 9.862 NS | 31 Temmuz 2026 | N-PORT |
| MMID · MFS Active Exchange Traded Funds Tr… | 1,29% | 1.995 NS | 31 Ağustos 2026 | N-PORT |
| RSPF · Invesco Exchange-Traded Fund Trust | 1,25% | 18.054 SH | 28 Ekim 2026 | Günlük |
| SPVM · Invesco Exchange-Traded Fund Trust | 1,14% | 7.207 SH | 28 Ekim 2026 | Günlük |
| FFLV · FIDELITY COVINGTON TRUST | 1,04% | 692 NS | 31 Temmuz 2026 | N-PORT |
| SYLD · Cambria ETF Trust | 1,00% | 40.345 NS | 31 Temmuz 2026 | N-PORT |
| PFF · iShares Trust | 0,98% | 5.021.286 SH | 11 Eylül 2026 | Günlük |
| VMAX · Lattice Strategies Trust | 0,98% | 1.949 NS | 31 Temmuz 2026 | N-PORT |
| NUDV · Nushares ETF Trust | 0,94% | 1.916 NS | 31 Temmuz 2026 | N-PORT |
| FXO · First Trust Exchange-Traded AlphaDE… | 0,93% | 42.684 NS | 31 Temmuz 2026 | N-PORT |
| DPST · Direxion Shares ETF Trust | 0,93% | 16.136 NS | 31 Temmuz 2026 | N-PORT |
| PKW · Invesco Exchange-Traded Fund Trust | 0,89% | 69.262 SH | 28 Ekim 2026 | Günlük |
| INFO · Harbor ETF Trust | 0,82% | 28.034 NS | 31 Temmuz 2026 | N-PORT |
| SPLV · Invesco Exchange-Traded Fund Trust … | 0,80% | 266.958 SH | 28 Ekim 2026 | Günlük |
| SDVD · First Trust Exchange-Traded Fund IV | 0,72% | 26.705 NS | 31 Temmuz 2026 | N-PORT |
| RPV · Invesco Exchange-Traded Fund Trust | 0,63% | 49.206 SH | 28 Ekim 2026 | Günlük |
| ACVU · Hartford Funds Exchange-Traded Trust | 0,60% | 4.378 NS | 31 Temmuz 2026 | N-PORT |
| FFLC · FIDELITY COVINGTON TRUST | 0,59% | 28.558 NS | 31 Temmuz 2026 | N-PORT |
| LOWV · AB Active ETFs, Inc. | 0,55% | 4.815 NS | 31 Ağustos 2026 | N-PORT |
| IYF · iShares Trust | 0,53% | 97.834 SH | 11 Eylül 2026 | Günlük |
| JSTC · Tidal Trust I | 0,53% | 6.835 NS | 31 Ağustos 2026 | N-PORT |
| FTA · First Trust Exchange-Traded AlphaDE… | 0,52% | 29.509 NS | 31 Temmuz 2026 | N-PORT |
| VOE · VANGUARD INDEX FUNDS | 0,51% | 795.720 SH | 19 Ağustos 2026 | Günlük |
| IMCV · iShares Trust | 0,49% | 23.776 SH | 11 Eylül 2026 | Günlük |
| GSY · Invesco Actively Managed Exchange-T… | 0,49% | 19.250.000 | 28 Ekim 2026 | Günlük |
| IYG · iShares Trust | 0,48% | 44.426 SH | 11 Eylül 2026 | Günlük |
| HDV · iShares Trust | 0,42% | 268.098 SH | 11 Eylül 2026 | Günlük |
| VFH · VANGUARD WORLD FUND | 0,41% | 242.698 SH | 19 Ağustos 2026 | Günlük |
| FNCL · FIDELITY COVINGTON TRUST | 0,41% | 39.134 NS | 31 Temmuz 2026 | N-PORT |
| EQIN · Columbia ETF Trust I | 0,38% | 4.689 NS | 31 Temmuz 2026 | N-PORT |
| IWS · iShares Trust | 0,34% | 219.438 SH | 11 Eylül 2026 | Günlük |
| JPME · J.P. Morgan Exchange-Traded Fund Tr… | 0,34% | 6.492 NS | 31 Temmuz 2026 | N-PORT |
| VO · VANGUARD INDEX FUNDS | 0,34% | 3.173.919 SH | 19 Ağustos 2026 | Günlük |
| FFSM · FIDELITY COVINGTON TRUST | 0,33% | 19.890 NS | 31 Temmuz 2026 | N-PORT |
| FAS · Direxion Shares ETF Trust | 0,30% | 28.854 NS | 31 Temmuz 2026 | N-PORT |
| ROUS · Lattice Strategies Trust | 0,30% | 8.617 NS | 31 Temmuz 2026 | N-PORT |
| FEX · First Trust Exchange-Traded AlphaDE… | 0,28% | 17.761 NS | 31 Temmuz 2026 | N-PORT |
| BSCS · Invesco Exchange-Traded Self-Indexe… | 0,28% | 9.685.000 | 28 Ekim 2026 | Günlük |
| JVAL · J.P. Morgan Exchange-Traded Fund Tr… | 0,27% | 9.029 NS | 31 Temmuz 2026 | N-PORT |
| VRP · Invesco Exchange-Traded Fund Trust … | 0,26% | 5.300.377 | 28 Ekim 2026 | Günlük |
| FAB · First Trust Exchange-Traded AlphaDE… | 0,26% | 1.783 NS | 31 Temmuz 2026 | N-PORT |
| IWR · iShares Trust | 0,26% | 601.592 SH | 11 Eylül 2026 | Günlük |
| DIVB · iShares Trust | 0,26% | 21.954 SH | 11 Eylül 2026 | Günlük |
| GTOS · Invesco Actively Managed Exchange-T… | 0,26% | 327.000 | 28 Ekim 2026 | Günlük |
| IMCB · iShares Trust | 0,24% | 17.132 SH | 11 Eylül 2026 | Günlük |
| VFMF · VANGUARD WELLINGTON FUND | 0,23% | 6.716 SH | 19 Ağustos 2026 | Günlük |
| SIZE · iShares Trust | 0,22% | 3.936 SH | 11 Eylül 2026 | Günlük |
| IXG · iShares Trust | 0,22% | 6.328 SH | 11 Eylül 2026 | Günlük |
| VLUE · iShares Trust | 0,21% | 84.940 SH | 11 Eylül 2026 | Günlük |
| DGRO · iShares Trust | 0,20% | 366.612 SH | 11 Eylül 2026 | Günlük |
| EUSA · iShares, Inc. | 0,20% | 15.953 SH | 11 Eylül 2026 | Günlük |
| XOEF · iShares Trust | 0,20% | 182 SH | 11 Eylül 2026 | Günlük |
| GSEW · Goldman Sachs ETF Trust | 0,19% | 16.475 NS | 31 Ağustos 2026 | N-PORT |
| RSP · Invesco Exchange-Traded Fund Trust | 0,18% | 825.223 SH | 28 Ekim 2026 | Günlük |
| HDUS · Lattice Strategies Trust | 0,16% | 1.294 NS | 31 Temmuz 2026 | N-PORT |
| DFLV · Dimensional ETF Trust | 0,15% | 42.562 NS | 31 Temmuz 2026 | N-PORT |
| VFVA · VANGUARD WELLINGTON FUND | 0,15% | 5.260 SH | 19 Ağustos 2026 | Günlük |
| VYM · VANGUARD WHITEHALL FUNDS | 0,14% | 585.959 SH | 19 Ağustos 2026 | Günlük |
| USXF · iShares Trust | 0,14% | 8.613 SH | 11 Eylül 2026 | Günlük |
| DFUV · Dimensional ETF Trust | 0,13% | 81.728 NS | 31 Temmuz 2026 | N-PORT |
| VTV · VANGUARD INDEX FUNDS | 0,13% | 1.393.062 SH | 19 Ağustos 2026 | Günlük |
| VEGN · ETF Series Solutions | 0,12% | 879 NS | 31 Temmuz 2026 | N-PORT |
| GSLC · Goldman Sachs ETF Trust | 0,12% | 78.465 NS | 31 Ağustos 2026 | N-PORT |
| VOOV · VANGUARD ADMIRAL FUNDS | 0,12% | 33.710 SH | 19 Ağustos 2026 | Günlük |
| IVE · iShares Trust | 0,12% | 242.973 SH | 11 Eylül 2026 | Günlük |
| GTO · Invesco Actively Managed Exchange-T… | 0,11% | 1.375.792 | 28 Ekim 2026 | Günlük |
| BSCR · Invesco Exchange-Traded Self-Indexe… | 0,11% | 5.154.000 | 28 Ekim 2026 | Günlük |
| IUSV · iShares Trust | 0,11% | 127.797 SH | 11 Eylül 2026 | Günlük |
| IQSU · New York Life Investments ETF Trust | 0,11% | 1.473 NS | 31 Temmuz 2026 | N-PORT |
| SCHV · SCHWAB STRATEGIC TRUST | 0,11% | 72.347 NS | 31 Ağustos 2026 | N-PORT |
| NULV · Nushares ETF Trust | 0,10% | 9.133 NS | 31 Temmuz 2026 | N-PORT |
| ILCV · iShares Trust | 0,10% | 5.697 SH | 11 Eylül 2026 | Günlük |
| VONV · VANGUARD SCOTTSDALE FUNDS | 0,10% | 88.609 SH | 19 Ağustos 2026 | Günlük |
| DSI · iShares Trust | 0,10% | 22.152 SH | 11 Eylül 2026 | Günlük |
| IWD · iShares Trust | 0,09% | 325.641 SH | 11 Eylül 2026 | Günlük |
| GVUS · Goldman Sachs ETF Trust | 0,09% | 1.643 NS | 31 Ağustos 2026 | N-PORT |
| DEUS · DBX ETF Trust | 0,09% | 1.149 NS | 31 Ağustos 2026 | N-PORT |
| PRF · Invesco Exchange-Traded Fund Trust | 0,09% | 39.118 SH | 28 Ekim 2026 | Günlük |
| SNPE · DBX ETF Trust | 0,08% | 10.444 NS | 31 Ağustos 2026 | N-PORT |
| LGDX · Tidal Trust III | 0,08% | 464 NS | 31 Temmuz 2026 | N-PORT |
| EGLE · Global X Funds | 0,08% | 7 NS | 31 Temmuz 2026 | N-PORT |
| XMAG · Tidal Trust II | 0,08% | 610 NS | 31 Ağustos 2026 | N-PORT |
| JUST · Goldman Sachs ETF Trust | 0,08% | 1.855 NS | 31 Ağustos 2026 | N-PORT |
| FNDX · SCHWAB STRATEGIC TRUST | 0,08% | 88.345 NS | 31 Ağustos 2026 | N-PORT |
| DFSU · Dimensional ETF Trust | 0,07% | 6.797 NS | 31 Temmuz 2026 | N-PORT |
| APUE · Trust for Professional Managers | 0,07% | 7.661 NS | 31 Ağustos 2026 | N-PORT |
| FNDB · SCHWAB STRATEGIC TRUST | 0,07% | 4.445 NS | 31 Ağustos 2026 | N-PORT |
| AFLG · First Trust Exchange-Traded Fund VI… | 0,07% | 2.271 NS | 31 Ağustos 2026 | N-PORT |
| TOPC · iShares Trust | 0,07% | 91 SH | 11 Eylül 2026 | Günlük |
| CATH · Global X Funds | 0,06% | 3.364 NS | 31 Temmuz 2026 | N-PORT |
| XCLR · Global X Funds | 0,06% | 9 NS | 31 Temmuz 2026 | N-PORT |
| XTR · Global X Funds | 0,06% | 12 NS | 31 Temmuz 2026 | N-PORT |
| RWL · Invesco Exchange-Traded Fund Trust … | 0,06% | 28.189 SH | 27 Ekim 2026 | Günlük |
| VV · VANGUARD INDEX FUNDS | 0,06% | 171.045 SH | 19 Ağustos 2026 | Günlük |
| ESGV · VANGUARD WORLD FUND | 0,06% | 33.166 SH | 19 Ağustos 2026 | Günlük |
| XYLD · Global X Funds | 0,06% | 7.868 NS | 31 Temmuz 2026 | N-PORT |
| XVV · iShares Trust | 0,06% | 1.679 SH | 11 Eylül 2026 | Günlük |
| EQAL · Invesco Exchange-Traded Fund Trust … | 0,06% | 2.205 SH | 28 Ekim 2026 | Günlük |
| XYLG · Global X Funds | 0,06% | 153 NS | 31 Temmuz 2026 | N-PORT |
| CHRI · Global X Funds | 0,06% | 19 NS | 31 Temmuz 2026 | N-PORT |
| DFAU · Dimensional ETF Trust | 0,06% | 29.436 NS | 31 Temmuz 2026 | N-PORT |
| XRMI · Global X Funds | 0,06% | 118 NS | 31 Temmuz 2026 | N-PORT |
| DFAC · Dimensional ETF Trust | 0,06% | 110.966 NS | 31 Temmuz 2026 | N-PORT |
| PTLC · Pacer Funds Trust | 0,06% | 7.426 NS | 31 Temmuz 2026 | N-PORT |
| BBUS · J.P. Morgan Exchange-Traded Fund Tr… | 0,06% | 20.166 NS | 31 Temmuz 2026 | N-PORT |
| BKLC · BNY Mellon ETF Trust | 0,06% | 12.354 NS | 31 Temmuz 2026 | N-PORT |
| VOTE · TCW ETF Trust | 0,06% | 2.475 NS | 31 Temmuz 2026 | N-PORT |
| GSUS · Goldman Sachs ETF Trust | 0,05% | 7.647 NS | 31 Ağustos 2026 | N-PORT |
| IVV · iShares Trust | 0,05% | 1.845.934 SH | 11 Eylül 2026 | Günlük |
| ILCB · iShares Trust | 0,05% | 2.836 SH | 11 Eylül 2026 | Günlük |
| DFUS · Dimensional ETF Trust | 0,05% | 44.444 NS | 31 Temmuz 2026 | N-PORT |
| SPUU · Direxion Shares ETF Trust | 0,05% | 552 NS | 31 Temmuz 2026 | N-PORT |
| VOXP · Advisors Series Trust | 0,05% | 12 NS | 31 Temmuz 2026 | N-PORT |
| QDPL · Pacer Funds Trust | 0,05% | 3.501 NS | 31 Temmuz 2026 | N-PORT |
| VOO · VANGUARD INDEX FUNDS | 0,05% | 3.801.825 SH | 19 Ağustos 2026 | Günlük |
| VTI · VANGUARD INDEX FUNDS | 0,05% | 4.648.421 SH | 19 Ağustos 2026 | Günlük |
| VONE · VANGUARD SCOTTSDALE FUNDS | 0,05% | 24.536 SH | 19 Ağustos 2026 | Günlük |
| VTHR · VANGUARD SCOTTSDALE FUNDS | 0,05% | 12.338 SH | 19 Ağustos 2026 | Günlük |
| GLOV · Goldman Sachs ETF Trust | 0,05% | 3.842 NS | 31 Ağustos 2026 | N-PORT |
| TOV · EA Series Trust | 0,05% | 553 NS | 31 Temmuz 2026 | N-PORT |
| IWB · iShares Trust | 0,05% | 101.312 SH | 11 Eylül 2026 | Günlük |
| TILT · FlexShares Trust | 0,05% | 4.424 NS | 31 Temmuz 2026 | N-PORT |
| IYY · iShares Trust | 0,05% | 6.268 SH | 11 Eylül 2026 | Günlük |
| SCHX · SCHWAB STRATEGIC TRUST | 0,05% | 156.286 NS | 31 Ağustos 2026 | N-PORT |
| PBP · Invesco Exchange-Traded Fund Trust | 0,05% | 866 SH | 28 Ekim 2026 | Günlük |
| PBUS · Invesco Exchange-Traded Fund Trust … | 0,05% | 23.476 SH | 28 Ekim 2026 | Günlük |
| GUSA · Goldman Sachs ETF Trust II | 0,05% | 4.929 NS | 31 Ağustos 2026 | N-PORT |
| IWV · iShares Trust | 0,05% | 40.317 SH | 11 Eylül 2026 | Günlük |
| SCHK · SCHWAB STRATEGIC TRUST | 0,05% | 11.999 NS | 31 Ağustos 2026 | N-PORT |
| ITOT · iShares Trust | 0,05% | 190.671 SH | 11 Eylül 2026 | Günlük |
| SCHB · SCHWAB STRATEGIC TRUST | 0,05% | 88.238 NS | 31 Ağustos 2026 | N-PORT |
| HCMT · Direxion Shares ETF Trust | 0,04% | 1.018 NS | 31 Temmuz 2026 | N-PORT |
| DCOR · Dimensional ETF Trust | 0,04% | 6.013 NS | 31 Temmuz 2026 | N-PORT |
| SPXL · Direxion Shares ETF Trust | 0,04% | 11.448 NS | 31 Temmuz 2026 | N-PORT |
| PHDG · Invesco Actively Managed Exchange-T… | 0,04% | 114 SH | 28 Ekim 2026 | Günlük |
| TOK · iShares Trust | 0,04% | 401 SH | 11 Eylül 2026 | Günlük |
| URTH · iShares, Inc. | 0,04% | 13.732 SH | 11 Eylül 2026 | Günlük |
| KOKU · DBX ETF Trust | 0,04% | 1.312 NS | 31 Ağustos 2026 | N-PORT |
| DXUV · Dimensional ETF Trust | 0,04% | 843 NS | 31 Temmuz 2026 | N-PORT |
| SPXD · DBX ETF Trust | 0,03% | 10 NS | 31 Ağustos 2026 | N-PORT |
| ACWI · iShares Trust | 0,03% | 45.371 SH | 11 Eylül 2026 | Günlük |
| SFY · Tidal Trust I | 0,03% | 892 NS | 31 Ağustos 2026 | N-PORT |
| VFQY · VANGUARD WELLINGTON FUND | 0,03% | 683 SH | 19 Ağustos 2026 | Günlük |
| VT · VANGUARD INTERNATIONAL EQUITY INDEX… | 0,03% | 129.539 SH | 19 Ağustos 2026 | Günlük |
| QVML · Invesco Exchange-Traded Fund Trust … | 0,03% | 2.199 SH | 28 Ekim 2026 | Günlük |
| USNZ · DBX ETF Trust | 0,02% | 288 NS | 31 Ağustos 2026 | N-PORT |
| USCL · iShares Trust | 0,02% | 2.008 SH | 11 Eylül 2026 | Günlük |
| USCA · DBX ETF Trust | 0,02% | 2.451 NS | 31 Ağustos 2026 | N-PORT |
| BIV · VANGUARD BOND INDEX FUNDS | · | · | 15 Temmuz 2026 | Günlük |
| BSV · VANGUARD BOND INDEX FUNDS | · | · | 15 Temmuz 2026 | Günlük |
| BND · VANGUARD BOND INDEX FUNDS | · | · | 15 Temmuz 2026 | Günlük |
| VUSB · VANGUARD BOND INDEX FUNDS | · | · | 15 Temmuz 2026 | Günlük |
| VCRB · VANGUARD MALVERN FUNDS | · | · | 15 Temmuz 2026 | Günlük |
| VPLS · VANGUARD MALVERN FUNDS | · | · | 15 Temmuz 2026 | Günlük |
| VSDB · VANGUARD MALVERN FUNDS | · | · | 15 Temmuz 2026 | Günlük |
| VCSH · VANGUARD SCOTTSDALE FUNDS | · | · | 15 Temmuz 2026 | Günlük |
| VCIT · VANGUARD SCOTTSDALE FUNDS | · | · | 15 Temmuz 2026 | Günlük |
| VTC · VANGUARD SCOTTSDALE FUNDS | · | · | 30 Temmuz 2026 | Günlük |
| BNDW · VANGUARD SCOTTSDALE FUNDS | · | · | 30 Temmuz 2026 | Günlük |
| VCEB · VANGUARD WORLD FUND | · | · | 30 Temmuz 2026 | Günlük |
MTB Analist Uzlaşması Boğa ve ayı analist görüşleri, 12 aylık fiyat hedefi, yukarı yönlü potansiyel
12 Aylık Fiyat Hedefi
21 analist · 2026-10-29Ortalama hedef $245.93 +11,7%
Akran karşılaştırması (GICS alt sektörü) Anahtar metrikler sektördeki benzerlerine karşı
Mali yıl bazında, fiyatlar her şirketin son mali yıl kapanışına göredir.
| Hisse Sembolü | Piyasa Değeri | P/E | Gelir YoY | Net Kar Marjı | ROE | Brüt Kar Marjı |
|---|---|---|---|---|---|---|
| MTB | · | 11.9 | 7.5% | 172.1% | 9.9% | · |
| TFC | $62.13B | 12.9 | 53.0% | 26.1% | 8.2% | · |
| HBAN | · | · | · | · | · | · |
| CFG | $25.07B | 15.1 | 5.6% | 22.2% | 7.1% | · |
| RF | · | 11.8 | · | 28.6% | 11.4% | · |
| EWBC | $15.46B | 11.8 | 12.2% | 45.2% | 15.5% | · |
| PNFP | $7.41B | 11.8 | 18.3% | 31.2% | 9.5% | · |
| FHN | $11.59B | 12.8 | 7.2% | 28.7% | 11.1% | · |
| WTFC | $9.36B | 12.3 | 5.9% | 310.1% | 11.4% | · |
| SSB | $9.33B | 12.0 | 56.1% | 29.8% | 8.9% | · |
| UMBF | $8.74B | 12.4 | 62.8% | 26.5% | 9.4% | · |
Son Haberler Bu şirketten bahseden son manşetler
İşlem Sinyalleri Giriş fiyatı ve risk/ödül oranı ile son alım/satım sinyalleri
Şu anda açık sinyal yok — hiçbir kart dolu değil ve bu dürüstçe.
Metriklerim Kişisel izleme listeniz — Tam Temeller'den seçilen satırlar
Sizin için önemli olan metrikleri seçin — Yukarıdaki Tam Temeller bölümündeki herhangi bir satırın yanındaki + işaretine tıklayın.
Seçiminiz kaydedildi ve tüm hisse senetlerinde sizinle birlikte gelir.