NGG National Grid Transco, PLC National Grid PLC (NEW) American Depositary Shares
NYSE · Utilities · عرض على SEC EDGAR ↗ إغلاق أكتوبر 2, 2026 10-K/10-Q يونيو 3, 2026NGG لقطة سريعة للسهم السعر، القيمة السوقية، مكرر الربحية (P/E)، ربحية السهم (EPS)، العائد على حقوق الملكية (ROE)، نسبة الدين إلى حقوق الملكية، نطاق 52 أسبوعًا
NGG مخطط سعر السهم OHLCV يومي مع مؤشرات فنية — تحريك وتكبير وتخصيص عرضك
تتكيف دقة الشريط مع الفترة المحددة - مرر مؤشر الفأرة فوق الرسم البياني لرؤية الافتتاح/الأعلى/الأدنى/الإغلاق للشريط.
| تاريخ الاستحقاق | تقسيم | النوع |
|---|---|---|
| 22 مايو، 2017 | 1-for-1 | عكسي |
حول National Grid Transco, PLC National Grid PLC (NEW) American Depositary Shares نظرة عامة على الشركة من ويكيبيديا
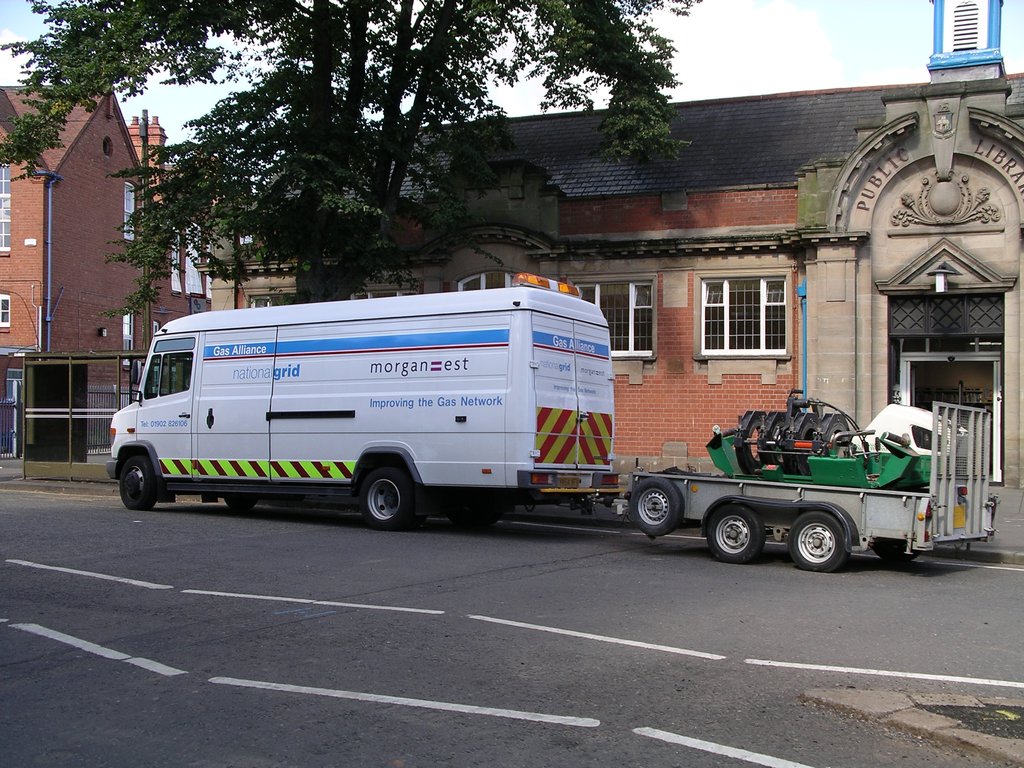
National Grid plc is a British multinational electricity and gas utility company headquartered in London, England. Its principal activities are in Great Britain, where it owns and operates electricity and natural gas transmission networks, and in the Northeastern United States, where as well as operating transmission networks, the company produces and supplies electricity and gas, providing both to customers in New York and Massachusetts.
National Grid plc is one of the largest investor-owned utility companies in the world; it has a primary listing on the London Stock Exchange where it is a constituent of the FTSE 100 Index, and a secondary listing in the form of its American depositary receipts on the New York Stock Exchange.
History
Background (CEGB before 1990)
Before 1990, both the generation and transmission activities in England and Wales were under the responsibility of the Central Electricity Generating Board (CEGB). The present electricity market in the United Kingdom was built upon the breakup of the CEGB into four separate companies in the 1990s.
Its generation (or upstream) activities were transferred to three generating companies — PowerGen, National Power, and Nuclear Electric (later British Energy, eventually EDF Energy)—and its transmission (or downstream) activities to the National Grid Company.
National Grid and acquisitions (1990–1999)
In 1990, the transmission activities of the CEGB were transferred to the National Grid Company plc, which was owned by the twelve regional electricity companies (RECs) through a holding company, National Grid Group plc. The company was first listed on the London Stock Exchange in December 1995.
Expansion and consolidation (2000–2015)
With the beginning of the new millennium, National Grid pursued mergers and international acquisitions. In March 2000, National Grid Group acquired United States companies New England Electric System and Eastern Utilities Associates.
In January 2002, National Grid Group acquired Niagara Mohawk Power Corporation, a New York State utility. In October 2002, National Grid Group merged with Lattice Group, owner of the Transco gas distribution business (Lattice had demerged from BG Group in 2000).
National Grid Group changed its name to National Grid Transco plc. It sold the telecoms business 186K Ltd. which was acquired as part of the merger with Lattice Group for a nominal £1 to Hutchison Whampoa in December 2002. In 2004, the company was found liable for a gas explosion in Transco plc v HM Advocate and subsequently fined £15 million. In August 2004, National Grid Transco agreed to sell four of its regional gas distribution networks for a total cash consideration of £5.8 billion. NGT kept ownership of four other distribution networks, which make up almost half of Great Britain's gas distribution network. In July 2005, National Grid Transco was renamed National Grid plc. On 26 July 2005, National Grid Company was renamed National Grid Electricity Transmission plc, and on 10 October 2005, Transco was renamed National Grid Gas plc.
In February 2006, National Grid announced that it had agreed to buy KeySpan Corporation, a gas distributor and electricity producer in the United States, for $7.3bn (£4.1bn) in cash. Around the same time, National Grid also announced the acquisition of New England Gas Company, a Rhode Island subsidiary of Southern Union Company.
The acquisitions of the two natural gas delivery companies doubled the size of National Grid's American subsidiary, creating the second largest utility in the United States with more than 8 million customers. The acquisition of KeySpan was completed on 24 August 2007, following government and regulatory approval and endorsement by the shareholders of the two companies.
In May 2007, National Grid formed a joint venture with the Dutch transmission operator TenneT for a 260-kilometre (160 mi) 1,000 MW BritNed DC link between the Isle of Grain in Kent and Maasvlakte, near Rotterdam. The installation of the first section of cable link started on 11 September 2009, and the entire 260 km (160 mi) cable was completed in October 2010.
The interconnection became operational on 1 April 2011, and by January 2012, electricity flow had mostly been from the Netherlands to the United Kingdom. The BritNed interconnection would serve as a vital link for the foreseeable European super grid project. In the spring of 2011, National Grid sold off its services in New Hampshire, after their request to increase gas and electric rates was denied.
2015–2021
In November 2015, it was announced that Steve Holliday, the CEO for ten years, would step down in March 2016 and that John Pettigrew, its executive director who joined National Grid in 1991, would succeed him. In June 2016, the Energy Select Committee argued that the company faced too many conflicts of interest, particularly with regard to its ownership of international interconnectors. The committee proposed that the company should be split up.
In December 2016, National Grid agreed to sell a 61 per cent stake in its gas distribution business to a consortium of Macquarie Infrastructure and Real Assets, Allianz Capital Partners, Hermes Investment Management, CIC Capital Corporation, Qatar Investment Authority, Dalmore Capital and Amber Infrastructure Limited, with a further 14% stake under negotiation. The sale was completed on 31 March 2017, following clearance by the European Commission, and the resulting company was named Cadent Gas. National Grid disposed of its remaining 39% holding in Cadent Gas in June 2019.
In July 2019, National Grid's Electricity System Operator arm, separately from its Electricity Transmission arm, announced its intent to join the Powering Past Coal Alliance, furthering its goal of becoming a zero carbon electricity system by 2025. At the time of its announcement, National Grid was the largest energy company based in the United Kingdom to join the alliance, according to publicly available financial figures of 2018.
Later in the year, the company moved ownership of its operations in the United Kingdom to Luxembourg and Hong Kong, to protect itself from Labour's nationalisation plans. A spokesman said, "Labour's proposals for state ownership of National Grid would be highly detrimental to millions of ordinary people who either hold shares in the company or through their pension funds." The Labour Party said the "rip off" move showed the grid needed to be in public hands.
2021–present
In March 2021, National Grid announced it intended to purchase Western Power Distribution from PPL Corporation for £7.8 billion, and sell its Rhode Island gas and electricity network, Narragansett Electric Company, to PPL for about £2.7 billion. These transactions were subject to shareholder and regulatory approval, and were approved in September 2021. Separately, the company started the process to sell its majority stake in the National Grid Gas distribution network.
In 2022, National Grid announced plans to divest a 60 per cent stake in its UK gas transmission and metering business to a consortium including Macquarie Asset Management and British Columbia Investment Management Corporation. The deal was completed on 31 January 2023, forming a new entity named National Gas. The deal was worth around £2.2 billion for National Grid. In July 2023, it was announced that Macquarie acquired a further 20 per cent stake in National Gas, taking its holding to 80%, in a deal worth a further £700 million. The Macquarie-led consortium had the option to buy the final 20 per cent of the company on comparable terms between May and July 2024. The consortium acquired the final 20% in September 2024.
The UK's Energy Act 2023 established an independent system planner and operator, creating the National Energy System Operator (NESO), nationalising the previous Electricity Systems Operator (ESO), owned by National Grid.
In May 2024, the company announced it was looking to sell its Grain LNG Terminal in Kent, England to streamline its business and raise money to fund investment in its core energy networks. It kicked off the sale process in April 2025. On 7 August 2025, CK Infrastructure Holdings was reported to be the lead bidder.
In March 2025, National Grid announced that Zoë Yujnovich would become its next Chief Executive Officer. She succeeded John Pettigrew in November 2025, following his retirement after almost ten years in the role.
United Kingdom operations
National Grid plc has a number of subsidiary companies.
Electricity
Transmission
National Grid Electricity Transmission plc (until 2005, named National Grid Company) owns and maintains the National Grid – the 275kV and 400kV electricity transmission network in England and Wales. (The electricity transmission network in Scotland is owned by ScottishPower in central and southern Scotland, and SSE plc in northern Scotland).
Other subsidiaries part-own (with RTE) and operate the 2,000 Megawatt HVDC Cross-Channel interconnector to France, and part-own (with TenneT) the 1,000 Megawatt BritNed HVDC interconnector to the Netherlands.
In the past, National Grid operated the electricity transmission networks in England and Wales and Scotland in its role as the transmission system operator for Great Britain, working to balance supply and demand in real time, as well as coordinating markets and auctions to ensure sufficient future supply, and exploring initiatives such as demand-side response measures to reduce peaks in electricity demand. Rulings by Ofgem in 2017 required this function to be moved to a separate subsidiary, which began trading in April 2019.
In 2021, Ofgem called for the creation of a fully independent operator in view of potential conflicts of interest from NG's ownership of the transmission network, and in 2022 the UK government confirmed that a fully independent public body – the Future System Operator, covering electricity and gas – would be established. Legislative provisions enabling the creation of the body were included in the Energy Act 2023.
In January 2024, it was announced that the body taking on the system operator functions was to be a "new, independent public corporation" named the National Energy System Operator (NESO). NESO assumed responsibility as transmission system operator for Great Britain from National Grid on 1 October 2024, after the latter agreed a £630 million buyout of its grid operation division by the UK government.
Distribution
National Grid purchased the UK's largest (by area) electricity distribution business, Western Power Distribution, from American utility company PPL in 2021. Western Power Distribution operates the electricity distribution system within the Midlands, south west of England and south Wales, looking after the 132, 66, 33, 11, 6.6kV and LV networks comprising substations, overhead lines and underground cables. In September 2022, the company was renamed to National Grid Electricity Distribution.
Gas
Transmission
National Grid formerly owned National Gas (previously National Grid Gas), which owns and operates the gas transmission system in Great Britain and gas metering operations in the UK. National Grid disposed of its final 20% holding in National Gas in July 2024, with the divestment expected to complete in the first quarter of 2025.
Distribution
National Grid's interests in the British gas distribution sector were divested between 2017 and 2019 and now operate under the Cadent Gas brand.
Other operations
National Grid Property Portfolio houses all land, offices and depots used for National Grid operations that are surplus to requirements or let to third parties.
National Grid has issued invitations to tender which include carbon savings as one of the weighted evaluation factors. Development of a replacement sub-station in Wimbledon, to be completed in phases between 2018 and 2022, was their first tender to include a weighting on carbon. Laing O’Rourke was awarded the winning bid, having demonstrated plans to reduce carbon emissions by 23% along with a £3m cost saving. Their carbon saving proposal equated to taking 7,600 cars off the road for a year.
United States operations
As of 2019, National Grid United States operates 8,881 miles (14,293 km) of electricity transmission and 35,560 miles (57,230 km) of gas transmission and delivers electricity and natural gas to areas of the Northeast states of Massachusetts, New York, and Rhode Island. The business serves over 20 million customers in the three states and is headquartered in Waltham, Massachusetts, in a 300,000-square-foot (28,000 m2) green facility. This subsidiary carries out its business through a number of subsidiary companies (all doing business as "National Grid"). The main ones are:
New England Power Company
Massachusetts Electric Company (in Massachusetts)
Nantucket Electric (in Massachusetts)
Niagara Mohawk Power Corporation (in New York State)
KeySpan Corporation (Long Island and parts of New York City)
Boston Gas Company (including the former Essex Gas Company, in Massachusetts)
Colonial Gas Company (in Massachusetts)
Providence Gas Company (in Rhode Island)
Narragansett Electric Company in Rhode Island, was sold to PPL Corporation in March 2021, and renamed Rhode Island Energy
As of 2019, National Grid invests over $3.5 billion a year in infrastructure in the United States, having increased its investments into "cleaner, greener technologies" in the previous few years. Examples of projects include an offshore wind farm in Rhode Island, and a battery storage project in Nantucket, Massachusetts. Also in 2019, the company spent $100 million to acquire solar and wind generation from Geronimo Energy, in partnership with Washington State Investment Board.
Controversies
Contract negotiations with Massachusetts gas workers represented by the United Steelworkers broke down in June 2018, and the company locked out more than 1,000 employees, cutting off healthcare and pay.
In November 2019, the company was criticised by New York Governor Andrew Cuomo over the company's own moratorium on new natural gas hookups. Cuomo threatened "to revoke the company’s authority to operate its gas franchise in New York City and Long Island, for failing to provide customers with reliable service," according to Utility Dive.
Later, in February 2020, it was discovered that the company was constructing a new natural gas transmission line in Brooklyn from Brownsville to Greenpoint. Local activists have pushed back on the project questioning its necessity, safety, additional cost to customers and noting how it will work against the recently enacted New York State Climate Leadership and Community Protection Act.
In the years 2012 to 2020, National Grid was accused of manipulating energy efficiency programs and overcharging residents of Rhode Island by approximately US$2.2 million.
المصدر: ويكيبيديا (الإنجليزية), CC BY-SA 4.0 · عرض على ويكيبيديا ↗
أداء 10 سنوات اتجاهات الإيرادات وصافي الدخل والهوامش وربحية السهم
التقييم نسب مكرر الربحية (P/E)، مكرر المبيعات (P/S)، مكرر القيمة الدفترية (P/B)، EV/EBITDA — هل السهم مرتفع السعر أم رخيص؟
| المقياس | اتجاه 5 سنوات | NGG | متوسط 5 سنوات | متوسط الأقران | الحكم |
|---|---|---|---|---|---|
| P/E | 129.8متوسط 5 سنوات ≈101.8 | ≈101.8 | · | · |
يتم حساب الوسيط النظير على أساس موحد لكل مقياس وقد لا يتطابق دائمًا مع الأساس السنوي الحالي/الربع الأخير المعروض لهذا السهم.
الربحية هامش الربح الإجمالي والتشغيلي والصافي؛ العائد على حقوق الملكية (ROE)، العائد على الأصول (ROA)، العائد على رأس المال المستثمر (ROIC)
| المقياس | اتجاه 5 سنوات | NGG | متوسط 5 سنوات | متوسط الأقران | الحكم |
|---|---|---|---|---|---|
| Operating Margin (هامش التشغيل) | 30.7%متوسط 5 سنوات ≈25.3% | ≈25.3% | · | · | |
| EBITDA Margin (هامش EBITDA) | 30.7%متوسط 5 سنوات ≈25.3% | ≈25.3% | · | · | |
| Pretax Margin (هامش ما قبل الضريبة) | 23.6%متوسط 5 سنوات ≈18.8% | ≈18.8% | · | · | |
| Net Profit Margin (هامش صافي الربح) | 18.3%متوسط 5 سنوات ≈18.9% | ≈18.9% | · | · | |
| ROA (العائد على الأصول) | 3.0%متوسط 5 سنوات ≈3.9% | ≈3.9% | · | · | |
| ROE | 8.4%متوسط 5 سنوات ≈12.9% | ≈12.9% | · | · | |
| ROIC | 10.7%متوسط 5 سنوات ≈11.2% | ≈11.2% | · | · |
الصحة المالية الديون، السيولة، الملاءة المالية — قوة الميزانية العمومية
| المقياس | اتجاه 5 سنوات | NGG | متوسط 5 سنوات | متوسط الأقران | الحكم |
|---|---|---|---|---|---|
| Current Ratio (النسبة الحالية) | 0.8متوسط 5 سنوات ≈1.0 | ≈1.0 | · | · | |
| Quick Ratio (النسبة السريعة) | 0.4متوسط 5 سنوات ≈0.4 | ≈0.4 | · | · | |
| Interest Coverage (تغطية الفائدة) | 3.2متوسط 5 سنوات ≈3.1 | ≈3.1 | · | · |
النمو نمو الإيرادات وربحية السهم وصافي الدخل: مقارنة بالعام السابق (YoY)، متوسط النمو السنوي المركب لـ 3 سنوات (3Y CAGR)، متوسط النمو السنوي المركب لـ 5 سنوات (5Y CAGR)
لا توجد بيانات أساسية كافية لحساب مجموعة النسب هذه بعد.
كفاءة رأس المال معدل دوران الأصول، معدل دوران المخزون، معدل دوران المستحقات
| المقياس | اتجاه 5 سنوات | NGG | متوسط 5 سنوات | متوسط الأقران | الحكم |
|---|---|---|---|---|---|
| Asset Turnover (دوران الأصول) | 0.2متوسط 5 سنوات ≈0.2 | ≈0.2 | · | · | |
| Receivables Turnover (دوران المستحقات) | 4.4متوسط 5 سنوات ≈5.2 | ≈5.2 | · | · | |
| Revenue / Employee (الإيرادات / الموظف) | ≈$535.5K | · | · | · |
القيمة · ≈ متوسط 5 سنوات · متوسط الصناعة · حكم مقارنة بالمتوسط
التوزيعات العائد، نسبة التوزيع، تاريخ توزيع الأرباح، معدل النمو السنوي المركب لمدة 5 سنوات
| تاريخ الاستحقاق | المبلغ | العملة | العائد |
|---|---|---|---|
| مايو 29, 2026 | $2,17 | USD | ≈4.0% |
| نوفمبر 21, 2025 | $1,07 | USD | ≈4.2% |
| مايو 30, 2025 | $2,06 | USD | ≈9.2% |
| نوفمبر 22, 2024 | $1,02 | USD | ≈11.1% |
| يونيو 7, 2024 | $2,49 | USD | ≈12.8% |
| مايو 31, 2024 | $3,51 | USD | ≈8.1% |
| نوفمبر 22, 2023 | $1,19 | USD | ≈5.5% |
| يونيو 1, 2023 | $2,35 | USD | ≈5.0% |
| نوفمبر 23, 2022 | $1,03 | USD | ≈5.1% |
| يونيو 3, 2022 | $2,09 | USD | ≈4.6% |
| ديسمبر 2, 2021 | $1,16 | USD | ≈5.2% |
| يونيو 3, 2021 | $2,28 | USD | ≈5.2% |
| نوفمبر 25, 2020 | $1,13 | USD | ≈5.2% |
| يوليو 1, 2020 | $2,01 | USD | ≈5.1% |
| نوفمبر 27, 2019 | $1,07 | USD | ≈5.3% |
| مايو 30, 2019 | $2,03 | USD | ≈6.3% |
| نوفمبر 21, 2018 | $1,06 | USD | ≈5.9% |
| مايو 31, 2018 | $2,06 | USD | ≈5.5% |
| نوفمبر 22, 2017 | $1,02 | USD | ≈14.2% |
| مايو 31, 2017 | $1,89 | USD | ≈12.2% |
سجل الأرباح ربحية السهم الفعلية مقابل التقديرات، نسبة المفاجأة %، معدل التجاوز، تاريخ الأرباح التالي
| الفترة | تقرير | EPS Actual | EPS المتوقع | المفاجأة |
|---|---|---|---|---|
| 31 مارس، 2026 | $0.48 | $0.49 | -1.9% | |
| 30 سبتمبر، 2025 | $0.30 | $0.28 | 5.7% | |
| 31 مارس، 2025 | $0.45 | $0.46 | -0.83% | |
| 30 سبتمبر، 2024 | $0.28 | $0.27 | 3.0% | |
| 31 مارس، 2024 | $0.53 | $0.43 | 22.6% |
الأساسيات الكاملة جميع المقاييس حسب السنة — قائمة الدخل، الميزانية العمومية، التدفق النقدي
قائمة الدخل
| المقياس | اتجاه | 2026 | 2025 | 2024 | 2023 | 2022 | 2021 | 2020 | 2019 | 2018 | 2017 |
|---|---|---|---|---|---|---|---|---|---|---|---|
| Revenue | $17.69B | $18.38B | $19.85B | $21.66B | $18.45B | $13.66B | $13.36B | $14.93B | · | $15.04B | |
| R&D Expense | $38M | $43M | $32M | $23M | $11M | $12M | $9M | $19M | · | $14M | |
| Operating Income | $5.43B | $4.93B | $4.47B | $4.88B | $4.37B | $2.40B | $2.28B | $2.87B | · | $3.21B | |
| Interest Expense | $1.71B | $1.81B | $1.71B | $1.60B | $1.07B | $853M | $1.02B | $1.16B | · | $1.14B | |
| Interest Income | $380M | $450M | $248M | $138M | $50M | $58M | $54M | $88M | · | $53M | |
| Pretax Income | $4.18B | $3.65B | $3.05B | $3.59B | $3.44B | $1.66B | $1.40B | $1.84B | · | $2.18B | |
| Income Tax | $939M | $821M | $831M | $876M | $1.26B | $360M | $370M | $339M | · | $374M | |
| Net Income | $3.24B | $2.90B | $2.29B | $7.80B | $2.35B | $1.64B | $1.26B | $1.51B | · | $7.79B | |
| EPS (Basic) | $0.66 | $0.62 | $0.57 | $1.97 | $0.65 | $0.47 | $0.36 | $0.45 | · | $2.07 | |
| EPS (Diluted) | $0.65 | $0.61 | $0.57 | $1.96 | $0.65 | $0.46 | $0.36 | $0.44 | · | $2.06 | |
| Shares (Basic) | 4,946,000,000 | 4,707,000,000 | 3,991,000,000 | 3,956,000,000 | 3,599,000,000 | 3,523,000,000 | 3,461,000,000 | 3,386,000,000 | · | 3,763,000,000 | |
| Shares (Diluted) | 4,971,000,000 | 4,729,000,000 | 4,008,000,000 | 3,973,000,000 | 3,616,000,000 | 3,540,000,000 | 3,478,000,000 | 3,401,000,000 | · | 3,780,000,000 | |
| EBITDA | $5.43B | $4.93B | $4.47B | $4.88B | $4.37B | $2.90B | $2.78B | $2.87B | · | · |
الميزانية العمومية
| المقياس | اتجاه | 2026 | 2025 | 2024 | 2023 | 2022 | 2021 | 2020 | 2019 | 2018 | 2017 |
|---|---|---|---|---|---|---|---|---|---|---|---|
| Cash & Equivalents | $375M | $1.18B | $559M | $163M | $204M | $157M | $73M | $252M | $329M | $1.14B | |
| Receivables | $3.87B | $4.09B | $3.42B | $3.83B | $3.71B | $2.92B | $2.99B | $3.15B | $2.79B | $2.73B | |
| Inventory | $559M | $557M | $828M | $876M | $511M | $439M | $549M | $370M | $341M | $403M | |
| Current Assets | $7.49B | $14.33B | $10.38B | $9.11B | $17.96B | $9.94B | $5.80B | $7.95B | $6.68B | $13.57B | |
| PP&E (Net) | · | · | · | $64.43B | $57.53B | $47.04B | $49.76B | $44.86B | $40.73B | $39.83B | |
| Goodwill | $9.42B | $9.53B | $9.73B | $9.85B | $9.53B | $4.59B | $5.71B | $5.37B | $4.98B | $6.10B | |
| Intangibles | $3.88B | $3.56B | $3.43B | $3.60B | $3.27B | $1.44B | $1.29B | $1.08B | $899M | $923M | |
| Total Assets | $108.28B | $106.74B | $98.33B | $92.70B | $94.86B | $67.22B | $67.56B | $63.41B | $59.20B | $65.84B | |
| Accounts Payable | $5.05B | $4.47B | $4.08B | $5.07B | $4.92B | $3.52B | $3.60B | $3.77B | $3.39B | $3.35B | |
| Current Liabilities | $9.80B | $10.62B | $11.39B | $9.13B | $24.77B | $9.37B | $8.56B | $9.13B | $8.69B | $10.51B | |
| Total Liabilities | $68.95B | $68.92B | $68.43B | $63.13B | $71.00B | $47.36B | $47.77B | $43.84B | $40.36B | $45.46B | |
| Retained Earnings | $41.91B | $40.11B | $32.07B | $31.61B | $26.61B | $23.16B | $21.89B | $22.00B | $21.52B | $22.58B | |
| Stockholders' Equity | $39.30B | $37.80B | $29.87B | $29.54B | $23.83B | $19.84B | $19.77B | $19.55B | $18.82B | $20.37B |
التدفق النقدي
| المقياس | اتجاه | 2026 | 2025 | 2024 | 2023 | 2022 | 2021 | 2020 | 2019 | 2018 | 2017 |
|---|---|---|---|---|---|---|---|---|---|---|---|
| D&A | · | · | · | · | · | · | · | · | · | $1.48B | |
| CapEx | $9.99B | $8.78B | $6.90B | $6.33B | $5.10B | $4.21B | $4.29B | $3.63B | · | $3.30B | |
| Dividends Paid | $1.62B | $1.53B | $1.72B | $1.61B | $922M | $1.41B | $892M | $1.16B | · | $1.46B |
الربحية
| المقياس | اتجاه | 2026 | 2025 | 2024 | 2023 | 2022 | 2021 | 2020 | 2019 | 2018 | 2017 |
|---|---|---|---|---|---|---|---|---|---|---|---|
| Operating Margin | 30.7% | 26.9% | 22.5% | 22.5% | 23.7% | 19.6% | 19.1% | 19.2% | · | · | |
| Net Margin | 18.3% | 15.8% | 11.5% | 36.0% | 12.8% | 11.1% | 8.7% | 10.1% | · | · | |
| Pretax Margin | 23.6% | 19.9% | 15.4% | 16.6% | 18.6% | 14.1% | 12.1% | 12.3% | · | · | |
| EBITDA Margin | 30.7% | 26.9% | 22.5% | 22.5% | 23.7% | 19.6% | 19.1% | 19.2% | · | · | |
| ROA | 3.0% | 2.8% | 2.4% | 8.3% | 2.9% | 2.4% | 1.9% | 2.5% | · | · | |
| ROE | 8.4% | 8.6% | 7.7% | 29.2% | 10.8% | 8.3% | 6.5% | 7.9% | · | · | |
| ROIC | 10.7% | 10.1% | 10.9% | 12.5% | 11.6% | 11.5% | 10.3% | 12.1% | · | · |
السيولة والملاءة
| المقياس | اتجاه | 2026 | 2025 | 2024 | 2023 | 2022 | 2021 | 2020 | 2019 | 2018 | 2017 |
|---|---|---|---|---|---|---|---|---|---|---|---|
| Current Ratio | 0.8 | 1.3 | 0.9 | 1.0 | 0.7 | 1.1 | 0.7 | 0.9 | · | · | |
| Quick Ratio | 0.4 | 0.5 | 0.3 | 0.4 | 0.2 | 0.3 | 0.4 | 0.4 | · | · | |
| Interest Coverage | 3.2 | 2.7 | 2.6 | 3.1 | 4.1 | 3.1 | 2.4 | 2.5 | · | · |
الكفاءة
| المقياس | اتجاه | 2026 | 2025 | 2024 | 2023 | 2022 | 2021 | 2020 | 2019 | 2018 | 2017 |
|---|---|---|---|---|---|---|---|---|---|---|---|
| Asset Turnover | 0.2 | 0.2 | 0.2 | 0.2 | 0.2 | 0.2 | 0.2 | 0.2 | · | · | |
| Receivables Turnover | 4.4 | 4.9 | 5.5 | 5.7 | 5.6 | 5.0 | 4.7 | 5.0 | · | · |
لكل سهم
| المقياس | اتجاه | 2026 | 2025 | 2024 | 2023 | 2022 | 2021 | 2020 | 2019 | 2018 | 2017 |
|---|---|---|---|---|---|---|---|---|---|---|---|
| Revenue / Share | $3.56 | $3.89 | $5.35 | $5.89 | $5.10 | $4.17 | $4.18 | $4.39 | · | · | |
| EPS (TTM) | $0.65 | $0.61 | $0.57 | $1.96 | $0.65 | $0.46 | $0.36 | $0.44 | · | · |
التقييم (آخر 12 شهرًا)
| المقياس | اتجاه | 2026 | 2025 | 2024 | 2023 | 2022 | 2021 | 2020 | 2019 | 2018 | 2017 |
|---|---|---|---|---|---|---|---|---|---|---|---|
| Revenue TTM | $17.69B | $18.38B | $19.85B | $21.66B | $18.45B | $13.66B | $13.36B | $14.93B | · | · | |
| Net Income TTM | $3.24B | $2.90B | $2.29B | $7.80B | $2.35B | $1.64B | $1.26B | $1.51B | · | · | |
| P/E | 129.8 | 106.9 | 119.5 | 34.7 | 118.3 | 127.9 | 160.5 | 125.8 | · | · | |
| Earnings Yield | 0.77% | 0.94% | 0.84% | 2.9% | 0.85% | 0.78% | 0.62% | 0.80% | · | · | |
| Payout Ratio | 50.1% | 52.7% | 75.0% | 20.6% | 39.2% | 86.2% | 70.6% | 76.8% | · | · | |
| Annual Payout | $1.62B | $1.53B | $1.72B | $1.61B | $922M | $1.41B | $892M | $1.16B | · | · |
لكل سهم
| المقياس | اتجاه | Q4 2025 | Q4 2018 | Q4 2017 | Q4 2016 | Q4 2015 | Q4 2014 | Q4 2013 | Q4 2012 | Q4 2011 | Q4 2010 | Q4 2009 | Q4 2008 | Q4 2007 | Q4 2006 | Q4 2005 | Q4 2004 |
|---|---|---|---|---|---|---|---|---|---|---|---|---|---|---|---|---|---|
| EPS (TTM) | $0.61 | · | $2.06 | $0.68 | · | · | · | · | · | · | · | · | · | · | · | · |
التقييم (آخر 12 شهرًا)
| المقياس | اتجاه | Q4 2025 | Q4 2018 | Q4 2017 | Q4 2016 | Q4 2015 | Q4 2014 | Q4 2013 | Q4 2012 | Q4 2011 | Q4 2010 | Q4 2009 | Q4 2008 | Q4 2007 | Q4 2006 | Q4 2005 | Q4 2004 |
|---|---|---|---|---|---|---|---|---|---|---|---|---|---|---|---|---|---|
| Revenue TTM | $18.38B | · | $15.04B | $13.21B | · | · | · | · | · | · | · | · | · | · | · | · | |
| Net Income TTM | $2.90B | · | $7.79B | $2.59B | · | · | · | · | · | · | · | · | · | · | · | · | |
| P/E | · | · | 33.6 | 114.0 | · | · | · | · | · | · | · | · | · | · | · | · | |
| Earnings Yield | · | · | 3.0% | 0.88% | · | · | · | · | · | · | · | · | · | · | · | · | |
| Annual Payout | $1.53B | · | $1.46B | $1.34B | · | · | · | · | · | · | · | · | · | · | · | · |
أحدث فترة على اليسار · القيم الفارغة معروضة كـ ·
القوائم المالية قائمة الدخل، الميزانية العمومية، التدفقات النقدية — سنويًا، آخر 5 سنوات
| المقياس | 2026-03-31 | 2025-03-31 | 2024-03-31 | 2023-03-31 | 2022-03-31 |
|---|---|---|---|---|---|
| الإيرادات | $17.69B | $18.38B | $19.85B | $21.66B | $18.45B |
| هامش الربح التشغيلي % | 30.7% | 26.9% | 22.5% | 22.5% | 23.7% |
| صافي الدخل | $3.24B | $2.90B | $2.29B | $7.80B | $2.35B |
| EPS المخفف | $0.65 | $0.61 | $0.57 | $1.96 | $0.65 |
| المقياس | 2026-03-31 | 2025-03-31 | 2024-03-31 | 2023-03-31 | 2022-03-31 |
|---|---|---|---|---|---|
| النسبة الحالية | 0.8 | 1.3 | 0.9 | 1.0 | 0.7 |
| النسبة السريعة | 0.4 | 0.5 | 0.3 | 0.4 | 0.2 |
لا توجد بيانات أساسية كافية لبناء هذا البيان بعد.
الملاك المؤسسيون (13F) 658 مقدمي إقرار · $5.2B إجمالي · حتى تاريخ 30 سبتمبر، 2026
المؤسسات التي تبلغ عن حيازتها لهذا السهم في نموذج SEC 13F ربع السنوي الخاص بها. المراكز الطويلة فقط؛ قد يظهر مقدم واحد مرتين لأرجل خيارات منفصلة. الأرجل الكبيرة المتعاكسة من خيارات البيع/الشراء تعكس عادةً صناعة السوق أو المخزون المتحوط، وليس القناعة الاتجاهية.
| مراكز جديدة | المراكز الخارجة | زيادة | انخفض | صافي التغير في الأسهم |
|---|---|---|---|---|
| 77 (-26 مقابل الربع السابق) | 43 (+6 مقابل الربع السابق) | 276 (+45 مقابل الربع السابق) | 163 (-14 مقابل الربع السابق) | +4.7M |
مقارنة بـ Q1 2026. المواعيد النهائية لتقديم إقرارات نموذج 13F لهيئة الأوراق المالية والبورصات (SEC) هي في غضون 45 يومًا من نهاية الربع بالإضافة إلى فترة سماح قصيرة للمقدمين المتأخرين — يتم تخطي الأرباع التي لا تزال ضمن هذه النافذة لصالح أحدث زوج تم الإبلاغ عنه بالكامل.
| مؤسسة | القيمة | الأسهم | % من 13F المتتبعة | النوع |
|---|---|---|---|---|
| BANK OF AMERICA CORP /DE/ | $398783029 | 4812152 | 7,61% | الأسهم |
| FMR LLC | $391986092 | 4730132 | 7,48% | الأسهم |
| JPMORGAN CHASE & CO | $310852405 | 3711225 | 5,93% | الأسهم |
| MORGAN STANLEY | $296264864 | 3575054 | 5,66% | الأسهم |
| FEDERATED HERMES, INC. | $198700548 | 2397738 | 3,79% | الأسهم |
| JONES FINANCIAL COMPANIES LLLP | $188650575 | 2272626 | 3,60% | الأسهم |
| WCM INVESTMENT MANAGEMENT, LLC | $183553088 | 2191417 | 3,50% | الأسهم |
| GOLDMAN SACHS GROUP INC | $180363380 | 2176462 | 3,44% | الأسهم |
| ROYAL BANK OF CANADA | $179446000 | 2165393 | 3,43% | الأسهم |
| ENVESTNET ASSET MANAGEMENT INC | $173959606 | 2099207 | 3,32% | الأسهم |
| RENAISSANCE TECHNOLOGIES LLC | $156980475 | 1894298 | 3,00% | الأسهم |
| NORTHERN TRUST CORP | $153395685 | 1851040 | 2,93% | الأسهم |
| BlackRock, Inc. | $127325664 | 1536450 | 2,43% | الأسهم |
| MILFORD FUNDS LTD | $126747262 | 1529471 | 2,42% | الأسهم |
| WELLS FARGO & COMPANY/MN | $121307657 | 1463830 | 2,32% | الأسهم |
| RAYMOND JAMES FINANCIAL INC | $120938654 | 1459378 | 2,31% | الأسهم |
| BRANDES INVESTMENT PARTNERS, LP | $111544463 | 1345982 | 2,13% | الأسهم |
| Connor, Clark & Lunn Investment Management Ltd. | $89450955 | 1079413 | 1,71% | الأسهم |
| Standard Investments LLC | $76654750 | 925000 | 1,46% | الأسهم |
| DIMENSIONAL FUND ADVISORS LP | $75895584 | 915839 | 1,45% | الأسهم |
| LPL Financial LLC | $72325712 | 872761 | 1,38% | الأسهم |
| Cullen Capital Management, LLC | $67584488 | 815548 | 1,29% | الأسهم |
| D. E. Shaw & Co., Inc. | $57058647 | 688532 | 1,09% | الأسهم |
| CAUSEWAY CAPITAL MANAGEMENT LLC | $48913194 | 590240 | 0,93% | الأسهم |
| AMERIPRISE FINANCIAL INC | $39647081 | 479737 | 0,76% | الأسهم |
| BANK OF MONTREAL /CAN/ | $37729594 | 455287 | 0,72% | الأسهم |
| MANUFACTURERS LIFE INSURANCE COMPANY, THE | $36871018 | 444926 | 0,70% | الأسهم |
| Clark Capital Management Group, Inc. | $35553517 | 429028 | 0,68% | الأسهم |
| STIFEL FINANCIAL CORP | $30835229 | 372089 | 0,59% | الأسهم |
| AMERICAN CENTURY COMPANIES INC | $30432433 | 367231 | 0,58% | الأسهم |
| Quantinno Capital Management LP | $29560392 | 356707 | 0,56% | الأسهم |
| Nuveen, LLC | $25212944 | 309958 | 0,48% | الأسهم |
| ABC ARBITRAGE SA | $25024834 | 301977 | 0,48% | الأسهم |
| JANE STREET GROUP, LLC | $24479798 | 295400 | 0,47% | عقد خيار الشراء |
| UBS Group AG | $24317125 | 293437 | 0,46% | الأسهم |
| Bank of New York Mellon Corp | $22930504 | 276705 | 0,44% | الأسهم |
| CITADEL ADVISORS LLC | $22706380 | 274000 | 0,43% | عقد خيار الشراء |
| JANE STREET GROUP, LLC | $21871631 | 263927 | 0,42% | الأسهم |
| FERGUSON WELLMAN CAPITAL MANAGEMENT, INC | $21138231 | 255077 | 0,40% | الأسهم |
| Beck Bode, LLC | $18241651 | 220124 | 0,35% | الأسهم |
| MIRAE ASSET GLOBAL ETFS HOLDINGS Ltd. | $18228748 | 219968 | 0,35% | الأسهم |
| LOCKHEED MARTIN INVESTMENT MANAGEMENT CO | $17759041 | 214300 | 0,34% | الأسهم |
| Creative Planning | $16658054 | 201014 | 0,32% | الأسهم |
| CHARLES SCHWAB INVESTMENT MANAGEMENT INC | $16519554 | 199343 | 0,32% | الأسهم |
| TRUIST FINANCIAL CORP | $16124871 | 194580 | 0,31% | الأسهم |
| HENNESSY ADVISORS INC | $16080426 | 194044 | 0,31% | الأسهم |
| MILLENNIUM MANAGEMENT LLC | $15829330 | 191014 | 0,30% | الأسهم |
| MASSACHUSETTS FINANCIAL SERVICES CO /MA/ | $14982297 | 174115 | 0,29% | الأسهم |
| Invesco Ltd. | $13263232 | 160049 | 0,25% | الأسهم |
| Cetera Investment Advisers | $13227181 | 159614 | 0,25% | الأسهم |
ملكية صناديق المؤشرات المتداولة محتفظ بها بواسطة 8 صناديق مؤشرات متداولة
الوزن يعكس فقط ممتلكات الأسهم المباشرة (N-PORT)؛ قد تحتفظ الصناديق المضاعفة أو القائمة على المشتقات بتعرض إضافي للمقايضة غير معروض.
| صندوق | الوزن | الوحدات | حتى تاريخ | المصدر |
|---|---|---|---|---|
| ZAP · Global X Funds | 3,79% | 218862 NS | 31 يوليو، 2026 | N-PORT |
| GENW · Spinnaker ETF Series | 2,27% | 1453 NS | 31 يوليو، 2026 | N-PORT |
| PAYR · Federated Hermes ETF Trust | 2,05% | 14625 NS | 31 يوليو، 2026 | N-PORT |
| CVGD · Elevation Series Trust | 1,53% | 26548 NS | 31 يوليو، 2026 | N-PORT |
| DFSI · Dimensional ETF Trust | 0,16% | 22835 NS | 31 يوليو، 2026 | N-PORT |
| DFIC · Dimensional ETF Trust | 0,07% | 130360 NS | 31 يوليو، 2026 | N-PORT |
| DFAX · Dimensional ETF Trust | 0,03% | 47840 NS | 31 يوليو، 2026 | N-PORT |
| FBCV · FIDELITY COVINGTON TRUST | 0,00% | 64 NS | 31 يوليو، 2026 | N-PORT |
NGG توافق الآراء التحليلي آراء المحللين الصعودية والهبوطية، السعر المستهدف لمدة 12 شهرًا، الصعود
السعر المستهدف لمدة 12 شهرًا
5 محللين · 2026-10-01السعر المستهدف المتوسط $91.19 +19,8%
آخر الأخبار أحدث العناوين التي تذكر هذه الشركة
مقاييسي قائمة المراقبة الشخصية الخاصة بك — صفوف مختارة من الأساسيات الكاملة
اختر المقاييس التي تهمك — انقر فوق علامة + بجوار أي صف في الأساسيات الكاملة أعلاه.
يتم حفظ اختيارك ويتبعك عبر جميع الأسهم.