
CDNS Cadence Design Systems, Inc. - Common Stock
NASDAQ · Technology · Lihat di SEC EDGAR ↗ 10-K/10-Q Jul 29, 2026CDNS Cuplikan Saham Harga, kapitalisasi pasar, P/E, EPS, ROE, utang/ekuitas, kisaran 52 minggu
CDNS Grafik Harga Saham OHLCV harian dengan indikator teknis — geser, perbesar, dan sesuaikan tampilan Anda
Granularitas batang menyesuaikan dengan periode yang dipilih — arahkan kursor ke bagan untuk melihat buka/tinggi/rendah/tutup untuk sebuah batang.
| Tanggal ex-dividen | Pemecahan | Tipe |
|---|---|---|
| 17 Nov. 1997 | 2-for-1 | Maju |
| 3 Juni 1996 | 3-for-2 | Maju |
| 31 Okt. 1995 | 3-for-2 | Maju |
Tentang Cadence Design Systems, Inc. - Common Stock Tinjauan perusahaan dari Wikipedia
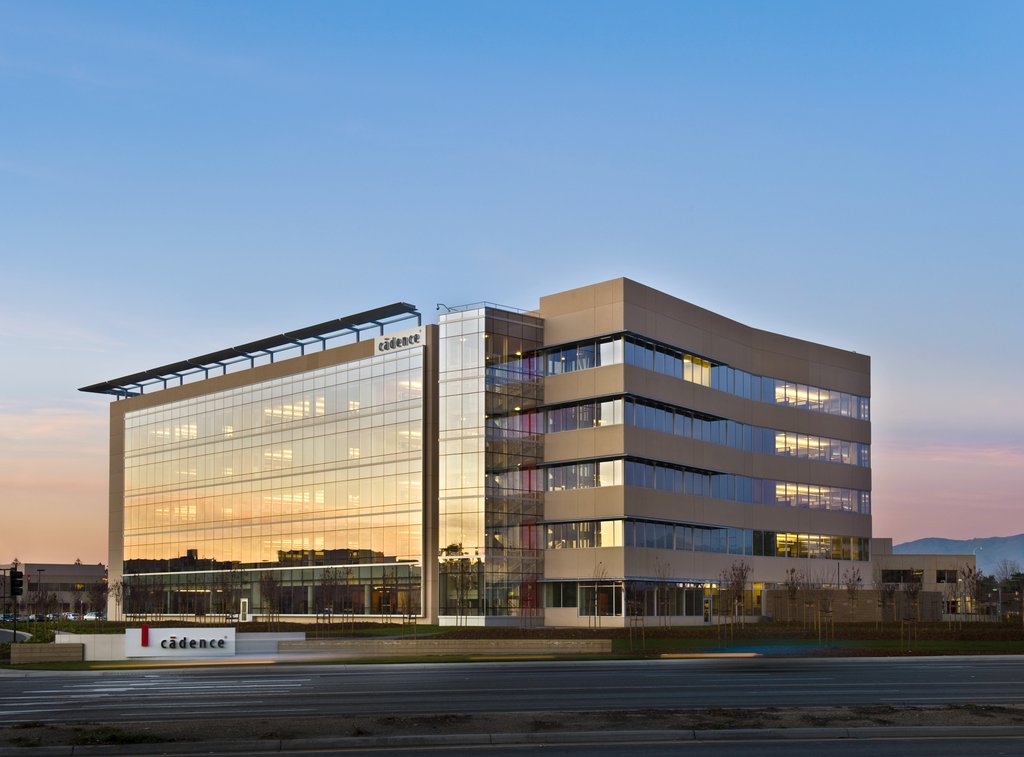
Cadence Design Systems, Inc. (stylized as cādence) is an American multinational technology and computational software company headquartered in San Jose, California. Initially specialized in electronic design automation (EDA) software for the semiconductor industry, the company currently makes software and hardware for designing products such as integrated circuits, systems on chips (SoCs), printed circuit boards, as well as develops large-scale molecular modelling applications and toolkits for pharmaceutical drug developers. The company also licenses intellectual property for the electronics, aerospace, defense and automotive industries.
History
1983–1999
Founded in 1983 in San Jose, California, Cadence Design Systems began as an electronic design automation (EDA) company named Solomon Design Automation (SDA). SDA's cofounders included James Solomon, Richard Newton, Kenneth Keller, and Alberto Sangiovanni-Vincentelli. Cadence was formed by the merger of SDA and ECAD. A public company, ECAD had been co-founded by Ping Chao, Glen Antle, and Paul Huang in 1982. Cadence Design Systems was officially formed through the 1988 merger of SDA and ECAD, with Joseph Costello appointed both CEO and president of the newly combined company. After the merger, Cadence began trading on the New York Stock Exchange and Costello oversaw further mergers and acquisitions.
In 1989, the company acquired Gateway Design Automation for $72 million. In 1990 it acquired Automated Systems Inc., and in doing so added "board design to its existing line of chip design software". In 1991, Cadence acquired its rival Valid Logic Systems for around $200 million, its biggest acquisition yet.
In 1996, Cadence acquired High Level Design Systems, at which point Cadence had 3,300 employees and $742 million in annual revenue. Following the resignation of Cadence's original CEO Joe Costello in 1997, Jack Harding was appointed CEO. Ray Bingham was named CEO in 1999. Cadence purchased Ambit Design Systems for $260 million, which made tools for system-on-a-chip technology, in 1998, and OrCAD Systems in 1999. Cadence acquired Quickturn Design Systems in 1999, preventing a hostile takeover attempt by Mentor Graphics.
2000–2019
Under urging by executives such as Jim Hogan and executive vice president Penny Herscher, between 2001 and 2003, Cadence purchased a number of implementation tools through acquisition, such as Silicon Perspective, Verplex, and Celestry Design. The acquisitions were apparently in part to counter the 2001 purchase of Avanti by Synopsys, as Synopsys had become their primary market rival. In 2004, Mike Fister became Cadence's new CEO and president, with Ray Bingham becoming chairman. The former chairman, Donald L. Lucas, remained on the Cadence board. Between 2004 and 2007, Cadence purchased four companies, including the software developer Verisity, and in 2006, it spent $1 billion in stock buybacks.
In 2007, Cadence announced it would be introducing a new chip-making process that laid wires diagonally as well as horizontally and vertically. In June 2007, Cadence had a market value of around $6.4 billion. That year, Cadence was rumored to be in talks with Kohlberg Kravis Roberts and Blackstone Group regarding a possible sale of the company. Cadence withdrew a $1.6 billion offer to purchase Mentor Graphics in 2008. Also that year, Cadence's board appointed Lip-Bu Tan as acting CEO, after the resignation of Mike Fister; Tan had served on the Cadence board of directors since 2004. In January 2009, the board of directors of Cadence voted unanimously to confirm Lip-Bu Tan as president and CEO. In 2011, it purchased Altos Design Automation. Subsequent notable acquisitions included Cosmic Circuits and Tensilica in 2013, Forte Design Systems in 2014, and the AWR Corporation in 2019.
2020–2025
Cadence had 9,300 employees and annual revenue of $3 billion in 2021. Most of its revenue came from licensing its software and intellectual property. In April 2021, following a Washington Post report on the use of Cadence and Synopsys technology in the People's Liberation Army's military-civil fusion efforts, U.S. legislators Michael McCaul and Tom Cotton requested that the United States Department of Commerce tighten controls on the sales of semiconductor manufacturing software. On December 15, 2021, Anirudh Devgan assumed the role of Cadence president & CEO, after having been named Cadence president in 2017. Lip-Bu Tan retired as CEO and became executive chairman and left this position and the board in May 2023. In 2021, Cadence launched an artificial intelligence platform to streamline processor development.
Although most of Cadence's customers for decades were "traditional semiconductor firms", around 40% of Cadence's revenue by 2022 came from customers who were "systems" oriented, or seeking products tailored for various industries that utilized chips in a central role. Cadence was also increasingly designing customized chips for clients and having them manufactured by third parties such as Taiwan Semiconductor Manufacturing, a practice which had become more popular in the face of worldwide chip shortages and shipping issues, according to Reuters. By late 2022, Cadence had clients such as Tesla and Apple Inc. Cadence acquired OpenEye Scientific Software for $500 million in September 2022, rebranding the company OpenEye Cadence Molecular Sciences and making it into a business unit. OpenEye signed Pfizer as a software client in October 2023.
Cadence purchased several businesses from Rambus in 2023. In February 2024, Cadence "quietly stepped into the supercomputer business", according to TechRadar, when it unveiled the M1, its own supercomputer designed to run computational fluid dynamics (CFD) while utilizing AI. In June 2024, Cadence purchased BETA CAE Systems.
In January 2025, Cadence announced the acquisition of Secure-IC, an embedded security IP platform provider; the acquisition is expected to close by mid-2025, following the usual regulatory approvals and other closing conditions, and be immaterial to 2025 revenue and earnings.
In mid-2025, the Trump administration briefly paused the issuing of licenses for exports of American EDA software to China, including Cadence products. In July 2025, it was announced that Cadence would plead guilty to violating U.S. export controls and pay US$140 million.
On September 4, 2025, Cadence Design Systems announced it would acquire the design and engineering business of Stockholm-based Hexagon AB for €2.7 billion (approximately $3.16 billion) in a stock-and-cash deal. The acquisition includes Hexagon's MSC Software business, a provider of engineering simulation and analysis software and workflows.
Products
Originally known as a creator of electronic design automation (EDA) software, the company currently develops software, hardware and intellectual property (IP) used to design chips, chiplet-style products, and printed circuit boards, while also selling hardware systems that run its chip design software.
It also has tools for "electromagnetics, thermal and computational fluid dynamics in the high-tech electronics, aerospace and defense and automotive sectors", and according to Investor's Business Daily in 2023, it specializes in products for fields such as "artificial intelligence and machine learning, cloud computing, 3D technology, and AI-enabled big data analytics". Among market applications are "hyperscale computing, 5G communications, automotive, mobile, aerospace, consumer, industrial and health care".
Integrated circuit software
The company develops a number of technologies for creating custom integrated circuits. For example, its Virtuoso Platform, later renamed Virtuoso Studio, incorporates tools for designing full-custom integrated circuits. In 2019, Cadence introduced its Spectre X parallel circuit simulator, so that users could distribute time- and frequency-domain simulations across hundreds of CPUs for speed. Cadence also offers AWR, a radio frequency to millimeter wave design environment for designing 5G/Wireless products. AWR is used for communications, aerospace and defense, semiconductor, computer, and consumer electronics.
Digital implementation and signoff
Cadence has a number of digital implementation and signoff tools, including Genus, Innovus, Tempus & Voltus, among others. In 2020, Cadence integrated its Innovus place and route engine and optimizer into Genus Synthesis. Stratus is Cadence's high-level synthesis tool, and is used to create RTL implementations from C, C++, or SystemC code. Other formal verification and signoff tools include Conformal Equivalence Checker, Joules RTL Power Solution, Quantus Extraction Solution, and Cadence's Modus DFT Software Solution.
System verification
Cadence has developed a number of formal verification products for chip design. JasperGold is a formal verification tool, initially introduced in 2003 and upgraded with machine learning in 2019. vManager is a verification management tool for tracking the verification process. Cadence announced Perspec System Verifier in 2014 for defining and verifying system-level verification scenarios, with Perspec made compatible with the Accellera Portable Test and Stimulus Standard (PSS) several years later. Introduced in 2017, Cadence's parallel simulator Xcelium is based on a multi-core parallel computing architecture.
Hardware emulation
In 2015, Cadence announced the Palladium Z1 hardware emulation platform, for verifying billion-gate designs. which was based on emulation technology from Cadence's 1998 acquisition of Quickturn. Cadence announced Palladium Z2 in 2021 as a successor to the Z1 platform with improved performance.
The Protium FPGA prototyping platform was introduced in 2014, followed by the Protium S1 in 2017, which was built on Xilinx Virtex UltraScale FPGAs. Protium X1 rack-based prototyping was introduced in 2019, which Cadence claimed supported a 1.2 billion gate SoCs at around 5 MHz. with Palladium S1/X1 and Protium sharing a single compilation flow. In 2021, Protium X2 was announced; Cadence claimed a 1.5X performance and 2X capacity improvement over Protium X1.
SIP blocks
Cadence supplies semiconductor intellectual property (SIP) blocks, covering interface design, USB, MIPI, ethernet, memory, analog, SoC peripherals, and data plane processing units. Cadence also develops chip verification technologies including simulators and formal verification tools. Cadence develops Tensilica DSP processors for audio, vision, wireless modems, and convolutional neural nets. Tensilica DSP processors IP in 2019 included: Tensilica Vision DSPs for imaging, vision, and AI processing; Tensilica HiFi DSPs for audio processing; Tensilica Fusion DSPs for IoT; Tensilica ConnX DSPs for radar, lidar, and communications processing; and Tensilica DNA Processor Family for AI acceleration. In 2021, Cadence launched the Tensilica AI Platform to accelerate AI SoC development and improve performances.
PCB and packaging technologies
The company provides several tools for the design of printed circuit boards (PCB) and of chip packages. Its Allegro Platform covers co-design of integrated circuits, packages, and PCBs on industrial scale. The OrCAD/PSpice product line aims at smaller design teams and individual PCB designers. OrbitIO Interconnect Designer is a die/package planning & route optimization tool. InspectAR uses augmented reality to map out complicated circuit board electronics for real-time labelling of board schematics.
Systems design and analysis
The company has a number of tools for system analysis. Sigrity offers tools for signal, power integrity, and thermal integrity analysis and IC package design. Introduced in April 2019 as part of Cadence's expansion into system analysis, Clarity is a 3D field solver for electromagnetic analysis, that uses distributed adaptive meshing to partition jobs across multiple cores. In September 2019, Cadence announced Celsius, a parallel architecture thermal solver that uses finite element analysis for solid structures and computational fluid dynamics (CFD) for fluids.
Cascade Technologies, Inc includes hi-fidelity CFD solvers for multiphysics analysis of turbulence fluid flow. Acquired by Cadence from Pointwise in 2021, Fidelity Pointwise is for computational fluid dynamics (CFD) mesh generation.
Machine design and digital twins
Cadence in 2021 acquired a number of system analysis products from NUMECA, known for software tools used in the automotive, marine, aerospace, and power generation industries. Among the tools were Fidelity (formerly known as OMNIS), a computational fluid dynamics (CFD), mesh generation, multi-physics simulation, and optimization product. Its Cadence Reality digital twin platform creates manipulatable digital models of designs or factories.
Cadence Design Systems in February 2024 launched its Cadence Millennium Enterprise Multiphysics Platform, or Millennium M1. The hardware/software combination was designed for creating digital twins. It draws from Cadence's older Fidelity CFD suite.
Drug design
Cadence's OpenEye Scientific division has computational molecular modeling and simulation software used by pharmaceutical and biotechnology companies for purposes such as drug discovery and antibody discovery. The Orion is OpenEye's software-as-a-service platform. OpenEye Scientific has its headquarters in Santa Fe, New Mexico.
Artificial intelligence
According to Reuters, in 2023 Cadence has been "providing tools to design chips for AI" and "adding AI into its own software to help in the complex process of designing chips". Cerebrus was released in 2021, and is a machine learning-based chip design software which utilizes reinforcement learning and is meant to automatically optimize the Cadence digital design flow. In 2022, Cadence introduced the AI platform Optimality Intelligent System Explorer, a system design tool with multiphysics system analysis software. Designed to be compatible with Clarity 3D and SigrityX, Microsoft was an early adopter. In September 2023, Cadence released software called ChipGPT, allowing companies to create custom silicon with assistance from AI.
Recognition
In 2016, former Cadence CEO Lip-Bu Tan was awarded the Dr. Morris Chang Exemplary Leadership Award by the Global Semiconductor Alliance. In 2019, Investor's Business Daily ranked Cadence Design Systems #5 on its 50 Best Environmental, Social, and Governance (ESG) Companies list. In 2020, Cadence ranked #45 on People magazine's Companies that Care list. Fortune magazine named Cadence to its 100 Best Companies to Work For list for the sixth consecutive year in 2020. In 2021, Anirudh Devgan was awarded the prestigious IEEE/SEMI Phil Kaufman award and in 2022 was inducted into National Academy of Engineering.
Sponsorship
In May 2022, the Formula 1 motor racing team McLaren announced a multi-year partnership deal with Cadence. Cadence partnered with the San Francisco 49ers in April 2023 on a several year technology project to fix energy efficiencies at Levi's Stadium. The deal also gave Cadence the naming rights to the team's mobile app.
Acquisitions timeline
Controversies
Lawsuits
Avanti Corporation From 1995 until 2002, Cadence was involved in a 6-year-long legal dispute with Avanti Corporation (brand name "Avant!"), in which Cadence claimed Avanti stole Cadence code, and Avanti denied it. According to Business Week "The Avanti case is probably the most dramatic tale of white-collar crime in the history of Silicon Valley". The Avanti executives eventually pleaded no contest and Cadence received several hundred million dollars in restitution. Avanti was then purchased by Synopsys, which paid $265 million more to settle the remaining claims. The case resulted in a number of legal precedents.
Aptix Corporation Quickturn Design Systems, a company acquired by Cadence, was involved in a series of legal events with Aptix Corporation. Aptix licensed a patent to Mentor Graphics and the two companies jointly sued Quickturn over an alleged patent infringement. Amr Mohsen, CEO of Aptix, forged and tampered with legal evidence and was subsequently charged with conspiracy, perjury, and obstruction of justice. Mohsen was arrested after violating his bail agreement by attempting to flee the country. While in jail, Mohsen plotted to intimidate witnesses and kill the federal judge presiding over his case. Mohsen was further charged with attempting to delay a federal trial by feigning incompetency. Due to the overwhelming misconduct, the judge ruled the lawsuit as unenforceable and Mohsen was sentenced to 17 years in prison. Mentor Graphics subsequently sued Aptix to recoup legal costs. Cadence also sued Mentor Graphics and Aptix to recover legal costs.
Berkeley Design Automation In 2013, Cadence sued Berkeley Design Automation (BDA) for circumvention of a license scheme to link its Analog FastSpice (AFS) simulator to Cadence's Analog Design Environment (Virtuoso ADE). The lawsuit was settled less than one year later with an undisclosed payment of BDA and a multi-year agreement to support interoperability of AFS with ADE through Cadence's official interface. BDA was bought by Mentor Graphics a few months later.
Export control violations and Chinese military university sales
In July 2025, Cadence Design Systems agreed to plead guilty to criminal charges and pay over $140 million in combined penalties for illegally exporting semiconductor design technology to China's National University of Defense Technology (NUDT), a military university controlled by China's Central Military Commission. According to the U.S. Department of Justice and Bureau of Industry and Security, Cadence's Chinese subsidiary knowingly sold electronic design automation (EDA) hardware, software, and semiconductor design technology valued at over $45 million to NUDT between 2015 and 2021, despite the university being placed on the U.S. Entity List in February 2015 due to its use of American technology for supercomputers "believed to support nuclear explosive simulation and military simulation activities".
The violations involved employees at Cadence's Chinese subsidiary using intermediary companies, including Central South CAD Center (CSCC) and later Phytium Technology, to disguise sales to the restricted military university. Internal communications revealed that Cadence China employees were explicitly instructed to refer to NUDT only in Chinese characters and use "CSCC" in English correspondence because "the subject [was] too sensitive." The Department of Justice noted that Cadence received only partial cooperation credit because the company "failed to voluntarily disclose the misconduct" and did not fully facilitate interviews of China-based employees, ultimately resulting in the company being placed on three years of corporate probation.
Sumber: Wikipedia (English), CC BY-SA 4.0 · Lihat di Wikipedia ↗
Kinerja 10 Tahun Tren Pendapatan, laba bersih, margin, dan EPS
Valuasi Rasio P/E, P/S, P/B, EV/EBITDA — apakah sahamnya mahal atau murah?
| Metrik | Tren 5 Tahun | CDNS | rata-rata 5T | Median Rekan | Kesimpulan |
|---|---|---|---|---|---|
| P/E (TTM) | 62.9rata-rata 5T ≈70.6 | ≈70.6 | 36.0 | Terlalu mahal | |
| P/S (TTM) | 14.9rata-rata 5T ≈16.3 | ≈16.3 | 7.7 | Terlalu mahal | |
| P/B (MRQ) | 12.7rata-rata 5T ≈17.9 | ≈17.9 | 12.4 | Lebih mahal | |
| Harga / FCF (TTM) | 51.9rata-rata 5T ≈55.1 | ≈55.1 | · | · | |
| Harga / Arus Kas (TTM) | 47.0rata-rata 5T ≈50.3 | ≈50.3 | 33.8 | Terlalu mahal | |
| Harga / Nilai Buku Berwujud (MRQ) | 17.5rata-rata 5T ≈43.0 | ≈43.0 | · | · | |
| PEG Ratio (Rasio PEG) | ≈4.5 | · | · | · |
Median rekan dihitung berdasarkan basis standar per metrik dan mungkin tidak selalu cocok dengan basis TTM/MRQ yang ditampilkan untuk saham ini.
Profitabilitas Margin kotor, operasional, dan bersih; ROE, ROA, ROIC
| Metrik | Tren 5 Tahun | CDNS | rata-rata 5T | Median Rekan | Kesimpulan |
|---|---|---|---|---|---|
| Margin Operasi (TTM) | 30.3%rata-rata 5T ≈28.8% | ≈28.8% | 27.9% | Sejajar | |
| Margin EBITDA (TTM) | 35.9%rata-rata 5T ≈32.9% | ≈32.9% | 27.9% | Sejajar | |
| Margin Sebelum Pajak (TTM) | 31.2%rata-rata 5T ≈29.0% | ≈29.0% | 30.6% | Sejajar | |
| Margin Laba Bersih (TTM) | 23.6%rata-rata 5T ≈23.3% | ≈23.3% | 23.9% | Lemah | |
| ROA (TTM) | 12.8%rata-rata 5T ≈16.0% | ≈16.0% | 10.6% | Sejajar | |
| ROE (TTM) | 23.2%rata-rata 5T ≈26.6% | ≈26.6% | 22.6% | Sejajar | |
| ROIC | 19.9%rata-rata 5T ≈25.8% | ≈25.8% | 17.8% | Sejajar |
Kesehatan Keuangan Utang, likuiditas, solvabilitas — kekuatan neraca
| Metrik | Tren 5 Tahun | CDNS | rata-rata 5T | Median Rekan | Kesimpulan |
|---|---|---|---|---|---|
| Rasio Lancar (MRQ) | 1.7rata-rata 5T ≈2.0 | ≈2.0 | 1.4 | Likuiditas kuat | |
| Quick Ratio (Rasio Cepat) | 2.5rata-rata 5T ≈1.7 | ≈1.7 | 0.8 | Likuiditas kuat | |
| Interest Coverage (Cakupan Bunga) | 12.8rata-rata 5T ≈31.6 | ≈31.6 | 19.7 | Likuiditas rendah |
Pertumbuhan Pertumbuhan Pendapatan, EPS, dan Laba Bersih: YoY, CAGR 3T, CAGR 5T
| Metrik | Tren 5 Tahun | CDNS | rata-rata 5T | Median Rekan | Kesimpulan |
|---|---|---|---|---|---|
| Revenue YoY (Pendapatan YoY) | 14.1%rata-rata 5T ≈14.6% | ≈14.6% | · | · | |
| Revenue CAGR 3Y (CAGR Pendapatan 3T) | 14.1%rata-rata 5T ≈15.0% | ≈15.0% | · | · | |
| Revenue CAGR 5Y (CAGR Pendapatan 5T) | 14.6% | · | · | · | |
| EPS YoY | 5.5%rata-rata 5T ≈14.4% | ≈14.4% | · | · | |
| Net Income YoY (Laba Bersih YoY) | 5.1%rata-rata 5T ≈13.8% | ≈13.8% | · | · | |
| EPS CAGR 3Y (CAGR EPS 3T) | 9.5%rata-rata 5T ≈15.6% | ≈15.6% | · | · | |
| EPS CAGR 5Y (CAGR EPS 5T) | 14.0% | · | · | · | |
| Net Income CAGR 3Y (CAGR Laba Bersih 3T) | 9.3%rata-rata 5T ≈15.0% | ≈15.0% | · | · | |
| Net Income CAGR 5Y (CAGR Laba Bersih 5T) | 13.4% | · | · | · |
Efisiensi Modal Perputaran aset, perputaran persediaan, perputaran piutang
| Metrik | Tren 5 Tahun | CDNS | rata-rata 5T | Median Rekan | Kesimpulan |
|---|---|---|---|---|---|
| Asset Turnover (Perputaran Aset) | 0.6rata-rata 5T ≈0.7 | ≈0.7 | 0.6 | Sejajar | |
| Receivables Turnover (Perputaran Piutang) | 6.5rata-rata 5T ≈8.1 | ≈8.1 | 5.7 | Tingkat teratas | |
| Revenue / Employee (Pendapatan Tahunan ÷ karyawan (jumlah karyawan, yfinance). Turunan — bukan konsep SEC-XBRL yang tersimpan.) | ≈$342.9K | · | · | · |
nilai · ≈ rata-rata 5T · median industri · penilaian relatif terhadap median
Riwayat Pendapatan EPS aktual vs perkiraan, kejutan %, tingkat keberhasilan, tanggal pendapatan berikutnya
| Periode | Laporan | EPS Aktual | EPS Estimasi | Kejutan |
|---|---|---|---|---|
| 30 Juni 2026 | Jul 27, 2026 | $2.11 | $2.10 | 0.67% |
| 31 Maret 2026 | $1.96 | $1.94 | 1.2% | |
| 31 Des. 2025 | $1.99 | $1.95 | 2.0% | |
| 30 Sep. 2025 | $1.93 | $1.82 | 5.9% | |
| 30 Juni 2025 | $1.65 | $1.59 | 4.1% | |
| 31 Maret 2025 | $1.57 | $1.52 | 3.2% |
Fundamental Lengkap Semua metrik per tahun — laporan laba rugi, neraca, arus kas
Laporan Laba Rugi
| Metrik | Tren | 2025 | 2024 | 2023 | 2022 | 2021 | 2020 | 2019 | 2018 | 2017 | 2016 | 2015 | 2014 |
|---|---|---|---|---|---|---|---|---|---|---|---|---|---|
| Revenue | $5.30B | $4.64B | $4.09B | $3.56B | $2.99B | $2.68B | $2.34B | $2.14B | $1.94B | $1.82B | $1.70B | $1.58B | |
| SG&A Expense | $313M | $274M | $242M | $242M | $189M | $154M | $140M | $133M | $134M | $125M | $110M | $114M | |
| Operating Expenses | $3.80B | $3.29B | $2.84B | $2.49B | $2.21B | $2.04B | $1.84B | $1.74B | $1.62B | $1.57B | $1.42B | $1.37B | |
| Operating Income | $1.49B | $1.35B | $1.25B | $1.07B | $779M | $646M | $492M | $396M | $324M | $245M | $285M | $207M | |
| Interest Expense | $117M | $76M | $36M | $23M | $17M | $21M | $19M | $23M | $26M | $24M | $28M | $34M | |
| Interest Income | $102M | $62M | $30M | $10M | $3M | $4M | $10M | $8M | $4M | $3M | $3M | $2M | |
| Other Non-op | $147M | $121M | $67M | $-5M | $6M | $8M | $6M | $3M | $17M | $16M | $10M | $8M | |
| Pretax Income | $1.52B | $1.40B | $1.28B | $1.05B | $768M | $633M | $479M | $376M | $315M | $237M | $268M | $181M | |
| Income Tax | $413M | $340M | $241M | $196M | $72M | $42M | $-510M | $31M | $111M | $34M | $15M | $22M | |
| Net Income | $1.11B | $1.06B | $1.04B | $849M | $696M | $591M | $989M | $346M | $204M | $203M | $252M | $159M | |
| EPS (Basic) | $4.09 | $3.89 | $3.86 | $3.13 | $2.54 | $2.16 | $3.62 | $1.26 | $0.75 | $0.71 | $0.88 | $0.56 | |
| EPS (Diluted) | $4.06 | $3.85 | $3.82 | $3.09 | $2.50 | $2.11 | $3.53 | $1.23 | $0.73 | $0.70 | $0.81 | $0.52 | |
| Shares (Basic) | 271,333,000 | 271,212,000 | 269,381,000 | 271,198,000 | 273,504,000 | 273,728,000 | 273,239,000 | 273,729,000 | 272,097,000 | 284,502,000 | 288,018,000 | 283,349,000 | |
| Shares (Diluted) | 273,312,000 | 273,833,000 | 272,748,000 | 275,011,000 | 278,858,000 | 279,641,000 | 280,515,000 | 281,144,000 | 280,221,000 | 291,256,000 | 312,302,000 | 306,775,000 | |
| EBITDA | $1.72B | $1.55B | $1.40B | $1.21B | $921M | $791M | $615M | $515M | $439M | $364M | $404M | · |
Neraca
| Metrik | Tren | 2025 | 2024 | 2023 | 2022 | 2021 | 2020 | 2019 | 2018 | 2017 | 2016 | 2015 | 2014 |
|---|---|---|---|---|---|---|---|---|---|---|---|---|---|
| Cash & Equivalents | $3.00B | $2.64B | $1.01B | $882M | $1.09B | $928M | $705M | $533M | $688M | $465M | $617M | $932M | |
| Short-term Investments | $154M | $141M | $130M | $4M | · | · | · | · | $4M | $3M | $94M | $90M | |
| Receivables | $945M | $680M | $489M | $487M | $338M | $338M | $305M | $297M | $190M | $157M | $165M | $122M | |
| Inventory | $304M | $258M | $182M | $128M | $116M | $76M | $56M | $28M | $33M | $39M | $57M | $56M | |
| Prepaid Expense | $420M | $434M | $297M | $210M | $174M | $136M | $104M | $93M | $68M | $37M | $31M | $126M | |
| Current Assets | $4.67B | $4.02B | $1.98B | $1.71B | $1.72B | $1.48B | $1.17B | $951M | $980M | $702M | $964M | $1.85B | |
| PP&E (Net) | $517M | $458M | $403M | $371M | $306M | $311M | $276M | $253M | $251M | $239M | $229M | $230M | |
| PP&E (Gross) | $1.54B | $1.37B | $1.24B | $1.15B | $1.04B | $1.01B | $911M | $951M | $910M | $852M | $810M | $783M | |
| Accum. Depreciation | $1.02B | $917M | $837M | $777M | $733M | $694M | $635M | $698M | $658M | $613M | $581M | $553M | |
| Goodwill | $2.75B | $2.38B | $1.54B | $1.37B | $928M | $782M | $662M | $662M | $666M | $573M | $552M | $554M | |
| Intangibles | $718M | $595M | $337M | $355M | $233M | $211M | $172M | $225M | $279M | $259M | $296M | $361M | |
| Other Non-current Assets | $338M | $274M | $248M | $186M | $182M | $171M | $107M | $104M | $75M | $312M | $300M | $209M | |
| Total Assets | $10.15B | $8.97B | $5.67B | $5.14B | $4.39B | $3.95B | $3.36B | $2.47B | $2.42B | $2.10B | $2.35B | $3.21B | |
| Accounts Payable | $857M | $633M | $577M | $557M | $417M | $350M | $317M | $257M | $5M | $4M | $25M | $12M | |
| Current Liabilities | $1.64B | $1.37B | $1.59B | $1.35B | $971M | $797M | $672M | $709M | $642M | $586M | $536M | $1.39B | |
| Capital Leases | $136M | $109M | $115M | $139M | $107M | $114M | $85M | $0 | · | · | · | · | |
| Deferred Tax | $48M | · | · | · | · | · | · | · | · | · | · | · | |
| Other Non-current Liabilities | $408M | $339M | $276M | $305M | $226M | $207M | $163M | $77M | $81M | $59M | $60M | $79M | |
| Retained Earnings | $7.10B | $5.99B | $4.94B | $3.90B | $3.05B | $2.35B | $1.76B | $773M | $341M | $137M | $-74M | $-326M | |
| Treasury Stock | $6.34B | $5.31B | $4.60B | $3.82B | $2.74B | $2.06B | $1.67B | $1.40B | $1.18B | $1.19B | $401M | $204M | |
| AOCI | $-2M | $-190M | $-95M | $-92M | $-33M | $-17M | $-37M | $-25M | $-4M | $-25M | $-12M | $12M | |
| Stockholders' Equity | $5.47B | $4.67B | $3.40B | $2.75B | $2.74B | $2.49B | $2.10B | $1.29B | $989M | $742M | $1.38B | $1.33B | |
| Liabilities + Equity | $10.15B | $8.97B | $5.67B | $5.14B | $4.39B | $3.95B | $3.36B | $2.47B | $2.42B | $2.10B | $2.35B | $3.21B | |
| Shares Outstanding | 271,799,000 | 273,851,000 | 271,706,000 | 272,675,000 | 276,796,000 | 278,941,000 | 279,855,000 | 280,015,000 | 282,067,000 | 278,099,000 | 309,392,000 | 291,584,000 |
Arus Kas
| Metrik | Tren | 2025 | 2024 | 2023 | 2022 | 2021 | 2020 | 2019 | 2018 | 2017 | 2016 | 2015 | 2014 |
|---|---|---|---|---|---|---|---|---|---|---|---|---|---|
| D&A | $228M | $197M | $145M | $132M | $142M | $146M | $123M | $119M | $116M | $120M | $118M | $116M | |
| Stock-based Comp | $455M | $391M | $326M | $270M | $210M | $197M | $182M | $168M | $130M | $109M | $92M | $84M | |
| Deferred Tax | $66M | $-129M | $-37M | $-108M | $-43M | $-26M | $-577M | $-12M | $80M | $-5M | $-13M | $12M | |
| Amort. of Intangibles | $40M | $30M | $18M | $18M | $20M | $18M | $12M | $14M | $15M | $18M | $24M | $24M | |
| Restructuring | $29M | $24M | $11M | $55.0K | $-1M | $9M | $9M | $11M | $9M | $41M | $5M | $10M | |
| Other Non-cash | $-129M | $-254M | $-126M | $98M | $96M | $-3M | $13M | $-16M | $-59M | $18M | $-72M | · | |
| Operating Cash Flow | $1.73B | $1.26B | $1.35B | $1.24B | $1.10B | $905M | $730M | $605M | $471M | $445M | $378M | $317M | |
| CapEx | $142M | $143M | $102M | $123M | $65M | $95M | $75M | $62M | $58M | $54M | $45M | $40M | |
| Investing Cash Flow | $-461M | $-837M | $-412M | $-739M | $-293M | $-292M | $-106M | $-174M | $-191M | $1M | $-45M | $-198M | |
| Stock Issued | $146M | $204M | $133M | $105M | $88M | $75M | $53M | $41M | $49M | $55M | $75M | $66M | |
| Stock Repurchased | $925M | $550M | $700M | $1.05B | $612M | $380M | $306M | $250M | $100M | $960M | $333M | $100M | |
| Net Stock Activity | $-779M | $-346M | $-567M | $-945M | $-525M | $-305M | $-253M | $-209M | $-51M | $-905M | $-258M | · | |
| Financing Cash Flow | $-949M | $1.24B | $-804M | $-657M | $-644M | $-415M | $-444M | $-568M | $-70M | $-593M | $-626M | $289M | |
| Net Change in Cash | $357M | $1.64B | $126M | $-207M | $161M | $223M | $172M | $-155M | $223M | $-151M | $-315M | $396M | |
| Taxes Paid | $247M | $510M | $254M | $233M | $146M | $106M | $42M | $68M | $59M | $37M | $29M | $26M | |
| Free Cash Flow | $1.59B | $1.12B | $1.25B | $1.12B | $1.04B | $810M | $655M | $543M | $413M | $391M | $333M | · | |
| Levered FCF | $1.50B | $1.06B | $1.22B | $1.10B | $1.02B | $791M | $616M | $522M | $396M | $371M | $307M | · |
Profitabilitas
| Metrik | Tren | 2025 | 2024 | 2023 | 2022 | 2021 | 2020 | 2019 | 2018 | 2017 | 2016 | 2015 | 2014 |
|---|---|---|---|---|---|---|---|---|---|---|---|---|---|
| Operating Margin | 28.2% | 29.1% | 30.6% | 30.1% | 26.1% | 24.1% | 21.1% | 18.5% | 16.7% | 13.5% | 16.8% | · | |
| Net Margin | 20.9% | 22.7% | 25.5% | 23.8% | 23.3% | 22.0% | 42.3% | 16.2% | 10.5% | 11.2% | 14.8% | · | |
| Pretax Margin | 28.7% | 30.1% | 31.3% | 29.3% | 25.7% | 23.6% | 20.5% | 17.6% | 16.2% | 13.1% | 15.7% | · | |
| EBITDA Margin | 32.5% | 33.4% | 34.1% | 33.9% | 30.8% | 29.5% | 26.3% | 24.1% | 22.6% | 20.1% | 23.7% | · | |
| ROA | 11.6% | 14.4% | 19.3% | 17.8% | 16.7% | 16.2% | 34.0% | 14.1% | 9.0% | 9.1% | 9.1% | · | |
| ROE | 21.2% | 22.9% | 31.9% | 31.1% | 25.9% | 24.2% | 55.2% | 27.2% | 23.6% | 19.2% | 18.6% | · | |
| ROIC | 19.9% | 21.9% | 29.8% | 31.8% | 25.8% | 24.2% | 48.3% | 28.2% | 21.2% | 28.3% | 19.6% | · |
Likuiditas & Solvabilitas
| Metrik | Tren | 2025 | 2024 | 2023 | 2022 | 2021 | 2020 | 2019 | 2018 | 2017 | 2016 | 2015 | 2014 |
|---|---|---|---|---|---|---|---|---|---|---|---|---|---|
| Current Ratio | 2.9 | 2.9 | 1.2 | 1.3 | 1.8 | 1.9 | 1.7 | 1.3 | 1.5 | 1.2 | 1.8 | · | |
| Quick Ratio | 2.5 | 2.5 | 1.0 | 1.0 | 1.5 | 1.6 | 1.5 | 1.2 | 1.4 | 1.1 | 1.6 | · | |
| Interest Coverage | 12.8 | 17.8 | 34.6 | 46.8 | 45.9 | 31.1 | 26.1 | 17.1 | 12.6 | 10.3 | 10.1 | · |
Efisiensi
| Metrik | Tren | 2025 | 2024 | 2023 | 2022 | 2021 | 2020 | 2019 | 2018 | 2017 | 2016 | 2015 | 2014 |
|---|---|---|---|---|---|---|---|---|---|---|---|---|---|
| Asset Turnover | 0.6 | 0.6 | 0.8 | 0.7 | 0.7 | 0.7 | 0.8 | 0.9 | 0.9 | 0.8 | 0.6 | · | |
| Receivables Turnover | 6.5 | 7.9 | 8.4 | 8.6 | 8.8 | 8.3 | 7.8 | 8.8 | 11.2 | 11.3 | 11.8 | · |
Per Saham
| Metrik | Tren | 2025 | 2024 | 2023 | 2022 | 2021 | 2020 | 2019 | 2018 | 2017 | 2016 | 2015 | 2014 |
|---|---|---|---|---|---|---|---|---|---|---|---|---|---|
| Book Value / Share | $20.14 | $17.07 | $12.53 | $10.07 | $9.90 | $8.94 | $7.51 | $4.60 | $3.51 | $2.67 | $4.45 | · | |
| Revenue / Share | $19.38 | $16.95 | $15.00 | $12.95 | $10.72 | $9.59 | $8.33 | $7.60 | $6.93 | $6.24 | $5.45 | · | |
| Cash Flow / Share | $6.33 | $4.60 | $4.95 | $4.52 | $3.95 | $3.24 | $2.60 | $2.15 | $1.68 | $1.53 | $1.21 | · | |
| Cash / Share | $11.04 | $9.65 | $3.71 | $3.24 | $3.93 | $3.33 | $2.52 | $1.90 | $2.44 | $1.67 | $1.99 | · | |
| EPS (TTM) | $4.06 | $3.85 | $3.82 | $3.09 | $2.50 | $2.11 | $3.53 | $1.23 | $0.73 | $0.70 | $0.81 | $0.52 |
Tingkat Pertumbuhan
| Metrik | Tren | 2025 | 2024 | 2023 | 2022 | 2021 | 2020 | 2019 | 2018 | 2017 | 2016 | 2015 | 2014 |
|---|---|---|---|---|---|---|---|---|---|---|---|---|---|
| Revenue YoY | 14.1% | 13.5% | 14.8% | 19.2% | 11.4% | · | · | · | · | · | · | · | |
| Revenue CAGR 3Y | 14.1% | 15.8% | 15.1% | · | · | · | · | · | · | · | · | · | |
| Revenue CAGR 5Y | 14.6% | · | · | · | · | · | · | · | · | · | · | · | |
| EPS YoY | 5.5% | 0.79% | 23.6% | 23.6% | 18.5% | · | · | · | · | · | · | · | |
| EPS CAGR 3Y | 9.5% | 15.5% | 21.9% | · | · | · | · | · | · | · | · | · | |
| EPS CAGR 5Y | 14.0% | · | · | · | · | · | · | · | · | · | · | · | |
| Net Income YoY | 5.1% | 1.4% | 22.6% | 22.0% | 17.8% | · | · | · | · | · | · | · | |
| Net Income CAGR 3Y | 9.3% | 14.9% | 20.8% | · | · | · | · | · | · | · | · | · | |
| Net Income CAGR 5Y | 13.4% | · | · | · | · | · | · | · | · | · | · | · |
Valuasi (TTM)
| Metrik | Tren | 2025 | 2024 | 2023 | 2022 | 2021 | 2020 | 2019 | 2018 | 2017 | 2016 | 2015 | 2014 |
|---|---|---|---|---|---|---|---|---|---|---|---|---|---|
| Revenue TTM | $5.30B | $4.64B | $4.09B | $3.56B | $2.99B | $2.68B | $2.34B | $2.14B | $1.94B | $1.82B | $1.70B | $1.58B | |
| Net Income TTM | $1.11B | $1.06B | $1.04B | $849M | $696M | $591M | $989M | $346M | $204M | $203M | $252M | $159M | |
| Market Cap | $84.96B | $82.28B | $74.00B | $43.80B | $51.58B | $38.06B | $19.67B | $12.14B | $11.80B | $7.01B | $6.44B | · | |
| P/E | 77.0 | 78.0 | 71.3 | 52.0 | 74.5 | 64.7 | 19.9 | 35.2 | 57.3 | 36.0 | 25.7 | 36.2 | |
| P/S | 16.0 | 17.7 | 18.1 | 12.3 | 17.3 | 14.2 | 8.4 | 5.7 | 6.1 | 3.9 | 3.8 | · | |
| P/B | 15.5 | 17.6 | 21.7 | 16.0 | 18.8 | 15.3 | 9.4 | 9.4 | 11.9 | 9.5 | 4.7 | · | |
| P / Tangible Book | 42.3 | 48.4 | 48.3 | 43.1 | 32.7 | 25.4 | · | · | · | · | · | · | |
| P / Cash Flow | 49.1 | 65.3 | 54.9 | 35.3 | 46.9 | 42.1 | 27.0 | 20.1 | 25.1 | 15.8 | 17.0 | · | |
| P / FCF | 53.5 | 73.6 | 59.4 | 39.2 | 49.8 | 47.0 | 30.0 | 22.3 | 28.6 | 17.9 | 19.3 | · | |
| Earnings Yield | 1.3% | 1.3% | 1.4% | 1.9% | 1.3% | 1.6% | 5.0% | 2.8% | 1.8% | 2.8% | 3.9% | 2.8% |
Laporan Laba Rugi
| Metrik | Tren | Q2 2026 | Q1 2026 | Q4 2025 | Q3 2025 | Q2 2025 | Q1 2025 | Q4 2024 | Q3 2024 | Q2 2024 | Q1 2024 | Q4 2023 | Q3 2023 | Q2 2023 | Q1 2023 | Q4 2022 |
|---|---|---|---|---|---|---|---|---|---|---|---|---|---|---|---|---|
| Revenue | $1.58B | $1.47B | $1.44B | $1.34B | $1.28B | $1.24B | $1.36B | $1.22B | $1.06B | $1.01B | $1.07B | $1.02B | $977M | $1.02B | $1.07B | |
| R&D Expense | $531M | $508M | · | $423M | $442M | $439M | · | $407M | $371M | $379M | · | $370M | $354M | $350M | · | |
| SG&A Expense | $89M | $88M | $103M | $78M | $69M | $63M | $70M | $72M | $63M | $69M | $76M | $59M | $55M | $54M | $102M | |
| Operating Expenses | $1.13B | $1.04B | $977M | $913M | $1.03B | $881M | $899M | $865M | $767M | $759M | $732M | $730M | $677M | $699M | $798M | |
| Operating Income | $450M | $431M | $463M | $425M | $242M | $362M | $457M | $350M | $294M | $250M | $337M | $293M | $299M | $322M | $268M | |
| Interest Expense | $35M | $32M | $29M | $29M | $29M | $29M | $30M | $24M | $13M | $9M | $9M | $9M | $9M | $9M | $10M | |
| Interest Income | $10M | $18M | $25M | $25M | $26M | $26M | $27M | $17M | $9M | $10M | $7M | $8M | $7M | $6M | · | |
| Other Non-op | $886.0K | $28M | $59M | $-4M | $-271.0K | $23M | $10M | $8M | $35M | $69M | $35M | $16M | $8M | $8M | $3M | |
| Pretax Income | $510M | $428M | $493M | $393M | $281M | $356M | $437M | $333M | $316M | $310M | $362M | $300M | $298M | $321M | $260M | |
| Income Tax | $143M | $92M | $105M | $106M | $121M | $82M | $96M | $95M | $86M | $62M | $38M | $46M | $77M | $80M | $21M | |
| Net Income | $367M | $336M | $388M | $287M | $160M | $274M | $340M | $238M | $230M | $248M | $324M | $254M | $221M | $242M | $240M | |
| EPS (Basic) | $1.34 | $1.23 | $1.43 | $1.06 | $0.59 | $1.01 | $1.25 | $0.87 | $0.85 | $0.92 | $1.20 | $0.94 | $0.82 | $0.90 | $0.90 | |
| EPS (Diluted) | $1.33 | $1.23 | $1.42 | $1.05 | $0.59 | $1.00 | $1.23 | $0.87 | $0.84 | $0.91 | $1.19 | $0.93 | $0.81 | $0.89 | $0.89 | |
| Shares (Basic) | 273,955,000 | 272,061,000 | · | 271,152,000 | 271,294,000 | 271,973,000 | · | 272,244,000 | 270,912,000 | 269,606,000 | · | 269,229,000 | 269,714,000 | 269,501,000 | · | |
| Shares (Diluted) | 276,163,000 | 273,725,000 | · | 273,798,000 | 272,899,000 | 273,631,000 | · | 273,958,000 | 273,520,000 | 273,544,000 | · | 272,427,000 | 272,996,000 | 273,159,000 | · | |
| EBITDA | $450M | $516M | · | $425M | $242M | $414M | · | $350M | $294M | $290M | · | $293M | $299M | $357M | · |
Neraca
| Metrik | Tren | Q2 2026 | Q1 2026 | Q4 2025 | Q3 2025 | Q2 2025 | Q1 2025 | Q4 2024 | Q3 2024 | Q2 2024 | Q1 2024 | Q4 2023 | Q3 2023 | Q2 2023 | Q1 2023 | Q4 2022 |
|---|---|---|---|---|---|---|---|---|---|---|---|---|---|---|---|---|
| Cash & Equivalents | $1.44B | $1.41B | $3.00B | $2.75B | $2.82B | $2.78B | $2.64B | $2.79B | $1.06B | $1.01B | · | $962M | $874M | $917M | · | |
| Short-term Investments | · | · | $154M | · | · | · | $141M | · | · | · | · | · | · | · | · | |
| Receivables | $1.07B | $1.03B | $945M | $755M | $670M | $581M | $680M | $561M | $565M | $390M | · | $427M | $441M | $488M | · | |
| Inventory | $390M | $318M | $304M | $286M | $226M | $226M | $258M | $293M | $172M | $186M | · | $164M | $140M | $128M | · | |
| Prepaid Expense | $326M | $422M | $420M | $492M | $503M | $414M | $434M | $460M | $401M | $342M | · | $272M | $189M | $166M | · | |
| Current Assets | $3.22B | $3.18B | $4.67B | $4.29B | $4.22B | $4.00B | $4.02B | $4.10B | $2.20B | $1.93B | · | $1.82B | $1.64B | $1.70B | · | |
| PP&E (Net) | $560M | $537M | $517M | $495M | $482M | $466M | $458M | $449M | $449M | $433M | · | $380M | $370M | $373M | · | |
| PP&E (Gross) | · | · | $1.54B | · | · | · | $1.37B | · | · | · | · | · | · | · | · | |
| Accum. Depreciation | · | · | $1.02B | · | · | · | $917M | · | · | · | · | · | · | · | · | |
| Goodwill | $4.91B | $4.93B | $2.75B | $2.64B | $2.60B | $2.42B | $2.38B | $2.49B | $2.42B | $1.58B | $1.54B | $1.50B | $1.43B | $1.38B | $1.37B | |
| Intangibles | $1.87B | $1.93B | $718M | $673M | $619M | $584M | $595M | $662M | $664M | $335M | · | $348M | $341M | $342M | · | |
| Other Non-current Assets | · | · | $338M | · | · | · | $274M | · | · | · | · | · | · | · | · | |
| Total Assets | $12.08B | $12.10B | $10.15B | $9.60B | $9.51B | $9.01B | $8.97B | $9.17B | $7.23B | $5.72B | · | $5.43B | $5.16B | $5.17B | · | |
| Accounts Payable | $824M | $864M | $857M | $631M | $767M | $570M | $633M | $627M | $505M | $457M | · | $598M | $510M | $430M | · | |
| Current Liabilities | $1.85B | $2.16B | $1.64B | $1.41B | $1.50B | $1.30B | $1.37B | $1.67B | $1.53B | $1.47B | · | $1.26B | $1.20B | $1.18B | · | |
| Capital Leases | $169M | $177M | $136M | · | · | · | $109M | · | · | · | · | · | · | · | · | |
| Deferred Tax | $350M | $351M | · | · | · | · | · | · | · | · | · | · | · | · | · | |
| Other Non-current Liabilities | $747M | $747M | $408M | $385M | $373M | $349M | $339M | $351M | $343M | $302M | · | $304M | $305M | $299M | · | |
| Retained Earnings | $7.80B | $7.44B | $7.10B | $6.71B | $6.43B | $6.27B | $5.99B | $5.65B | $5.41B | $5.18B | · | $4.61B | $4.36B | $4.14B | · | |
| Treasury Stock | $6.76B | $6.54B | $6.34B | $6.13B | $5.89B | $5.69B | $5.31B | $5.14B | $4.97B | $4.84B | · | $4.46B | $4.26B | $3.99B | · | |
| AOCI | $-56M | $-40M | $-2M | $7M | $24M | $-123M | $-190M | $-14M | $-109M | $-108M | · | $-113M | $-91M | $-87M | · | |
| Stockholders' Equity | $6.86B | $6.56B | $5.47B | $5.20B | $5.01B | $4.78B | $4.67B | $4.56B | $4.26B | $3.57B | $3.40B | $3.11B | $2.91B | $2.94B | $2.75B | |
| Liabilities + Equity | $12.08B | $12.10B | $10.15B | $9.60B | $9.51B | $9.01B | $8.97B | $9.17B | $7.23B | $5.72B | · | $5.43B | $5.16B | $5.17B | · | |
| Shares Outstanding | 275,393,000 | 275,816,000 | 271,799,000 | 272,201,000 | 272,490,000 | 273,042,000 | 273,851,000 | 274,263,000 | 273,820,000 | 272,134,000 | 271,706,000 | 272,062,000 | 271,790,000 | 272,684,000 | 272,675,000 |
Arus Kas
| Metrik | Tren | Q2 2026 | Q1 2026 | Q4 2025 | Q3 2025 | Q2 2025 | Q1 2025 | Q4 2024 | Q3 2024 | Q2 2024 | Q1 2024 | Q4 2023 | Q3 2023 | Q2 2023 | Q1 2023 | Q4 2022 |
|---|---|---|---|---|---|---|---|---|---|---|---|---|---|---|---|---|
| D&A | $117M | $85M | $65M | $57M | $54M | $53M | $55M | $55M | $48M | $40M | $39M | $36M | $36M | $34M | $34M | |
| Stock-based Comp | $147M | $138M | $113M | $116M | $118M | $108M | $107M | $109M | $88M | $88M | $87M | $88M | $77M | $74M | $94M | |
| Deferred Tax | $3M | $73M | $-24M | $87M | $5M | $-2M | $-124M | $4M | $-8M | $-2M | $-13M | $-3M | $-9M | $-12M | $-58M | |
| Amort. of Intangibles | $34M | $20M | $12M | $10M | $9M | $9M | $9M | $9M | $7M | $5M | $5M | $5M | $4M | $4M | $4M | |
| Restructuring | $-352.0K | $-5.0K | $2M | $27M | $47.0K | $-109.0K | $-1M | $25M | $-33.0K | $280.0K | $-569.0K | $12M | $0 | $0 | $304.0K | |
| Other Non-cash | · | $-276M | · | · | · | $55M | · | · | · | $-121M | · | · | · | $-71M | · | |
| Operating Cash Flow | $635M | $356M | $553M | $311M | $378M | $487M | $441M | $410M | $156M | $253M | $272M | $396M | $414M | $267M | $264M | |
| CapEx | $53M | $49M | $41M | $34M | $44M | $23M | $37M | $27M | $29M | $50M | $34M | $22M | $20M | $27M | $37M | |
| Investing Cash Flow | $26M | $-2.11B | $-89M | $-174M | $-176M | $-22M | $-40M | $-39M | $-678M | $-80M | $-99M | $-184M | $-94M | $-36M | $-64M | |
| Stock Issued | $16M | $73M | $8M | $60M | $2M | $77M | $10M | $61M | $17M | $117M | $2M | $54M | $12M | $65M | $2M | |
| Stock Repurchased | $200M | $200M | $200M | $200M | $175M | $350M | $150M | $150M | $125M | $125M | $125M | $125M | $325M | $125M | $300M | |
| Net Stock Activity | · | $-127M | · | · | · | $-273M | · | · | · | $-8M | · | · | · | $-60M | · | |
| Financing Cash Flow | $-626M | $175M | $-214M | $-194M | $-195M | $-346M | $-511M | $1.33B | $575M | $-159M | $-138M | $-114M | $-354M | $-197M | $-357M | |
| Net Change in Cash | $34M | $-1.59B | $248M | $-70M | $45M | $134M | $-142M | $1.73B | $47M | $4M | $46M | $88M | $-43M | $35M | $-144M | |
| Taxes Paid | $299M | $35M | $49M | $44M | $125M | $30M | $214M | $99M | $174M | $24M | $149M | $43M | $42M | $20M | $85M | |
| Free Cash Flow | · | $307M | · | · | · | $464M | · | · | · | $204M | · | · | · | $241M | · | |
| Levered FCF | · | $282M | · | · | · | $442M | · | · | · | $197M | · | · | · | $234M | · |
Profitabilitas
| Metrik | Tren | Q2 2026 | Q1 2026 | Q4 2025 | Q3 2025 | Q2 2025 | Q1 2025 | Q4 2024 | Q3 2024 | Q2 2024 | Q1 2024 | Q4 2023 | Q3 2023 | Q2 2023 | Q1 2023 | Q4 2022 |
|---|---|---|---|---|---|---|---|---|---|---|---|---|---|---|---|---|
| Operating Margin | 28.4% | 29.3% | · | 31.8% | 19.0% | 29.1% | · | 28.8% | 27.7% | 24.8% | · | 28.6% | 30.6% | 31.6% | · | |
| Net Margin | 23.2% | 22.8% | · | 21.4% | 12.6% | 22.0% | · | 19.6% | 21.6% | 24.5% | · | 24.9% | 22.6% | 23.7% | · | |
| Pretax Margin | 32.2% | 29.0% | · | 29.3% | 22.0% | 28.6% | · | 27.4% | 29.8% | 30.7% | · | 29.3% | 30.6% | 31.5% | · | |
| EBITDA Margin | 28.4% | 35.0% | · | 31.8% | 19.0% | 33.4% | · | 28.8% | 27.7% | 28.7% | · | 28.6% | 30.6% | 34.9% | · | |
| ROA | 3.4% | 3.2% | · | 3.1% | 1.9% | 3.7% | · | 3.3% | 3.7% | 4.5% | · | 4.9% | 4.7% | 5.1% | · | |
| ROE | 6.2% | 5.9% | · | 5.9% | 3.5% | 6.6% | · | 6.2% | 6.4% | 7.6% | · | 8.7% | 8.0% | 8.5% | · | |
| ROIC | 4.7% | 5.1% | · | 6.0% | 2.8% | 5.8% | · | 5.5% | 5.0% | 5.6% | · | 8.0% | 7.6% | 8.2% | · |
Likuiditas & Solvabilitas
| Metrik | Tren | Q2 2026 | Q1 2026 | Q4 2025 | Q3 2025 | Q2 2025 | Q1 2025 | Q4 2024 | Q3 2024 | Q2 2024 | Q1 2024 | Q4 2023 | Q3 2023 | Q2 2023 | Q1 2023 | Q4 2022 |
|---|---|---|---|---|---|---|---|---|---|---|---|---|---|---|---|---|
| Current Ratio | 1.7 | 1.5 | · | 3.0 | 2.8 | 3.1 | · | 2.4 | 1.4 | 1.3 | · | 1.4 | 1.4 | 1.4 | · | |
| Quick Ratio | 1.4 | 1.1 | · | 2.5 | 2.3 | 2.6 | · | 2.0 | 1.1 | 1.0 | · | 1.1 | 1.1 | 1.2 | · | |
| Interest Coverage | 12.8 | 13.6 | · | 14.7 | 8.4 | 12.4 | · | 14.3 | 22.8 | 28.8 | · | 32.3 | 33.7 | 34.8 | · |
Efisiensi
| Metrik | Tren | Q2 2026 | Q1 2026 | Q4 2025 | Q3 2025 | Q2 2025 | Q1 2025 | Q4 2024 | Q3 2024 | Q2 2024 | Q1 2024 | Q4 2023 | Q3 2023 | Q2 2023 | Q1 2023 | Q4 2022 |
|---|---|---|---|---|---|---|---|---|---|---|---|---|---|---|---|---|
| Asset Turnover | 0.1 | 0.1 | · | 0.1 | 0.2 | 0.2 | · | 0.2 | 0.2 | 0.2 | · | 0.2 | 0.2 | 0.2 | · | |
| Receivables Turnover | 1.8 | 1.8 | · | 2.0 | 2.1 | 2.6 | · | 2.5 | 2.1 | 2.3 | · | 2.5 | 2.3 | 2.4 | · |
Per Saham
| Metrik | Tren | Q2 2026 | Q1 2026 | Q4 2025 | Q3 2025 | Q2 2025 | Q1 2025 | Q4 2024 | Q3 2024 | Q2 2024 | Q1 2024 | Q4 2023 | Q3 2023 | Q2 2023 | Q1 2023 | Q4 2022 |
|---|---|---|---|---|---|---|---|---|---|---|---|---|---|---|---|---|
| Book Value / Share | $24.90 | $23.79 | · | $19.10 | $18.37 | $17.49 | · | $16.64 | $15.56 | $13.11 | · | $11.45 | $10.70 | $10.78 | · | |
| Revenue / Share | $5.74 | $5.39 | · | $4.89 | $4.67 | $4.54 | · | $4.44 | $3.88 | $3.69 | · | $3.76 | $3.58 | $3.74 | · | |
| Cash Flow / Share | · | $1.30 | · | · | · | $1.78 | · | · | · | $0.93 | · | · | · | $0.98 | · | |
| Cash / Share | $5.23 | $5.10 | · | $10.11 | $10.36 | $10.17 | · | $10.16 | $3.87 | $3.72 | · | $3.54 | $3.22 | $3.36 | · | |
| EPS (TTM) | $5.03 | $4.29 | · | $3.87 | $3.69 | $3.94 | · | $3.81 | $3.87 | $3.84 | · | $3.52 | $3.27 | $3.14 | · |
Valuasi (TTM)
| Metrik | Tren | Q2 2026 | Q1 2026 | Q4 2025 | Q3 2025 | Q2 2025 | Q1 2025 | Q4 2024 | Q3 2024 | Q2 2024 | Q1 2024 | Q4 2023 | Q3 2023 | Q2 2023 | Q1 2023 | Q4 2022 |
|---|---|---|---|---|---|---|---|---|---|---|---|---|---|---|---|---|
| Revenue TTM | $5.84B | $5.53B | · | $5.21B | $5.09B | $4.87B | · | $4.35B | $4.16B | $4.08B | · | $4.09B | $3.97B | $3.85B | · | |
| Net Income TTM | $1.38B | $1.17B | · | $1.06B | $1.01B | $1.08B | · | $1.04B | $1.06B | $1.05B | · | $957M | $889M | $855M | · | |
| Market Cap | $103.36B | $76.64B | · | $95.61B | $83.97B | $69.44B | · | $74.33B | $84.27B | $84.71B | · | $63.74B | $63.74B | $57.29B | · | |
| P/E | 74.6 | 64.8 | · | 90.8 | 83.5 | 64.6 | · | 71.1 | 79.5 | 81.1 | · | 66.6 | 71.7 | 66.9 | · | |
| P/S | 17.7 | 13.9 | · | 18.3 | 16.5 | 14.2 | · | 17.1 | 20.2 | 20.8 | · | 15.6 | 16.1 | 14.9 | · | |
| P/B | 15.1 | 11.7 | · | 18.4 | 16.8 | 14.5 | · | 16.3 | 19.8 | 23.7 | · | 20.5 | 21.9 | 19.5 | · | |
| P / Tangible Book | 1504.1 | · | · | 50.8 | 47.0 | 39.2 | · | 52.8 | 71.5 | 51.1 | · | 50.4 | 56.0 | 46.9 | · | |
| P / Cash Flow | · | 215.4 | · | · | · | 142.6 | · | · | · | 334.5 | · | · | · | 214.2 | · | |
| Earnings Yield | 1.3% | 1.5% | · | 1.1% | 1.2% | 1.6% | · | 1.4% | 1.3% | 1.2% | · | 1.5% | 1.4% | 1.5% | · |
Periode terbaru di sebelah kiri · nilai null ditampilkan sebagai ·
Laporan Keuangan Laporan laba rugi, neraca, arus kas — tahunan, 5 tahun terakhir
| Metrik | 2025-12-31 | 2024-12-31 | 2023-12-31 | 2022-12-31 | 2022-01-01 |
|---|---|---|---|---|---|
| Pendapatan | $5.30B | $4.64B | $4.09B | $3.56B | $2.99B |
| Margin Operasi % | 28.2% | 29.1% | 30.6% | 30.1% | 26.1% |
| Laba Bersih | $1.11B | $1.06B | $1.04B | $849M | $696M |
| EPS Dilusian | $4.06 | $3.85 | $3.82 | $3.09 | $2.50 |
| Metrik | 2025-12-31 | 2024-12-31 | 2023-12-31 | 2022-12-31 | 2022-01-01 |
|---|---|---|---|---|---|
| Rasio Lancar | 2.9 | 2.9 | 1.2 | 1.3 | 1.8 |
| Rasio Cepat | 2.5 | 2.5 | 1.0 | 1.0 | 1.5 |
| Metrik | 2025-12-31 | 2024-12-31 | 2023-12-31 | 2022-12-31 | 2022-01-01 |
|---|---|---|---|---|---|
| Arus Kas Bebas | $1.59B | $1.12B | $1.25B | $1.12B | $1.04B |
Pemilik institusional (13F) 1.647 pengaju · $101.8B total · Per tanggal 30 Sep. 2026
Institusi yang melaporkan kepemilikan saham ini dalam SEC Form 13F triwulanan mereka. Hanya posisi panjang; satu pengaju dapat muncul dua kali untuk leg opsi terpisah. Kaki put/call offset yang besar biasanya mencerminkan pembuatan pasar atau inventaris yang dilindungi, bukan keyakinan arah.
| Posisi baru | Posisi yang keluar | Meningkat | Menurun | Perubahan bersih saham |
|---|---|---|---|---|
| 228 (+41 vs Kuartal sebelumnya) | 94 (-65 vs Kuartal sebelumnya) | 629 (+85 vs Kuartal sebelumnya) | 539 (-25 vs Kuartal sebelumnya) | +8.4M |
Dibandingkan dengan Q1 2026. Pengajuan Formulir 13F SEC jatuh tempo dalam waktu 45 hari setelah akhir kuartal ditambah kelonggaran singkat untuk pengaju terlambat — kuartal yang masih dalam jangka waktu tersebut dilewati demi pasangan terakhir yang dilaporkan sepenuhnya.
| Institusi | Nilai | Saham | % dari 13F yang dilacak | Tipe |
|---|---|---|---|---|
| BlackRock, Inc. | $10.006.348.574 | 26.660.845 | 9,83% | Saham |
| VANGUARD GROUP INC | $8.511.887.860 | 27.231.070 | 8,36% | Saham |
| VANGUARD CAPITAL MANAGEMENT LLC | $6.761.908.117 | 18.016.381 | 6,64% | Saham |
| STATE STREET CORP | $4.890.941.670 | 13.031.391 | 4,81% | Saham |
| FMR LLC | $3.586.162.444 | 9.554.947 | 3,52% | Saham |
| Invesco Ltd. | $3.370.568.036 | 8.980.518 | 3,31% | Saham |
| JPMORGAN CHASE & CO | $2.931.781.842 | 7.865.907 | 2,88% | Saham |
| GEODE CAPITAL MANAGEMENT, LLC | $2.693.305.833 | 7.184.139 | 2,65% | Saham |
| VANGUARD PORTFOLIO MANAGEMENT LLC | $2.612.930.174 | 6.961.873 | 2,57% | Saham |
| VAN ECK ASSOCIATES CORP | $1.835.226.599 | 4.889.765 | 1,80% | Saham |
| Capital International Investors | $1.833.889.335 | 4.886.202 | 1,80% | Saham |
| WELLINGTON MANAGEMENT GROUP LLP | $1.831.686.957 | 4.880.334 | 1,80% | Saham |
| JENNISON ASSOCIATES LLC | $1.690.088.763 | 4.503.061 | 1,66% | Saham |
| GOLDMAN SACHS GROUP INC | $1.592.701.346 | 4.243.582 | 1,56% | Saham |
| MORGAN STANLEY | $1.345.884.077 | 3.585.961 | 1,32% | Saham |
| ALLIANCEBERNSTEIN L.P. | $1.319.162.261 | 4.747.408 | 1,30% | Saham |
| NORGES BANK | $1.274.223.035 | 3.395.031 | 1,25% | Saham |
| PeakShares LLC | $1.132.340.000 | 3.017 | 1,11% | Saham |
| MASSACHUSETTS FINANCIAL SERVICES CO /MA/ | $1.107.681.297 | 2.921.983 | 1,09% | Saham |
| NORTHERN TRUST CORP | $1.071.057.816 | 2.853.719 | 1,05% | Saham |
| FRANKLIN RESOURCES INC | $1.058.680.948 | 2.820.743 | 1,04% | Saham |
| SCHRODER INVESTMENT MANAGEMENT GROUP | $932.948.687 | 2.485.742 | 0,92% | Saham |
| UBS AM, a distinct business unit of UBS ASSET MANAGEMENT AMERICAS LLC | $927.173.828 | 3.336.718 | 0,91% | Saham |
| AMERICAN CENTURY COMPANIES INC | $858.896.998 | 2.288.432 | 0,84% | Saham |
| CHARLES SCHWAB INVESTMENT MANAGEMENT INC | $823.054.240 | 2.192.940 | 0,81% | Saham |
| Swedbank AB | $812.595.573 | 2.165.074 | 0,80% | Saham |
| Nuveen, LLC | $782.988.878 | 2.086.191 | 0,77% | Saham |
| Amundi | $706.755.344 | 1.883.110 | 0,69% | Saham |
| Legal & General Group Plc | $702.614.801 | 1.872.042 | 0,69% | Saham |
| NOMURA HOLDINGS INC | $688.637.136 | 1.834.800 | 0,68% | Opsi jual |
| JANUS HENDERSON GROUP PLC | $638.675.874 | 2.298.483 | 0,63% | Saham |
| ALKEON CAPITAL MANAGEMENT LLC | $609.097.088 | 1.622.874 | 0,60% | Saham |
| JANE STREET GROUP, LLC | $607.943.336 | 1.619.800 | 0,60% | Opsi jual |
| Bank of New York Mellon Corp | $607.349.868 | 1.618.219 | 0,60% | Saham |
| VANGUARD FIDUCIARY TRUST CO | $594.891.583 | 1.585.025 | 0,58% | Saham |
| JANE STREET GROUP, LLC | $589.177.336 | 1.569.800 | 0,58% | Opsi beli |
| ARROWSTREET CAPITAL, LIMITED PARTNERSHIP | $545.109.138 | 1.452.385 | 0,54% | Saham |
| DEUTSCHE BANK AG\ | $532.338.500 | 1.418.359 | 0,52% | Saham |
| PRINCIPAL FINANCIAL GROUP INC | $500.863.493 | 1.334.480 | 0,49% | Saham |
| Pictet Asset Management Holding SA | $472.751.571 | 1.259.596 | 0,46% | Saham |
| UBS Group AG | $414.649.782 | 1.104.790 | 0,41% | Saham |
| BANK OF AMERICA CORP /DE/ | $410.332.835 | 1.093.288 | 0,40% | Saham |
| Sumitomo Mitsui Trust Group, Inc. | $391.956.059 | 1.044.325 | 0,39% | Saham |
| BARCLAYS PLC | $382.954.009 | 1.020.340 | 0,38% | Saham |
| VOYA INVESTMENT MANAGEMENT LLC | $368.615.251 | 983.147 | 0,36% | Saham |
| AXA Investment Managers S.A. | $329.463.263 | 937.947 | 0,32% | Saham |
| SUSQUEHANNA INTERNATIONAL GROUP, LLP | $321.574.176 | 856.800 | 0,32% | Opsi jual |
| LAZARD ASSET MANAGEMENT LLC | $316.355.352 | 842.895 | 0,31% | Saham |
| Mitsubishi UFJ Asset Management Co., Ltd. | $292.890.345 | 780.375 | 0,29% | Saham |
| Swiss National Bank | $292.276.697 | 778.740 | 0,29% | Saham |
Aktivis & pemilik 5%+ 1 saham
Investor yang mengajukan Jadwal 13D SEC — kepemilikan manfaat di atas 5% dengan niat untuk memengaruhi penerbit (kepemilikan aktivis, kampanye dewan, M&A). Setiap baris menunjukkan status terbaru yang diketahui dari posisi pengaju tersebut.
| Pengaju | Diajukan | Kepemilikan | Status | Tujuan | Pengajuan |
|---|---|---|---|---|---|
| CADENCE DESIGN SYSTEMS, INC., SCIOTO RIVER LTD. ×2 pengajuan | 24 Jan. 2005 | · | Pengajuan awal | · | SEC |
Purpose is an automated classification of the filer's own stated purpose (SEC Item 4) — not investment advice. "—" means no clear purpose was stated or the text could not be classified.
Orang dalam perusahaan 48 orang dalam · 21 pejabat · 19 direktur
| Orang Dalam | Peran | Aktivitas terakhir | Saham dimiliki | Beli 12m | Jual 12m | Bersih 12m |
|---|---|---|---|---|---|---|
| Anirudh Devgan | President and CEO | 17 Sep. 2026 F | 247.201 | 0 | 10 | $-58.664.236 |
| Michael J Fister | President, CEO | 8 Feb. 2008 F | 886.145 | 0 | 0 | $0 |
| John M Wall | Sr. VP & CFO | 17 Sep. 2026 F | 79.459 | 0 | 10 | $-17.254.491 |
| Geoffrey G Ribar | Sr. VP, CFO | 28 Agu 2017 M | 169.413 | 0 | 0 | $0 |
| William Porter | EVP, Chief Financial Officer | 8 Feb. 2008 F | 439.150 | 0 | 0 | $0 |
| Paul Cunningham | Sr. Vice President | 15 Okt. 2026 M | 119.612 | 0 | 12 | $-5.577.010 |
| Scannell Paul | Sr. Vice President | 17 Sep. 2026 F | 30.783 | 0 | 7 | $-9.046.313 |
| Chin-Chi Teng | Sr. Vice President | 17 Sep. 2026 F | 136.075 | 0 | 36 | $-12.323.778 |
| Marc Taxay | SVP & General Counsel | 15 Mei 2026 F | 22.599 | 0 | 0 | $0 |
| Karna Nisewaner | SVP & General Counsel | 17 Maret 2025 F | 23.941 | 0 | 0 | $0 |
| Thomas P Beckley | Sr. Vice President | 16 Sep. 2024 F | 142.721 | 0 | 0 | $0 |
| Aneel Zaman | Sr. Vice President | 15 Maret 2024 A | 24.499 | 0 | 0 | $0 |
| Alinka Flaminia | Sr. VP, Chief Legal Officer | 19 Sep. 2022 F | 22.720 | 0 | 0 | $0 |
| James J Cowie | Sr. VP, General Counsel | 23 April 2020 M | 78.724 | 0 | 0 | $0 |
| Chi-Ping Hsu | Sr. Vice President | 9 Agu 2016 F | 241.869 | 0 | 0 | $0 |
| Pieter Vorenkamp | Sr. Vice President | 15 Mei 2016 A | 260.000 | 0 | 0 | $0 |
| Charlie X. Huang | Executive Vice President | 16 Okt. 2015 M | 202.238 | 0 | 0 | $0 |
| Martin Lund | Sr. Vice President | 4 Agu 2015 F | 105.084 | 0 | 0 | $0 |
| R L Smith Mckeithen | Sr. VP, General Counsel & Sec. | 11 Feb. 2008 S | 114.352 | 0 | 0 | $0 |
| Kevin Bushby | Exec VP - WW Field Operations | 8 Feb. 2008 F | 285.627 | 0 | 0 | $0 |
| Raymond H Bingham | Executive Chairman | 8 Juni 2005 S | 389.235 | 0 | 0 | $0 |
| Vincentelli Alberto Sangiovanni | Direktur | 1 Okt. 2026 S | 39.544 | 0 | 6 | $-838.680 |
| Ita M Brennan | Direktur | 10 Sep. 2026 S | 7.824 | 0 | 32 | $-234.986 |
| Young Sohn | Direktur | 30 Juli 2026 G | 15.243 | 0 | 0 | $0 |
| James D Plummer | Direktur | 11 Juni 2026 S | 23.264 | 0 | 1 | $-576.205 |
| Luc Van Den Hove | Direktur | 7 Mei 2026 A | 979 | 0 | 0 | $0 |
| Julia Liuson | Direktur | 7 Mei 2026 A | 6.441 | 0 | 0 | $0 |
| Mary L Krakauer | Direktur | 7 Mei 2026 A | 4.993 | 0 | 0 | $0 |
| Mark Adams | Direktur | 7 Mei 2026 A | 714 | 0 | 0 | $0 |
| Lewis Chew | Direktur | 7 Mei 2026 A | 9.131 | 0 | 0 | $0 |
| Moshe Gavrielov | Direktur | 7 Mei 2026 A | 1.819 | 1 | 2 | $5.977 |
| John B Shoven | Direktur | 4 Mei 2023 G | 197.254 | 0 | 0 | $0 |
| Susan L Bostrom | Direktur | 25 Feb. 2021 A | 3.789 | 0 | 0 | $0 |
| SIBONI ROGER S | Direktur | 29 April 2020 M | 44.891 | 0 | 0 | $0 |
| Mary Agnes Wilderotter | Direktur | 14 Feb. 2020 A | 13.235 | 0 | 0 | $0 |
| George Scalise | Direktur | 21 Feb. 2017 A | 44.100 | 0 | 0 | $0 |
| Sean Maloney | Direktur | 1 April 2004 A | · | 0 | 0 | $0 |
| Lip Bu Tan | · | 16 Mei 2023 M | 602.589 | 0 | 0 | $0 |
| Surendra Babu Mandava | · | 15 Maret 2021 F | 205.149 | 0 | 0 | $0 |
| Nimish Harsukh Modi | · | 8 Agu 2013 F | 70.151 | 0 | 0 | $0 |
| John A Swainson | · | 2 April 2012 A | 15.000 | 0 | 0 | $0 |
| Donald L Lucas | · | 2 April 2012 A | 55.000 | 0 | 0 | $0 |
| John J Bruggeman | · | 15 Maret 2011 F | 88.898 | 0 | 0 | $0 |
| Thomas A. Cooley | · | 8 Feb. 2011 A | 131.394 | 0 | 0 | $0 |
| Kevin S. Palatnik | · | 9 Agu 2010 F | 273.827 | 0 | 0 | $0 |
| James S Miller JR | · | 7 Okt. 2008 F | 309.968 | 0 | 0 | $0 |
| Lavi Lev | · | 1 Juli 2004 A | 250.000 | 0 | 0 | $0 |
| Penny Herscher | · | 3 Nov. 2003 S | 195.054 | 0 | 0 | $0 |
Orang dalam dari pengajuan SEC Form 3/4/5; bersih = hanya P/S pasar terbuka
Kepemilikan ETF Dimiliki oleh 183 ETF
Bobot mencerminkan kepemilikan ekuitas langsung (N-PORT) saja; dana berbasis leverage atau derivatif mungkin memiliki eksposur swap tambahan yang tidak ditampilkan.
| Dana | Bobot | Unit | Per tanggal | Sumber |
|---|---|---|---|---|
| GRW · TCW ETF Trust | 2,92% | 5.558 NS | 31 Juli 2026 | N-PORT |
| JGRW · Trust for Professional Managers | 2,83% | 7.335 NS | 31 Agu 2026 | N-PORT |
| ASLV · ALLSPRING EXCHANGE-TRADED FUNDS TRU… | 2,73% | 17.557 NS | 31 Juli 2026 | N-PORT |
| IGV · iShares Trust | 2,70% | 1.262.466 SH | 11 Sep. 2026 | Harian |
| FGSI · First Trust Exchange-Traded Fund IV | 2,00% | 122 NS | 31 Juli 2026 | N-PORT |
| FMAG · FIDELITY COVINGTON TRUST | 1,86% | 13.492 NS | 31 Juli 2026 | N-PORT |
| RILA · Spinnaker ETF Series | 1,69% | 2.095 NS | 31 Juli 2026 | N-PORT |
| SAWG · ETF Series Solutions | 1,65% | 140 NS | 31 Juli 2026 | N-PORT |
| AIFD · TCW ETF Trust | 1,59% | 5.856 NS | 31 Juli 2026 | N-PORT |
| AGRW · ALLSPRING EXCHANGE-TRADED FUNDS TRU… | 1,54% | 5.095 NS | 31 Juli 2026 | N-PORT |
| QNXT · iShares Trust | 1,50% | 1.442 SH | 11 Sep. 2026 | Harian |
| NULG · Nushares ETF Trust | 1,49% | 116.597 NS | 31 Juli 2026 | N-PORT |
| RSPT · Invesco Exchange-Traded Fund Trust | 1,45% | 281.422 SH | 23 Okt. 2026 | Harian |
| QQQG · Pacer Funds Trust | 1,40% | 840 NS | 31 Juli 2026 | N-PORT |
| TEC · Harbor ETF Trust | 1,30% | 243 NS | 31 Juli 2026 | N-PORT |
| XPND · First Trust Exchange-Traded Fund VI… | 1,30% | 1.510 NS | 31 Agu 2026 | N-PORT |
| IGPT · Invesco Exchange-Traded Fund Trust | 1,26% | 52.357 SH | 23 Okt. 2026 | Harian |
| WINN · Harbor ETF Trust | 1,19% | 39.540 NS | 31 Juli 2026 | N-PORT |
| ROBO · EXCHANGE TRADED CONCEPTS TRUST | 1,19% | 69.441 NS | 31 Juli 2026 | N-PORT |
| MMLG · First Trust Exchange-Traded Fund VI… | 1,05% | 2.895 NS | 31 Agu 2026 | N-PORT |
| COWG · Pacer Funds Trust | 0,99% | 64.043 NS | 31 Juli 2026 | N-PORT |
| FFLG · FIDELITY COVINGTON TRUST | 0,97% | 16.782 NS | 31 Juli 2026 | N-PORT |
| QQQE · Direxion Shares ETF Trust | 0,92% | 36.254 NS | 31 Juli 2026 | N-PORT |
| SPHB · Invesco Exchange-Traded Fund Trust … | 0,91% | 23.568 SH | 23 Okt. 2026 | Harian |
| JHAI · Janus Detroit Street Trust | 0,89% | 610 NS | 31 Juli 2026 | N-PORT |
| KNCT · Invesco Exchange-Traded Fund Trust | 0,81% | 3.862 SH | 23 Okt. 2026 | Harian |
| ALTL · Pacer Funds Trust | 0,80% | 2.166 NS | 31 Juli 2026 | N-PORT |
| JOET · Virtus ETF Trust II | 0,78% | 5.570 NS | 31 Juli 2026 | N-PORT |
| PEXL · Pacer Funds Trust | 0,77% | 1.143 NS | 31 Juli 2026 | N-PORT |
| ESLG · Strategy Shares | 0,74% | 509 NS | 31 Juli 2026 | N-PORT |
| SEMI · Columbia ETF Trust I | 0,73% | 808 NS | 31 Juli 2026 | N-PORT |
| NULC · Nushares ETF Trust | 0,69% | 1.440 NS | 31 Juli 2026 | N-PORT |
| FEUS · FlexShares Trust | 0,68% | 2.240 NS | 31 Juli 2026 | N-PORT |
| HAPI · Harbor ETF Trust | 0,64% | 9.210 NS | 31 Juli 2026 | N-PORT |
| FOWF · Pacer Funds Trust | 0,64% | 296 NS | 31 Juli 2026 | N-PORT |
| QIDX · Spinnaker ETF Series | 0,63% | 723 NS | 31 Juli 2026 | N-PORT |
| ESUM · Strategy Shares | 0,60% | 3.233 NS | 31 Juli 2026 | N-PORT |
| IIGD · Invesco Exchange-Traded Self-Indexe… | 0,60% | 148.000 | 23 Okt. 2026 | Harian |
| EGUS · iShares Trust | 0,60% | 581 SH | 11 Sep. 2026 | Harian |
| FXL · First Trust Exchange-Traded AlphaDE… | 0,60% | 45.316 NS | 31 Juli 2026 | N-PORT |
| ESMV · iShares Trust | 0,59% | 160 SH | 11 Sep. 2026 | Harian |
| TRFM · ETF Series Solutions | 0,59% | 4.268 NS | 31 Juli 2026 | N-PORT |
| LCOW · Pacer Funds Trust | 0,57% | 432 NS | 31 Juli 2026 | N-PORT |
| HIBL · Direxion Shares ETF Trust | 0,54% | 1.197 NS | 31 Juli 2026 | N-PORT |
| FTC · First Trust Exchange-Traded AlphaDE… | 0,52% | 20.003 NS | 31 Juli 2026 | N-PORT |
| GARP · iShares Trust | 0,51% | 54.609 SH | 11 Sep. 2026 | Harian |
| MGK · VANGUARD WORLD FUND | 0,50% | 448.336 SH | 19 Agu 2026 | Harian |
| QUAL · iShares Trust | 0,48% | 785.149 SH | 11 Sep. 2026 | Harian |
| VGT · VANGUARD WORLD FUND | 0,45% | 2.024.208 SH | 19 Agu 2026 | Harian |
| TECL · Direxion Shares ETF Trust | 0,45% | 67.381 NS | 31 Juli 2026 | N-PORT |
| XOEF · iShares Trust | 0,44% | 347 SH | 11 Sep. 2026 | Harian |
| QYLD · Global X Funds | 0,44% | 104.208 NS | 31 Juli 2026 | N-PORT |
| ACVF · ETF Opportunities Trust | 0,43% | 1.947 NS | 31 Juli 2026 | N-PORT |
| QYLG · Global X Funds | 0,43% | 2.000 NS | 31 Juli 2026 | N-PORT |
| PTNQ · Pacer Funds Trust | 0,43% | 15.091 NS | 31 Juli 2026 | N-PORT |
| FTEC · FIDELITY COVINGTON TRUST | 0,42% | 247.994 NS | 31 Juli 2026 | N-PORT |
| QTR · Global X Funds | 0,42% | 95 NS | 31 Juli 2026 | N-PORT |
| QRMI · Global X Funds | 0,42% | 178 NS | 31 Juli 2026 | N-PORT |
| LRND · New York Life Investments ETF Trust | 0,42% | 4.952 NS | 31 Juli 2026 | N-PORT |
| QCLR · Global X Funds | 0,42% | 41 NS | 31 Juli 2026 | N-PORT |
| QQWZ · Pacer Funds Trust | 0,42% | 628 NS | 31 Juli 2026 | N-PORT |
| ROUS · Lattice Strategies Trust | 0,41% | 8.583 NS | 31 Juli 2026 | N-PORT |
| HQGO · Lattice Strategies Trust | 0,41% | 588 NS | 31 Juli 2026 | N-PORT |
| JQUA · J.P. Morgan Exchange-Traded Fund Tr… | 0,40% | 96.350 NS | 31 Juli 2026 | N-PORT |
| QSIX · Pacer Funds Trust | 0,39% | 213 NS | 31 Juli 2026 | N-PORT |
| IYW · iShares Trust | 0,39% | 342.099 SH | 11 Sep. 2026 | Harian |
| QQQ · Invesco QQQ Trust, Series 1 | 0,37% | 5.752.739 SH | 23 Okt. 2026 | Harian |
| QQQM · Invesco Exchange-Traded Fund Trust … | 0,37% | 1.293.166 SH | 23 Okt. 2026 | Harian |
| IGM · iShares Trust | 0,35% | 130.285 SH | 11 Sep. 2026 | Harian |
| JMOM · J.P. Morgan Exchange-Traded Fund Tr… | 0,35% | 25.696 NS | 31 Juli 2026 | N-PORT |
| SUSA · iShares Trust | 0,35% | 48.693 SH | 11 Sep. 2026 | Harian |
| MNZL · EA Series Trust | 0,33% | 237 NS | 31 Juli 2026 | N-PORT |
| USXF · iShares Trust | 0,32% | 16.387 SH | 11 Sep. 2026 | Harian |
| VEGN · ETF Series Solutions | 0,31% | 1.629 NS | 31 Juli 2026 | N-PORT |
| VONG · VANGUARD SCOTTSDALE FUNDS | 0,31% | 437.091 SH | 19 Agu 2026 | Harian |
| TYLG · Global X Funds | 0,31% | 129 NS | 31 Juli 2026 | N-PORT |
| VUG · VANGUARD INDEX FUNDS | 0,30% | 3.036.159 SH | 19 Agu 2026 | Harian |
| IQSU · New York Life Investments ETF Trust | 0,29% | 2.774 NS | 31 Juli 2026 | N-PORT |
| IXN · iShares Trust | 0,29% | 94.200 SH | 11 Sep. 2026 | Harian |
| IWY · iShares Trust | 0,28% | 151.521 SH | 11 Sep. 2026 | Harian |
| VFQY · VANGUARD WELLINGTON FUND | 0,27% | 3.393 SH | 19 Agu 2026 | Harian |
| USSG · DBX ETF Trust | 0,26% | 4.607 NS | 31 Agu 2026 | N-PORT |
| HELO · J.P. Morgan Exchange-Traded Fund Tr… | 0,26% | 35.319 NS | 31 Juli 2026 | N-PORT |
| FAD · First Trust Exchange-Traded AlphaDE… | 0,26% | 4.348 NS | 31 Juli 2026 | N-PORT |
| SPTE · SP Funds Trust | 0,26% | 1.588 NS | 31 Juli 2026 | N-PORT |
| ILCG · iShares Trust | 0,25% | 26.826 SH | 11 Sep. 2026 | Harian |
| FEX · First Trust Exchange-Traded AlphaDE… | 0,24% | 11.263 NS | 31 Juli 2026 | N-PORT |
| HDUS · Lattice Strategies Trust | 0,24% | 1.437 NS | 31 Juli 2026 | N-PORT |
| IWF · iShares Trust | 0,24% | 1.036.389 SH | 11 Sep. 2026 | Harian |
| HLAL · Listed Funds Trust | 0,24% | 6.598 NS | 31 Agu 2026 | N-PORT |
| MPLY · Strategy Shares | 0,24% | 110 NS | 31 Juli 2026 | N-PORT |
| JOYT · J.P. Morgan Exchange-Traded Fund Tr… | 0,23% | 665 NS | 31 Juli 2026 | N-PORT |
| SUSL · iShares Trust | 0,23% | 9.734 SH | 11 Sep. 2026 | Harian |
| ESGU · iShares Trust | 0,23% | 143.411 SH | 11 Sep. 2026 | Harian |
| SNPE · DBX ETF Trust | 0,23% | 19.826 NS | 31 Agu 2026 | N-PORT |
| DSI · iShares Trust | 0,22% | 42.156 SH | 11 Sep. 2026 | Harian |
| BSCT · Invesco Exchange-Traded Self-Indexe… | 0,22% | 6.887.000 | 23 Okt. 2026 | Harian |
| AQLT · iShares Trust | 0,22% | 2.481 SH | 11 Sep. 2026 | Harian |
| GLBL · Pacer Funds Trust | 0,21% | 7 NS | 31 Juli 2026 | N-PORT |
| RSP · Invesco Exchange-Traded Fund Trust | 0,21% | 689.852 SH | 23 Okt. 2026 | Harian |
| MGC · VANGUARD WORLD FUND | 0,20% | 55.088 SH | 19 Agu 2026 | Harian |
| QVML · Invesco Exchange-Traded Fund Trust … | 0,19% | 10.273 SH | 23 Okt. 2026 | Harian |
| EUSA · iShares, Inc. | 0,18% | 12.389 SH | 11 Sep. 2026 | Harian |
| ESGG · FlexShares Trust | 0,18% | 589 NS | 31 Juli 2026 | N-PORT |
| VOOG · VANGUARD ADMIRAL FUNDS | 0,18% | 129.066 SH | 19 Agu 2026 | Harian |
| ESGV · VANGUARD WORLD FUND | 0,18% | 62.346 SH | 19 Agu 2026 | Harian |
| USMV · iShares Trust | 0,16% | 134.640 SH | 11 Sep. 2026 | Harian |
| VOO · VANGUARD INDEX FUNDS | 0,16% | 7.164.888 SH | 19 Agu 2026 | Harian |
| VV · VANGUARD INDEX FUNDS | 0,16% | 322.135 SH | 19 Agu 2026 | Harian |
| ACIO · ETF Series Solutions | 0,15% | 10.675 NS | 31 Juli 2026 | N-PORT |
| SIZE · iShares Trust | 0,15% | 2.297 SH | 11 Sep. 2026 | Harian |
| CATH · Global X Funds | 0,15% | 5.871 NS | 31 Juli 2026 | N-PORT |
| GLOF · iShares Trust | 0,15% | 1.075 SH | 11 Sep. 2026 | Harian |
| ADME · ETF Series Solutions | 0,15% | 1.305 NS | 31 Juli 2026 | N-PORT |
| VONE · VANGUARD SCOTTSDALE FUNDS | 0,15% | 45.689 SH | 19 Agu 2026 | Harian |
| WRND · New York Life Investments ETF Trust | 0,15% | 46 NS | 31 Juli 2026 | N-PORT |
| XYLD · Global X Funds | 0,15% | 14.218 NS | 31 Juli 2026 | N-PORT |
| USCL · iShares Trust | 0,15% | 14.552 SH | 11 Sep. 2026 | Harian |
| TOPC · iShares Trust | 0,15% | 168 SH | 11 Sep. 2026 | Harian |
| BBUS · J.P. Morgan Exchange-Traded Fund Tr… | 0,15% | 37.988 NS | 31 Juli 2026 | N-PORT |
| CHRI · Global X Funds | 0,14% | 34 NS | 31 Juli 2026 | N-PORT |
| BKLC · BNY Mellon ETF Trust | 0,14% | 23.282 NS | 31 Juli 2026 | N-PORT |
| VOTE · TCW ETF Trust | 0,14% | 4.657 NS | 31 Juli 2026 | N-PORT |
| XRMI · Global X Funds | 0,14% | 211 NS | 31 Juli 2026 | N-PORT |
| PTLC · Pacer Funds Trust | 0,14% | 13.770 NS | 31 Juli 2026 | N-PORT |
| XCLR · Global X Funds | 0,14% | 15 NS | 31 Juli 2026 | N-PORT |
| XYLG · Global X Funds | 0,14% | 268 NS | 31 Juli 2026 | N-PORT |
| XTR · Global X Funds | 0,14% | 20 NS | 31 Juli 2026 | N-PORT |
| VOXP · Advisors Series Trust | 0,14% | 24 NS | 31 Juli 2026 | N-PORT |
| VTI · VANGUARD INDEX FUNDS | 0,14% | 8.757.907 SH | 19 Agu 2026 | Harian |
| VTHR · VANGUARD SCOTTSDALE FUNDS | 0,14% | 23.220 SH | 19 Agu 2026 | Harian |
| TOV · EA Series Trust | 0,14% | 1.100 NS | 31 Juli 2026 | N-PORT |
| IVW · iShares Trust | 0,14% | 370.636 SH | 11 Sep. 2026 | Harian |
| IWL · iShares Trust | 0,14% | 10.685 SH | 11 Sep. 2026 | Harian |
| DFUS · Dimensional ETF Trust | 0,14% | 83.204 NS | 31 Juli 2026 | N-PORT |
| XVV · iShares Trust | 0,13% | 3.166 SH | 11 Sep. 2026 | Harian |
| SPUU · Direxion Shares ETF Trust | 0,13% | 1.040 NS | 31 Juli 2026 | N-PORT |
| APUE · Trust for Professional Managers | 0,13% | 9.857 NS | 31 Agu 2026 | N-PORT |
| IUSG · iShares Trust | 0,13% | 153.010 SH | 11 Sep. 2026 | Harian |
| QDPL · Pacer Funds Trust | 0,13% | 6.637 NS | 31 Juli 2026 | N-PORT |
| ESG · FlexShares Trust | 0,13% | 510 NS | 31 Juli 2026 | N-PORT |
| VOOV · VANGUARD ADMIRAL FUNDS | 0,13% | 23.494 SH | 19 Agu 2026 | Harian |
| PBP · Invesco Exchange-Traded Fund Trust | 0,13% | 1.652 SH | 23 Okt. 2026 | Harian |
| PBUS · Invesco Exchange-Traded Fund Trust … | 0,13% | 44.177 SH | 23 Okt. 2026 | Harian |
| IVV · iShares Trust | 0,12% | 3.476.709 SH | 11 Sep. 2026 | Harian |
| ILCB · iShares Trust | 0,12% | 5.335 SH | 11 Sep. 2026 | Harian |
| HCMT · Direxion Shares ETF Trust | 0,12% | 1.925 NS | 31 Juli 2026 | N-PORT |
| BSCR · Invesco Exchange-Traded Self-Indexe… | 0,11% | 5.194.000 | 22 Okt. 2026 | Harian |
| IWB · iShares Trust | 0,11% | 190.994 SH | 11 Sep. 2026 | Harian |
| IYY · iShares Trust | 0,11% | 11.806 SH | 11 Sep. 2026 | Harian |
| OMFL · Invesco Exchange-Traded Self-Indexe… | 0,11% | 17.068 SH | 23 Okt. 2026 | Harian |
| PHDG · Invesco Actively Managed Exchange-T… | 0,11% | 218 SH | 23 Okt. 2026 | Harian |
| SPXL · Direxion Shares ETF Trust | 0,11% | 21.562 NS | 31 Juli 2026 | N-PORT |
| KOKU · DBX ETF Trust | 0,11% | 2.582 NS | 31 Agu 2026 | N-PORT |
| IWV · iShares Trust | 0,11% | 75.765 SH | 11 Sep. 2026 | Harian |
| ITOT · iShares Trust | 0,11% | 358.588 SH | 11 Sep. 2026 | Harian |
| ACWV · iShares, Inc. | 0,10% | 11.948 SH | 11 Sep. 2026 | Harian |
| IVE · iShares Trust | 0,10% | 169.332 SH | 11 Sep. 2026 | Harian |
| TILT · FlexShares Trust | 0,10% | 6.156 NS | 31 Juli 2026 | N-PORT |
| TOK · iShares Trust | 0,09% | 772 SH | 11 Sep. 2026 | Harian |
| IUSV · iShares Trust | 0,09% | 89.044 SH | 11 Sep. 2026 | Harian |
| DFSU · Dimensional ETF Trust | 0,09% | 6.153 NS | 31 Juli 2026 | N-PORT |
| VT · VANGUARD INTERNATIONAL EQUITY INDEX… | 0,09% | 230.054 SH | 19 Agu 2026 | Harian |
| PFIG · Invesco Exchange-Traded Fund Trust … | 0,09% | 120.000 | 23 Okt. 2026 | Harian |
| URTH · iShares, Inc. | 0,09% | 24.688 SH | 11 Sep. 2026 | Harian |
| DFAU · Dimensional ETF Trust | 0,09% | 31.345 NS | 31 Juli 2026 | N-PORT |
| DEUS · DBX ETF Trust | 0,08% | 747 NS | 31 Agu 2026 | N-PORT |
| PWS · Pacer Funds Trust | 0,08% | 57 NS | 31 Juli 2026 | N-PORT |
| XT · iShares Trust | 0,08% | 10.624 SH | 11 Sep. 2026 | Harian |
| ACWI · iShares Trust | 0,08% | 87.426 SH | 11 Sep. 2026 | Harian |
| SPXD · DBX ETF Trust | 0,07% | 15 NS | 31 Agu 2026 | N-PORT |
| PEVC · Pacer Funds Trust | 0,07% | 5 NS | 31 Juli 2026 | N-PORT |
| CRBN · iShares Trust | 0,07% | 2.887 SH | 11 Sep. 2026 | Harian |
| EQAL · Invesco Exchange-Traded Fund Trust … | 0,07% | 1.768 SH | 23 Okt. 2026 | Harian |
| LRGF · iShares Trust | 0,06% | 7.699 SH | 11 Sep. 2026 | Harian |
| DCOR · Dimensional ETF Trust | 0,06% | 5.571 NS | 31 Juli 2026 | N-PORT |
| PRF · Invesco Exchange-Traded Fund Trust | 0,05% | 16.607 SH | 23 Okt. 2026 | Harian |
| IUS · Invesco Exchange-Traded Self-Indexe… | 0,04% | 1.469 SH | 23 Okt. 2026 | Harian |
| QLV · FlexShares Trust | 0,03% | 168 NS | 31 Juli 2026 | N-PORT |
| RWL · Invesco Exchange-Traded Fund Trust … | 0,03% | 10.346 SH | 23 Okt. 2026 | Harian |
| DFAC · Dimensional ETF Trust | 0,03% | 41.445 NS | 31 Juli 2026 | N-PORT |
| LGDX · Tidal Trust III | 0,02% | 74 NS | 31 Juli 2026 | N-PORT |
| NPFE · Elevation Series Trust | 0,00% | 22 NS | 31 Juli 2026 | N-PORT |
CDNS Konsensus Analis Opini analis bullish dan bearish, target harga 12 bulan, potensi kenaikan
Target Harga 12 Bulan
26 analis · 2026-10-20Target rata-rata $406.24 +28,4%
Perbandingan rekan (sub-industri GICS) Metrik utama vs rekan sektor
Dasar FY, harga per penutupan akhir tahun fiskal terakhir setiap perusahaan.
| Ticker | Kapitalisasi Pasar | P/E | Pendapatan YoY | Margin Bersih | ROE | Margin Kotor |
|---|---|---|---|---|---|---|
| CDNS | $84.96B | 77.0 | 14.1% | 20.9% | 21.2% | · |
| CRM | $197.22B | 27.2 | 9.6% | 18.0% | 12.4% | 77.7% |
| ADBE | $132.21B | 19.2 | 10.5% | 30.0% | 61.8% | 89.3% |
| DDOG | $47.94B | 438.7 | 27.7% | 3.1% | 3.1% | 80.0% |
| INTU | $84.83B | 19.2 | 13.9% | 21.3% | 24.0% | · |
| APP | $227.96B | 69.1 | 70.0% | 60.8% | 201.9% | · |
| SNPS | $84.41B | 56.4 | 15.1% | 18.9% | 7.1% | 77.0% |
| MSTR | · | -10.0 | 3.0% | -806.3% | -8.4% | 68.7% |
| ADSK | $53.90B | 48.6 | 17.5% | 15.6% | 39.0% | 91.0% |
| WDAY | $45.51B | 67.8 | 13.1% | 7.3% | 8.2% | · |
| ROP | $47.45B | 31.3 | 12.3% | 19.4% | 7.8% | 69.2% |
Berita Terbaru Berita utama terbaru yang menyebutkan perusahaan ini
Sinyal Perdagangan Sinyal beli/jual terbaru dengan harga masuk dan rasio risiko/imbalan
Tidak ada sinyal terbuka saat ini — tidak ada kartu yang terisi, dan itu jujur.
Metrik Saya Daftar pantauan pribadi Anda — baris yang dipilih dari Fundamental Lengkap
Pilih metrik yang penting bagi Anda — klik + di sebelah baris mana pun di Fundamental Lengkap di atas.
Pilihan Anda disimpan dan mengikuti Anda di semua ticker.