
KGC Kinross Gold Corporation Common Stock
NYSE · Metals & Mining · Wyświetl na SEC EDGAR ↗ 10-K/10-Q Mar 26, 2026KGC Migawka akcji Cena, kapitalizacja rynkowa, P/E, EPS, ROE, zadłużenie/kapitał własny, zakres 52-tygodniowy
KGC Wykres ceny akcji Dzienny OHLCV ze wskaźnikami technicznymi — przesuwaj, powiększaj i dostosowuj widok
Granularność słupków dostosowuje się do wybranego okresu — najedź kursorem na wykres, aby zobaczyć otwarcia/maksima/minima/zamknięcia dla danego słupka.
| Data ex-dywidendy | Podział | Typ |
|---|---|---|
| 3 lutego 2003 | 1-for-3 | Odwrotny |
O Kinross Gold Corporation Common Stock Przegląd firmy z Wikipedii
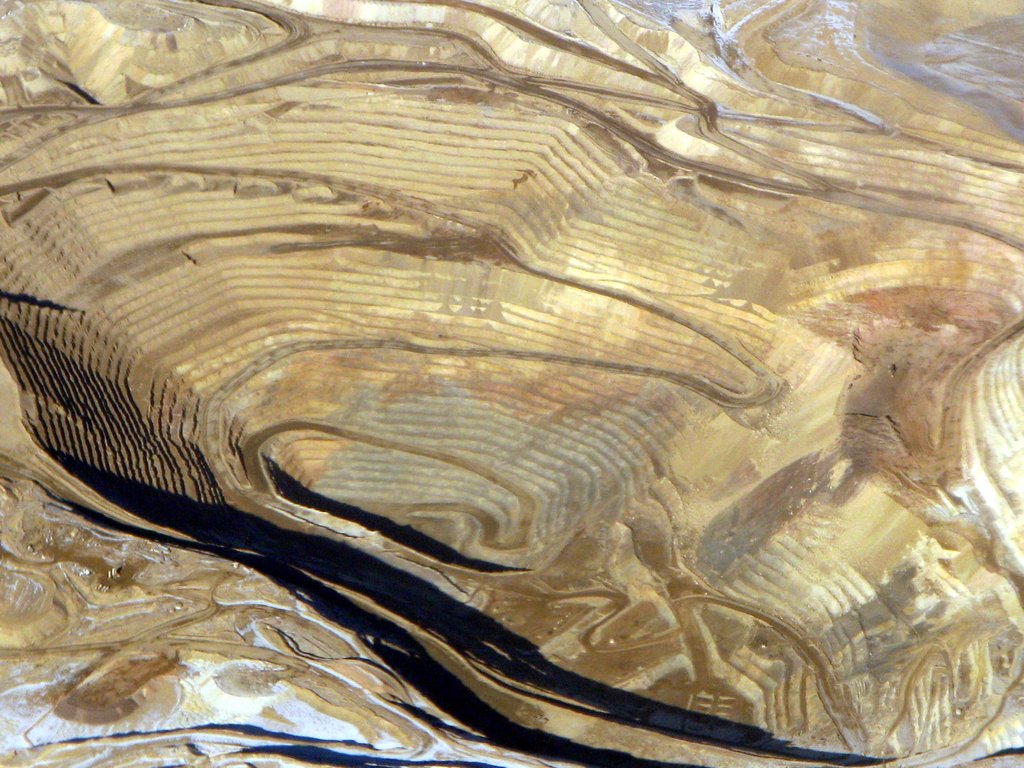
Kinross Gold Corporation is a Canadian gold and silver mining company founded in 1993 and headquartered in Toronto, Ontario, Canada. Kinross currently operates six active gold mines, and was ranked fifth of the "10 Top Gold-mining Companies" of 2019 by InvestingNews. The company's mines are located in Brazil, Mauritania, and the United States. It trades under the KGC ticker in the New York Stock Exchange, and under K in the Toronto Stock Exchange.
Operations
Kinross Gold operates mines in North and South America, and West Africa. In 2022, 58% of Kinross gold production was expected to come from the Americas.
Fort Knox
This property includes a mill, tailings storage, heap leach facility, the Gil project, and the True North open pit mine, which is closed and under monitoring. Expected to run out of ore in 2021, the mine's life has been extended to 2030 following a $100 million expansion investment announced in 2018, increasing life-of-mine production by about 1.5 million gold equivalent ounces.
Round Mountain
The Round Mountain Gold Mine is located in Nye County, Nevada and has operated by Kinross since 2003. They purchased the remaining outstanding interest in the company from Barrick Gold in 2016.
Bald Mountain
Located in White Pine County, Nevada, the Bald Mountain mine is operated by subsidiary KG Mining (Bald Mountain) Inc.
Paracatu
The open-pit Paracatu gold mine, located in northwest Minas Gerais, Brazil.
Tasiast
Kinross acquired the Tasiast mine (located in Mauritania) in 2010, expanding the operation twice by 2017.
In 2012, securities class action lawsuits launched in the U.S. and Canada, alleging Kinross Gold overstated the value of Tasiast mine in its financial statements, misrepresented some of the mine's project expansion schedules, and made other false statements. In 2015, the parties reached no-fault settlement agreements which included payments by Kinross totaling approximately $US 40 million.
In June 2016, due to "government allegations of invalid work permits" for expatriate employees, the mine suspended operations, resuming them in August that same year.
In May 2020, there was a short strike by unionized employees at the mine, which was suspended at the request of the Mauritanian government. A month later, Kinross reached an agreement in principle with the government, which included revalued royalties.
Chirano
Kinross holds 90% ownership of the Chirano gold mine, with the remainder held by the Government of Ghana. In April 2022, Kinross announced plans to sell its 90% ownership for US$225-million to Asante Gold Corp.
History
Founding and early years
Kinross Gold Corporation was founded in 1993, following the amalgamation of three companies: Plexus Resources Corporation, CMP Resources and numbered company 1021105 Ontario Corp., resulting in the new company owning a stake and royalties in a mining property in Fallon, Nevada and the QR Mine in British Columbia. On June 1, 1993, Kinross was listed on the Toronto Stock Exchange and NASDAQ, then on the New York Stock Exchange in 1994.
Kinross' first project – now operated by its subsidiary Fairbanks Gold Mining – was the Fort Knox Gold Mine, an open-pit mining operation in Alaska. The area, including surrounding deposits, was prospected as early as 1913, but no mining took place until 1996. The mine currently produces over 200,000 ounces of gold a year.
In 1998, a wholly owned subsidiary of Kinross merged with Amax Gold, forming Kinam Gold, the company's largest subsidiary. effectively transferring ownership of the mine back to Kinross, along with Maricunga Gold Mine in Chile, as part of the merger.
1999–2006
Kinross acquired Hollinger Mines in 1999 as part of a land package prior to the bankruptcy of Royal Oak Mines (later sold to Goldcorp in 2006). Also that year, Kinross acquired LA Teko Resources Ltd. through its wholly owned subsidiary, LT Acquisition Inc. division.
In July 2002, Kinross and Placer Dome combined their assets in Timmins, Ontario and formed the Porcupine Joint Venture (51% Placer Dome, 49% Kinross). In January 2003 Kinross TVX Gold and Echo Bay Mines shareholders approved a $3-billion merger, combining the three companies, while retaining the name Kinross Gold. The TVX merger resulted in Kinross' stake in the La Coipa open pit mine, the remainder being purchased from Goldcorp in 2007.
In 2006, Kinross bought Crown Resources Corporation, which gave it ownership of the mineral resource Buckhorn Mountain (later Buckhorn Gold Mine) and the associated mineral processing facilities.
2007–present
In 2007, Kinross traded assets with Goldcorp; Kinross received $200 million and the remaining portion of the La Coipa Gold Mine it had acquired with the TVX merger, in exchange for giving up its 49% of the Porcupine Joint Venture and 31.9% of the Musselwhite mine.
In 2010, Kinross purchased 91% of Red Back Mining for $7.1 billion. The purchase brought with it the two gold mines in Africa (Chirano and Tasiast). Also that year, Kinross acquired the Dvoinoye deposit and the property in Vodorazdelnaya, about 90 kilometres (56 mi) north of Kinross’ Kupol operation. In 2011, Kinross entered into a share purchase agreement with the State Unitary Enterprise of the Chukotka Autonomous Okrug, whereby it held 100% of the Kupol mine and exploration licenses. Kinross sold its interest in the Crixás mine to AngloGold Ashanti in 2012.
In December 2017, Kinross acquired mineral rights to Gilmore, or Parcel G, a 709-acre tract adjacent to its Fort Knox Gold Mine, about 25 miles northeast of Fairbanks, Alaska. Estimates of the land valued it as containing 2.1 million ounces of gold.
In December 2021, Kinross offered to acquire Great Bear Resources for $29 per share, or about $1.8 billion, giving it ownership of a gold mining prospect in Red Lake, Ontario, Canada. Kinross shares dropped 9% after it announced the buyout bid. The deal to acquire Great Bear closed on February 24, 2022.
Non-operating, discontinued and divested mines
Julietta Mine is a gold and silver mine located in the Omsukchansky District of Magadan Oblast, near Russia's far eastern border.
Kettle River-Buckhorn - the Washington-state based mine and mill were acquired by Kinross in 2006, and was closed in 2017.
Mineral Hill - located on the east side of Crevice Mountain, Montana, Mineral Hill operated from 1990 to 1996. In 2017, Kinross donated water rights representing 3 billion gallons of water to Trout Unlimited to protect fish habitat in tributaries of the Yellowstone River.
Cerro Casale - Chile-based mine acquired by Kinross in 2007. As of 2015, the mine was inactive, and Kinross divested in 2017.
Crixás - Kinross sold its 50% interest in the Brazil-based mine to AngloGold Ashanti for $220 million.
Fruta del Norte - Kinross purchased 100% of outstanding shares in the Ecuadorian deposit in 2008, but ceased development in 2013, and sold the rights in 2014.
La Coipa - Kinross incurred an impairment charge of $124 million in 2014 after development on the Chile-based mine ceased. In February 2020, Kinross announced it was proceeding with the La Coipa Restart project to mine the Phase 7 deposit, expected to operate from 2022 to 2024.
Lobo-Marte - After acquiring 40% interest in the Chile mine in 2008, Kinross acquired the remaining interest in 2009, for a total cost of $182 million. The results of a pre-feasibility study at Lobo-Marte was announced in July 2020. Subject to development decision, project construction will begin in 2025, with production expected in 2027.
Maricunga - Operations ceased in August 2016, after the Chilean government shut off the mine's water supply over environmental concerns. As a result, 300 employees were laid off, and Kinross incurred an impairment charge of $68 million.
Dvoinoye Gold Mine & Kupol Gold Mine - The Dvoinoye and Kupol gold mines are located in Russia approximately 100 kilometres (60 mi) apart; Dvoinoye is an underground mine, while Kupol is a combination of open-pit and underground. Acquired in 2010 and opened in 2013, Dvionoye/Kupol was one of Kinross' most profitable segments. In April 2022, Kinross announced that it was selling 100% of its Russian assets to the Highland Gold Mining, completing the sale of Russian assets two months later.
Financial performance
Gold production
Annual gold production (thousands of ounces) was:
2013 - 2,631
2014 - 2,710
2015 - 2,594
2016 - 2,789
2017 - 2,673
2018 - 2,450
2019 - 2,507
2020 - 2,366
2021 - 2,063
Gold reserves
Kinross' proven and probable gold reserves were 32.6 million ounces as of December 31, 2021.
Assets
Kinross Gold's total assets decreased significantly in recent years, from $US 16.39 billion in 2010 to $US 7.73 billion in 2015.
Other
Kinross suspended dividend payments in 2013. It started paying again in 2020, and that year, also announced a share buyback program.
In 2015 in the wake of declining gold prices, Kinross closed their office in Denver and eliminated 110 corporate positions in Denver, Chile, Spain, and Toronto.
In 2016, Standard & Poor's lowered Kinross' credit rating to junk bond status, largely based on the share of their production that came from mines in Russia, which the agency saw as a significant risk.
In 2017, Moody's Investors Service assigned a Ba1 rating to Kinross, "primarily driven by the company's good scale (2.78 million gold-equivalent ounces (GEO) as of March 2017 LTM), low leverage (1.7x LTM adjusted Debt/EBITDA), and very good liquidity (SGL-1).
On March 2, 2020, Moody's announced it had upgraded Kinross's credit rating to investment grade. Their senior unsecured notes rating was upgraded to Ba1, with a stable outlook. Kinross currently holds investment grade ratings from Moody's, S&P Global Ratings, and Fitch Ratings.
Corporate responsibility
In 2015, Kinross achieved an A− ranking in Maclean's magazine's annual assessment of socially responsible companies, the highest ranking of any Canadian mining company.
For Kinross' cooperation with an environmental group in Washington state, and for five out of eight mines being in compliance with the International Cyanide Management Code (as of May 2013, the Company had eight of its nine mines in compliance with the International Cyanide Management Code), Kinross was recognized as one of Canada's Top 50 Most Responsible Corporations by Maclean's magazine and Jantzi Research in 2009.
Through a $1 million donation by Kinross in 2010, the University of Guelph created a new chair as part of its BetterPlanet Project. Said Chair is named the Kinross Chair in Environmental Governance, and is held by a "succession of experts". Also with the university, Kinross provided $100 thousand towards its Fight Against Hunger.
In 2010, Kinross committed to contribute $10 million over a three-year period towards developing a mining school in Mauritania. The following year, it committed $2.5 million to build and equip a medical emergency centre in that country.
In 2013, Kinross was named to the Dow Jones Sustainability World Index for the third consecutive year, as well as the DJSI North American Index, the Ethibel Excellence Investment Register, and the Ethical Global Equity and ECPI Global Carbon Indices. For the fifth consecutive year, the company was named to the Jantzi Social Index, and as one of Canada's Best 50 Corporate Citizens by Corporate Knights magazine for the fourth year.
In 2021, Kinross was ranked no. 22 out of 120 oil, gas, and mining companies involved in resource extraction north of the Arctic Circle in the Arctic Environmental Responsibility Index (AERI).
Carbon footprint
Kinross Gold reported Total CO2e emissions (Direct + Indirect) for the twelve months ending 31 December 2020 at 1,631 Kt (+19/+1.2% y-o-y). There have been not any significant reductions in emissions in recent years. In May 2021, Kinross committed to reaching net-zero greenhouse gas emissions by 2050.
Źródło: Wikipedia (Angielski), CC BY-SA 4.0 · Zobacz w Wikipedii ↗
Wyniki 10-letnie Trendy przychodów, zysku netto, marż i EPS
Wycena Wskaźniki P/E, P/S, P/B, EV/EBITDA — czy akcje są drogie, czy tanie?
| Wskaźnik | Trend 5-letni | KGC | średnia z 5 lat | Mediana porównawcza | Werdykt |
|---|---|---|---|---|---|
| P/E | 14.4średnia z 5 lat ≈13.9 | ≈13.9 | · | · |
Mediana porównawcza jest obliczana na znormalizowanej podstawie dla każdej metryki i może nie zawsze odpowiadać podstawie TTM/MRQ pokazanej dla tej akcji.
Rentowność Marże brutto, operacyjne i netto; ROE, ROA, ROIC
| Wskaźnik | Trend 5-letni | KGC | średnia z 5 lat | Mediana porównawcza | Werdykt |
|---|---|---|---|---|---|
| ROA | 20.5%średnia z 5 lat ≈5.9% | ≈5.9% | · | · | |
| ROE | 31.0%średnia z 5 lat ≈9.2% | ≈9.2% | · | · | |
| ROIC | 29.5%średnia z 5 lat ≈11.2% | ≈11.2% | · | · |
Zdrowie finansowe Dług, płynność, wypłacalność — siła bilansu
| Wskaźnik | Trend 5-letni | KGC | średnia z 5 lat | Mediana porównawcza | Werdykt |
|---|---|---|---|---|---|
| Current Ratio (Wskaźnik bieżący) | 2.3średnia z 5 lat ≈2.4 | ≈2.4 | · | · | |
| Quick Ratio (Wskaźnik Szybkości) | 0.7średnia z 5 lat ≈0.6 | ≈0.6 | · | · | |
| Interest Coverage (Pokrycie odsetek) | 40.1średnia z 5 lat ≈18.1 | ≈18.1 | · | · |
Rozwój Wzrost przychodów, EPS i zysku netto: r/r, CAGR 3-letni, CAGR 5-letni
Za mało danych fundamentalnych, aby obliczyć tę grupę wskaźników.
Efektywność kapitałowa Rotacja aktywów, rotacja zapasów, rotacja należności
| Wskaźnik | Trend 5-letni | KGC | średnia z 5 lat | Mediana porównawcza | Werdykt |
|---|---|---|---|---|---|
| Inventory Turnover (Rotacja zapasów) | 2.6średnia z 5 lat ≈2.6 | ≈2.6 | · | · |
wartość · ≈ średnia z 5 lat · mediana branżowa · werdykt względem mediany
Dywidendy Stopa dywidendy, wskaźnik wypłaty, historia dywidend, 5-letni CAGR
| Data ex-dywidendy | Kwota | Waluta | Stopa zwrotu |
|---|---|---|---|
| Sie 20, 2026 | $0,04 | USD | ≈0.48% |
| Maj 21, 2026 | $0,04 | USD | ≈0.49% |
| Mar 11, 2026 | $0,04 | USD | ≈0.31% |
| Sie 21, 2025 | $0,03 | USD | ≈0.62% |
| Maj 29, 2025 | $0,03 | USD | ≈0.82% |
| Mar 5, 2025 | $0,03 | USD | ≈1.0% |
| Lis 27, 2024 | $0,03 | USD | ≈1.2% |
| Sie 22, 2024 | $0,03 | USD | ≈1.3% |
| Maj 30, 2024 | $0,03 | USD | ≈1.5% |
| Mar 5, 2024 | $0,03 | USD | ≈2.3% |
| Lis 29, 2023 | $0,03 | USD | ≈2.1% |
| Sie 23, 2023 | $0,03 | USD | ≈2.4% |
| Maj 31, 2023 | $0,03 | USD | ≈2.5% |
| Mar 7, 2023 | $0,03 | USD | ≈3.4% |
| Lis 30, 2022 | $0,03 | USD | ≈2.9% |
| Sie 17, 2022 | $0,03 | USD | ≈3.5% |
| Cze 1, 2022 | $0,03 | USD | ≈2.7% |
| Mar 8, 2022 | $0,03 | USD | ≈2.1% |
| Lis 30, 2021 | $0,03 | USD | ≈2.0% |
| Sie 18, 2021 | $0,03 | USD | ≈2.6% |
Historia zysków EPS faktyczny vs szacowany, zaskoczenie %, wskaźnik trafień, data następnych wyników
| Okres | Raport | EPS Actual | EPS Szacowany | Niespodzianka |
|---|---|---|---|---|
| 30 czerwca 2026 | $0.71 | $0.74 | -4.1% | |
| 31 marca 2026 | $0.71 | $0.67 | 5.5% | |
| 31 grudnia 2025 | $0.67 | $0.60 | 11.4% | |
| 30 września 2025 | $0.44 | $0.37 | 20.2% | |
| 30 czerwca 2025 | $0.44 | $0.30 | 46.2% | |
| 31 marca 2025 | $0.30 | $0.23 | 28.6% |
Pełne podstawowe wskaźniki Wszystkie wskaźniki roczne — rachunek zysków i strat, bilans, przepływy pieniężne
Rachunek zysków i strat
| Wskaźnik | Trend | 2025 | 2024 | 2023 | 2022 | 2021 | 2020 | 2019 | 2018 | 2017 | 2016 |
|---|---|---|---|---|---|---|---|---|---|---|---|
| Cost of Revenue | $3.34B | $3.27B | $3.08B | $2.94B | $2.06B | $1.92B | $2.15B | $2.63B | $2.60B | $2.98B | |
| Gross Profit | $3.72B | $1.88B | $1.16B | $515M | $541M | $2.30B | $1.35B | $580M | $705M | $494M | |
| SG&A Expense | $140M | $126M | $109M | $130M | $114M | $118M | $136M | $133M | $133M | $144M | |
| Operating Income | $3.28B | $1.54B | $801M | $118M | $72M | $1.90B | $991M | $200M | $336M | $46M | |
| Interest Expense | $82M | $50M | $69M | $68M | $72M | $90M | $77M | $72M | $86M | $100M | |
| Interest Income | $73M | $18M | $40M | $18M | $11M | $4M | $8M | $11M | $14M | $8M | |
| Pretax Income | $3.19B | $1.48B | $709M | $107M | $84M | $1.80B | $964M | $113M | $419M | $-60M | |
| Income Tax | $725M | $487M | $293M | $76M | $115M | $440M | $247M | $139M | $-23M | $50M | |
| Net Income | $2.39B | $949M | $416M | $-605M | $221M | $1.34B | $719M | $-24M | $445M | $-104M | |
| EPS (Basic) | $1.96 | $0.77 | $0.34 | $-0.47 | $0.18 | $1.07 | $0.57 | $-0.02 | $0.36 | $-0.08 | |
| EPS (Diluted) | $1.95 | $0.77 | $0.34 | $-0.47 | $0.17 | $1.06 | $0.57 | $-0.02 | $0.35 | $-0.08 | |
| Shares (Basic) | 1,219,466,000 | 1,228,855,000 | 1,226,985,000 | 1,280,531,000 | 1,259,059,000 | 1,257,200,000 | 1,252,300,000 | 1,249,500,000 | 1,246,619,000 | 1,227,007,000 | |
| Shares (Diluted) | 1,224,607,000 | 1,234,504,000 | 1,236,670,000 | 1,292,811,000 | 1,259,059,000 | 1,268,000,000 | 1,262,300,000 | 1,249,500,000 | 1,257,045,000 | 1,227,007,000 | |
| EBITDA | $4.38B | $2.69B | $1.79B | $902M | $1.30B | $2.74B | $1.72B | $973M | $1.16B | · |
Bilans
| Wskaźnik | Trend | 2025 | 2024 | 2023 | 2022 | 2021 | 2020 | 2019 | 2018 | 2017 | 2016 |
|---|---|---|---|---|---|---|---|---|---|---|---|
| Cash & Equivalents | $887M | $282M | $198M | $270M | $387M | $562M | $306M | $208M | $601M | $514M | |
| Receivables | $30M | $53M | $58M | $318M | $214M | $116M | $137M | $101M | $91M | $127M | |
| Inventory | $1.37B | $1.24B | $1.15B | $1.07B | $1.15B | $1.07B | $1.05B | $1.05B | $1.09B | $987M | |
| Current Assets | $3.29B | $2.13B | $1.80B | $1.85B | $1.95B | $2.45B | $1.82B | $1.60B | $2.28B | $2.08B | |
| PP&E (Net) | $8.29B | $7.97B | $7.96B | $7.74B | $7.62B | $7.65B | $6.34B | $5.52B | $4.89B | $4.92B | |
| Goodwill | · | · | · | · | $159M | $159M | $159M | $163M | $163M | $163M | |
| Total Assets | $12.41B | $10.87B | $10.54B | $10.40B | $10.43B | $10.93B | $9.08B | $8.06B | $8.16B | $7.98B | |
| Accounts Payable | $716M | $543M | $532M | $550M | $493M | $479M | $469M | $466M | $483M | $465M | |
| Current Liabilities | $1.40B | $1.06B | $686M | $752M | $741M | $1.35B | $616M | $612M | $585M | $638M | |
| Total Liabilities | $3.72B | $3.87B | $4.36B | $4.51B | $3.78B | $4.27B | $3.74B | $3.54B | $3.54B | $3.79B | |
| Retained Earnings | $-5.94B | $-8.18B | $-8.98B | $-9.25B | $-8.49B | $-8.56B | $-9.83B | $-10.55B | $-10.58B | $-11.03B | |
| Stockholders' Equity | $8.58B | $6.86B | $6.08B | $5.82B | $6.58B | $6.60B | $5.32B | $4.51B | $4.58B | $4.15B |
Przepływy pieniężne
| Wskaźnik | Trend | 2025 | 2024 | 2023 | 2022 | 2021 | 2020 | 2019 | 2018 | 2017 | 2016 |
|---|---|---|---|---|---|---|---|---|---|---|---|
| D&A | $1.10B | $1.15B | $987M | $784M | $696M | $842M | $731M | $772M | $819M | $855M | |
| Other Non-cash | $265M | $350M | · | · | $73M | $-227M | $-225M | $40M | $-313M | · | |
| Operating Cash Flow | $3.76B | $2.45B | $1.61B | · | $1.14B | $1.96B | $1.22B | $789M | $952M | $1.10B | |
| CapEx | $1.19B | $1.08B | $1.10B | $764M | $822M | $916M | $1.06B | $1.04B | $898M | $634M | |
| Investing Cash Flow | · | · | · | · | $-1.19B | $-1.25B | $-1.03B | $-1.39B | $-687M | $-1.27B | |
| Financing Cash Flow | $-1.63B | $-1.01B | $-549M | · | $-623M | $-68M | $25M | $-73M | $-69M | $-48M | |
| Free Cash Flow | $2.57B | $1.37B | · | · | $197M | $1.04B | $120M | $-255M | $54M | · | |
| Levered FCF | $2.50B | $1.34B | · | · | $163M | $974M | $62M | $-238M | $-37M | · |
Rentowność
| Wskaźnik | Trend | 2025 | 2024 | 2023 | 2022 | 2021 | 2020 | 2019 | 2018 | 2017 | 2016 |
|---|---|---|---|---|---|---|---|---|---|---|---|
| ROA | 20.5% | 8.9% | 4.0% | -5.8% | 2.1% | 13.4% | 8.4% | -0.29% | 5.5% | · | |
| ROE | 31.0% | 14.7% | 7.0% | -9.8% | 3.4% | 22.5% | 14.6% | -0.52% | 10.2% | · | |
| ROIC | 29.5% | 15.1% | 7.7% | 0.58% | 3.3% | 21.8% | 13.9% | -1.0% | 7.8% | · |
Płynność i wypłacalność
| Wskaźnik | Trend | 2025 | 2024 | 2023 | 2022 | 2021 | 2020 | 2019 | 2018 | 2017 | 2016 |
|---|---|---|---|---|---|---|---|---|---|---|---|
| Current Ratio | 2.3 | 2.0 | 2.6 | 2.5 | 2.6 | 1.8 | 3.0 | 2.6 | 3.9 | · | |
| Quick Ratio | 0.7 | 0.3 | 0.7 | 0.8 | 0.8 | 0.5 | 0.7 | 0.5 | 1.2 | · | |
| Interest Coverage | 40.1 | 30.5 | 11.6 | 1.7 | 6.5 | 21.2 | 12.9 | 2.8 | 3.9 | · |
Efektywność
| Wskaźnik | Trend | 2025 | 2024 | 2023 | 2022 | 2021 | 2020 | 2019 | 2018 | 2017 | 2016 |
|---|---|---|---|---|---|---|---|---|---|---|---|
| Inventory Turnover | 2.6 | 2.7 | 2.8 | 2.6 | 2.4 | 1.8 | 2.0 | 2.5 | 2.5 | · |
Na akcję
| Wskaźnik | Trend | 2025 | 2024 | 2023 | 2022 | 2021 | 2020 | 2019 | 2018 | 2017 | 2016 |
|---|---|---|---|---|---|---|---|---|---|---|---|
| Cash Flow / Share | $3.07 | $1.98 | · | · | $0.89 | $1.54 | $0.97 | $0.63 | $0.76 | · | |
| EPS (TTM) | $1.95 | $0.77 | $0.34 | $-0.47 | $0.17 | $1.06 | $0.57 | $-0.02 | $0.35 | · |
Wycena (TTM)
| Wskaźnik | Trend | 2025 | 2024 | 2023 | 2022 | 2021 | 2020 | 2019 | 2018 | 2017 | 2016 |
|---|---|---|---|---|---|---|---|---|---|---|---|
| Net Income TTM | $2.39B | $949M | $416M | $-605M | $221M | $1.34B | $719M | $-24M | $445M | · | |
| P/E | 14.4 | 12.0 | 17.8 | -8.7 | 34.2 | 6.9 | 8.3 | -162.0 | 12.3 | · | |
| Earnings Yield | 6.9% | 8.3% | 5.6% | -11.5% | 2.9% | 14.4% | 12.0% | -0.62% | 8.1% | · |
Na akcję
| Wskaźnik | Trend | Q4 2016 | Q4 2015 | Q4 2014 | Q4 2013 | Q4 2012 | Q4 2011 | Q4 2010 | Q4 2009 | Q4 2008 | Q4 2007 | Q4 2006 | Q4 2005 | Q4 2004 | Q4 2003 | Q4 2002 |
|---|---|---|---|---|---|---|---|---|---|---|---|---|---|---|---|---|
| EPS (TTM) | $-0.08 | · | · | · | · | · | · | · | · | · | · | · | · | · | · |
Wycena (TTM)
| Wskaźnik | Trend | Q4 2016 | Q4 2015 | Q4 2014 | Q4 2013 | Q4 2012 | Q4 2011 | Q4 2010 | Q4 2009 | Q4 2008 | Q4 2007 | Q4 2006 | Q4 2005 | Q4 2004 | Q4 2003 | Q4 2002 |
|---|---|---|---|---|---|---|---|---|---|---|---|---|---|---|---|---|
| Net Income TTM | $-104M | · | · | · | · | · | · | · | · | · | · | · | · | · | · | |
| P/E | -38.9 | · | · | · | · | · | · | · | · | · | · | · | · | · | · | |
| Earnings Yield | -2.6% | · | · | · | · | · | · | · | · | · | · | · | · | · | · |
Najnowszy okres po lewej · wartości null pokazane jako ·
Sprawozdania finansowe Rachunek zysków i strat, bilans, przepływy pieniężne — roczne, ostatnie 5 lat
| Wskaźnik | 2025-12-31 | 2024-12-31 | 2023-12-31 | 2022-12-31 | 2021-12-31 |
|---|---|---|---|---|---|
| Zysk netto | $2.39B | $949M | $416M | $-605M | $221M |
| Rozwodniony EPS | $1.95 | $0.77 | $0.34 | $-0.47 | $0.17 |
| Wskaźnik | 2025-12-31 | 2024-12-31 | 2023-12-31 | 2022-12-31 | 2021-12-31 |
|---|---|---|---|---|---|
| Wskaźnik bieżący | 2.3 | 2.0 | 2.6 | 2.5 | 2.6 |
| Wskaźnik Szybkości | 0.7 | 0.3 | 0.7 | 0.8 | 0.8 |
| Wskaźnik | 2025-12-31 | 2024-12-31 | 2023-12-31 | 2022-12-31 | 2021-12-31 |
|---|---|---|---|---|---|
| Wolny przepływ pieniężny | $2.57B | $1.37B | · | · | $197M |
Właściciele instytucjonalni (13F) 707 emitentów · $19.1B łącznie · Na dzień 30 września 2026
Instytucje, które zgłaszają posiadanie tych akcji w swoich kwartalnych zgłoszeniach SEC Form 13F. Tylko pozycje długie; pojedynczy zgłaszający może pojawić się dwukrotnie dla oddzielnych transz opcji. Duże przeciwstawne pozycje put/call zazwyczaj odzwierciedlają działalność market-makingową lub zabezpieczone zapasy, a nie przekonanie kierunkowe.
| Nowe pozycje | Zamknięte pozycje | Zwiększone | Zmniejszony | Zmiana liczby akcji netto |
|---|---|---|---|---|
| 76 (-54 vs poprzedni kw.) | 90 (+31 vs poprzedni kw.) | 252 (+15 vs poprzedni kw.) | 242 (+12 vs poprzedni kw.) | +16.4M |
Porównano z Q1 2026. Zgłoszenia SEC Form 13F są wymagane w ciągu 45 dni od końca kwartału plus krótki bufor dla spóźnionych zgłoszeń — kwartały mieszczące się jeszcze w tym terminie są pomijane na rzecz ostatniej w pełni zgłoszonej pary.
| Instytucja | Wartość | Akcje | % z śledzonych 13F | Typ |
|---|---|---|---|---|
| VANGUARD GROUP INC | $1 433 344 952 | 50 887 386 | 7,52% | Akcje |
| VAN ECK ASSOCIATES CORP | $1 295 586 963 | 54 855 608 | 6,80% | Akcje |
| Boston Partners | $899 756 645 | 36 038 587 | 4,72% | Akcje |
| VANGUARD CAPITAL MANAGEMENT LLC | $789 855 012 | 33 359 590 | 4,14% | Akcje |
| ROYAL BANK OF CANADA | $779 032 000 | 32 981 828 | 4,09% | Akcje |
| ARROWSTREET CAPITAL, LIMITED PARTNERSHIP | $697 850 348 | 29 515 179 | 3,66% | Akcje |
| RENAISSANCE TECHNOLOGIES LLC | $584 529 171 | 24 747 213 | 3,07% | Akcje |
| FIL Ltd | $490 677 660 | 20 723 752 | 2,57% | Akcje |
| MACKENZIE FINANCIAL CORP | $436 040 296 | 12 985 119 | 2,29% | Akcje |
| GEODE CAPITAL MANAGEMENT, LLC | $370 263 818 | 14 840 976 | 1,94% | Akcje |
| BANK OF MONTREAL /CAN/ | $342 235 637 | 14 468 801 | 1,80% | Akcje |
| 1832 Asset Management L.P. | $337 595 653 | 14 292 788 | 1,77% | Akcje |
| NORGES BANK | $313 894 501 | 13 274 824 | 1,65% | Akcje |
| MORGAN STANLEY | $306 631 520 | 12 981 858 | 1,61% | Akcje |
| Man Group plc | $298 152 337 | 12 621 448 | 1,56% | Akcje |
| CIBC Asset Management Inc | $275 302 096 | 11 602 154 | 1,44% | Akcje |
| Connor, Clark & Lunn Investment Management Ltd. | $264 652 432 | 11 188 912 | 1,39% | Akcje |
| BANK OF AMERICA CORP /DE/ | $255 636 580 | 10 822 887 | 1,34% | Akcje |
| VANGUARD FIDUCIARY TRUST CO | $251 039 891 | 10 602 690 | 1,32% | Akcje |
| JPMORGAN CHASE & CO | $250 490 610 | 10 533 666 | 1,31% | Akcje |
| Legal & General Group Plc | $244 762 202 | 10 341 184 | 1,28% | Akcje |
| NATIONAL BANK OF CANADA /FI/ | $244 381 964 | 10 328 709 | 1,28% | Akcje |
| SCHRODER INVESTMENT MANAGEMENT GROUP | $238 085 019 | 10 079 806 | 1,25% | Akcje |
| Allianz Asset Management GmbH | $227 141 000 | 9 596 638 | 1,19% | Akcje |
| MANUFACTURERS LIFE INSURANCE COMPANY, THE | $222 973 542 | 9 435 939 | 1,17% | Akcje |
| DEUTSCHE BANK AG\ | $217 800 021 | 9 221 000 | 1,14% | Akcje |
| CANADA PENSION PLAN INVESTMENT BOARD | $217 190 177 | 9 182 216 | 1,14% | Akcje |
| GOLDMAN SACHS GROUP INC | $215 600 711 | 9 127 887 | 1,13% | Akcje |
| Ninety One UK Ltd | $207 995 648 | 8 614 109 | 1,09% | Akcje |
| AQR CAPITAL MANAGEMENT LLC | $205 351 902 | 8 777 685 | 1,08% | Akcje |
| Amundi | $197 878 133 | 8 376 494 | 1,04% | Akcje |
| Invesco Ltd. | $188 345 194 | 7 973 971 | 0,99% | Akcje |
| CIBC WORLD MARKET INC. | $186 048 766 | 7 864 688 | 0,98% | Akcje |
| FMR LLC | $168 707 882 | 7 130 430 | 0,89% | Akcje |
| AustralianSuper Pty Ltd | $166 115 355 | 7 022 910 | 0,87% | Akcje |
| TORONTO DOMINION BANK | $156 848 972 | 6 631 151 | 0,82% | Akcje |
| DIMENSIONAL FUND ADVISORS LP | $156 143 384 | 6 610 297 | 0,82% | Akcje |
| TD Asset Management Inc | $155 927 792 | 6 587 926 | 0,82% | Akcje |
| First Eagle Investment Management, LLC | $151 522 135 | 6 414 993 | 0,80% | Akcje |
| MASSACHUSETTS FINANCIAL SERVICES CO /MA/ | $150 902 208 | 5 199 404 | 0,79% | Akcje |
| BANK OF NOVA SCOTIA | $125 827 667 | 5 314 702 | 0,66% | Akcje |
| Vanguard Global Advisers, LLC | $121 079 963 | 5 113 822 | 0,64% | Akcje |
| AMERICAN CENTURY COMPANIES INC | $118 689 383 | 5 020 395 | 0,62% | Akcje |
| UBS Group AG | $116 009 631 | 4 911 500 | 0,61% | Akcje |
| TWO SIGMA INVESTMENTS, LP | $92 890 799 | 3 932 718 | 0,49% | Akcje |
| Swiss National Bank | $91 377 497 | 3 870 618 | 0,48% | Akcje |
| JANE STREET GROUP, LLC | $87 359 728 | 3 698 549 | 0,46% | Akcje |
| CI INVESTMENTS INC. | $84 137 581 | 3 562 133 | 0,44% | Akcje |
| BlackRock, Inc. | $83 289 851 | 3 526 243 | 0,44% | Akcje |
| Cape Ann Asset Management Ltd | $82 913 617 | 3 510 314 | 0,44% | Akcje |
Aktywiści i właściciele 5%+ 17 akcji
Inwestorzy, którzy złożyli SEC Schedule 13D — posiadanie beneficjentów powyżej 5% z zamiarem wpływania na emitenta (udziały aktywistów, kampanie zarządu, M&A). Każdy wiersz pokazuje najnowszy znany stan pozycji tego zgłaszającego.
| Zgłaszający | Złożono | Udział | Status | Cel | Zgłoszenie |
|---|---|---|---|---|---|
| Kinross Gold Corporation ×5 zgłoszenia | 30 marca 2011 | · | Pierwotne zgłoszenie | · | SEC |
| Niezgłoszona osoba raportująca | 14 kwietnia 2006 | · | Pierwotne zgłoszenie | M&A / sprzedaż | SEC |
| Niezgłoszona osoba raportująca | 28 listopada 2005 | · | Pierwotne zgłoszenie | Inwestycja pasywna | SEC |
| Niezgłoszona osoba raportująca | 26 października 2004 | · | Pierwotne zgłoszenie | · | SEC |
| Niezgłoszona osoba raportująca | 30 sierpnia 2004 | · | Pierwotne zgłoszenie | · | SEC |
| Niezgłoszona osoba raportująca | 5 sierpnia 2004 | · | Pierwotne zgłoszenie | · | SEC |
| Niezgłoszona osoba raportująca | 7 czerwca 2004 | · | Pierwotne zgłoszenie | · | SEC |
| Niezgłoszona osoba raportująca | 30 kwietnia 2004 | · | Pierwotne zgłoszenie | Inwestycja pasywna | SEC |
| Niezgłoszona osoba raportująca | 31 grudnia 2003 | · | Pierwotne zgłoszenie | · | SEC |
| Niezgłoszona osoba raportująca, Niezgłoszona osoba raportująca, Niezgłoszona osoba raportująca | 19 września 2003 | · | Pierwotne zgłoszenie | · | SEC |
| Niezgłoszona osoba raportująca, Niezgłoszona osoba raportująca, Niezgłoszona osoba raportująca | 16 września 2003 | · | Pierwotne zgłoszenie | · | SEC |
| Niezgłoszona osoba raportująca, Niezgłoszona osoba raportująca, Niezgłoszona osoba raportująca | 6 sierpnia 2003 | · | Pierwotne zgłoszenie | · | SEC |
| Niezgłoszona osoba raportująca, Niezgłoszona osoba raportująca, Niezgłoszona osoba raportująca | 10 lutego 2003 | · | Pierwotne zgłoszenie | Inwestycja pasywna | SEC |
| Niezgłoszona osoba raportująca | 26 kwietnia 2002 | · | Pierwotne zgłoszenie | · | SEC |
| Niezgłoszona osoba raportująca | 9 kwietnia 2002 | · | Pierwotne zgłoszenie | Kampania zarządu | SEC |
| Niezgłoszona osoba raportująca | 14 września 2001 | · | Pierwotne zgłoszenie | Kampania zarządu | SEC |
| Niezgłoszona osoba raportująca | 20 lipca 2001 | · | Pierwotne zgłoszenie | · | SEC |
Purpose is an automated classification of the filer's own stated purpose (SEC Item 4) — not investment advice. "—" means no clear purpose was stated or the text could not be classified.
Posiadanie ETF-ów Posiadane przez 27 funduszy ETF
Waga odzwierciedla wyłącznie bezpośrednie udziały kapitałowe (N-PORT); fundusze oparte na dźwigni lub instrumentach pochodnych mogą posiadać dodatkowe ekspozycje na swapy, które nie są pokazane.
| Fundusz | Waga | Jednostki | Na dzień | Źródło |
|---|---|---|---|---|
| MGNR · AMERICAN BEACON SELECT FUNDS | 2,76% | 1 006 954 NS | 31 lipca 2026 | N-PORT |
| ABLD · Abacus FCF ETF Trust | 2,32% | 92 972 NS | 31 lipca 2026 | N-PORT |
| NRES · DBX ETF Trust | 2,02% | 24 738 NS | 31 sierpnia 2026 | N-PORT |
| ABLG · Abacus FCF ETF Trust | 1,60% | 11 196 NS | 31 lipca 2026 | N-PORT |
| ICOW · Pacer Funds Trust | 1,17% | 918 496 NS | 31 lipca 2026 | N-PORT |
| DARP · Tidal Trust II | 1,08% | 15 535 NS | 31 lipca 2026 | N-PORT |
| BBCA · J.P. Morgan Exchange-Traded Fund Tr… | 0,90% | 4 249 615 NS | 31 lipca 2026 | N-PORT |
| IGE · iShares Trust | 0,84% | 232 961 SH | 11 września 2026 | Dziennie |
| GUNR · FlexShares Trust | 0,67% | 2 111 502 NS | 31 lipca 2026 | N-PORT |
| FEDM · FlexShares Trust | 0,56% | 19 257 NS | 31 lipca 2026 | N-PORT |
| DIHP · Dimensional ETF Trust | 0,52% | 1 435 670 NS | 31 lipca 2026 | N-PORT |
| PIEL · Pacer Funds Trust | 0,37% | 184 NS | 31 lipca 2026 | N-PORT |
| WLDR · Two Roads Shared Trust | 0,26% | 10 431 NS | 31 lipca 2026 | N-PORT |
| FTLS · First Trust Exchange-Traded Fund III | 0,26% | 276 036 NS | 31 lipca 2026 | N-PORT |
| DXIV · Dimensional ETF Trust | 0,21% | 18 797 NS | 31 lipca 2026 | N-PORT |
| DFAX · Dimensional ETF Trust | 0,19% | 994 129 NS | 31 lipca 2026 | N-PORT |
| DFIC · Dimensional ETF Trust | 0,19% | 1 201 837 NS | 31 lipca 2026 | N-PORT |
| FDEV · Fidelity Covington Trust | 0,17% | 21 233 NS | 31 lipca 2026 | N-PORT |
| SPWO · SP Funds Trust | 0,14% | 12 250 NS | 31 lipca 2026 | N-PORT |
| DFSI · Dimensional ETF Trust | 0,13% | 62 862 NS | 31 lipca 2026 | N-PORT |
| DFAI · Dimensional ETF Trust | 0,13% | 947 691 NS | 31 lipca 2026 | N-PORT |
| BKIE · BNY Mellon ETF Trust | 0,11% | 60 474 NS | 31 lipca 2026 | N-PORT |
| DEEF · DBX ETF Trust | 0,10% | 1 928 NS | 31 sierpnia 2026 | N-PORT |
| TLTD · FlexShares Trust | 0,09% | 25 410 NS | 31 lipca 2026 | N-PORT |
| GLBL · Pacer Funds Trust | 0,07% | 32 NS | 31 lipca 2026 | N-PORT |
| KOKU · DBX ETF Trust | 0,04% | 10 902 NS | 31 sierpnia 2026 | N-PORT |
| DFIV · Dimensional ETF Trust | 0,01% | 85 829 NS | 31 lipca 2026 | N-PORT |
KGC Konsensus analityków Bycze i niedźwiedzie opinie analityków, 12-miesięczny cel cenowy, potencjał wzrostu
12-miesięczny cel cenowy
10 analityków · 2026-10-25Średnia cel $31.00 +38,8%
Najnowsze wiadomości Najnowsze nagłówki wspominające o tej firmie
Moje wskaźniki Twoja osobista lista obserwowanych — wybrane wiersze z Pełnych Fundamentów
Wybierz wskaźniki, które są dla Ciebie ważne — kliknij + obok dowolnego wiersza w sekcji Pełne dane fundamentalne powyżej.
Twój wybór został zapisany i będzie Ci towarzyszył we wszystkich tickerach.