
STN Stantec Inc Common Stock
NYSE · Construction · Wyświetl na SEC EDGAR ↗ zamknij Paź 2, 2026 10-K/10-Q Lut 25, 2026STN Migawka akcji Cena, kapitalizacja rynkowa, P/E, EPS, ROE, zadłużenie/kapitał własny, zakres 52-tygodniowy
STN Wykres ceny akcji Dzienny OHLCV ze wskaźnikami technicznymi — przesuwaj, powiększaj i dostosowuj widok
Granularność słupków dostosowuje się do wybranego okresu — najedź kursorem na wykres, aby zobaczyć otwarcia/maksima/minima/zamknięcia dla danego słupka.
| Data ex-dywidendy | Podział | Typ |
|---|---|---|
| 17 listopada 2014 | 2-for-1 | Naprzód |
| 31 maja 2006 | 2-for-1 | Naprzód |
O Stantec Inc Common Stock Przegląd firmy z Wikipedii
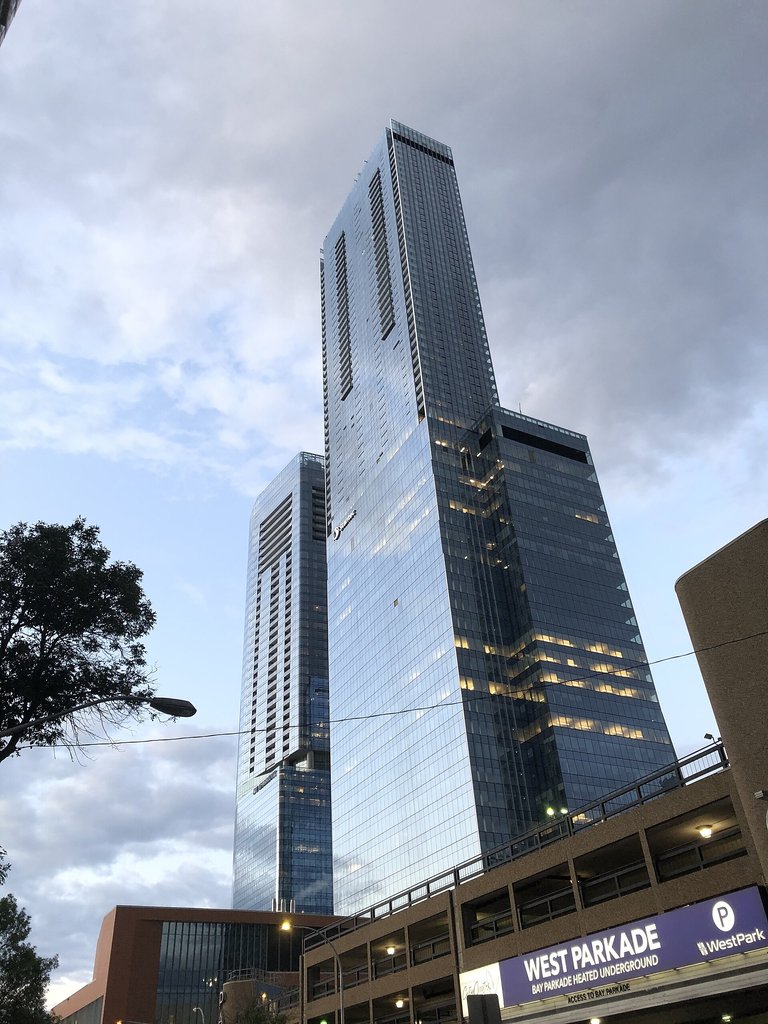
Stantec Inc. is a multinational professional services company in the design and consulting industry. The company was founded in 1954, as D. R. Stanley Associates in Edmonton, Alberta, Canada. Stantec provides professional consulting services in planning, engineering, architecture, interior design, landscape architecture, surveying, environmental sciences, project management, and project economics for infrastructure and facilities projects. The company provides services on projects around the world, with over 32,000 employees operating out of more than 450 locations in North America and across offices on six continents.
History
Don Stanley was the first Canadian to earn a Ph.D. in environmental engineering. Attending Harvard University on a Rockefeller Foundation scholarship, he earned his doctorate in 1952 and two years later founded D.R. Stanley & Associates, working as the sole proprietor out of a 250-square-foot (23 m2) office in Edmonton, Alberta. In 1955, Stanley hired a retired railway engineer, Herb Roblin, and a former chief bridge engineer for the provincial government, Louis Grimble. The firm was renamed Stanley, Grimble and Roblin Ltd. and with the two new partners’ transportation backgrounds, the firm diversified quickly.
The 1970s were boom years for Stanley Associates, but with the advance of the sharp recession of the 1980s, Stanley was ready to turn the company over to his second-in-command, Ron Triffo, in 1983. Triffo held a bachelor's degree in civil engineering from the University of Manitoba and an MSc in Engineering from the University of Illinois. In 1983, when Alberta's economy was struggling in response to the Canadian government's National Energy Program, Triffo became president and COO, while Stanley retained his role as CEO and chair. “We had cut our staff in half from 400 to about 200,” Triffo said. “We really started to think about a new way of doing things for the company. We were heavily involved in Alberta in a big, big way and therefore very vulnerable to the up and down cycles of the province. We decided we had to diversify the company in a discipline sense. We had to become more than just a civil engineering company and we had to diversify geographically.”
The company started its diversification by forming an urban development company under another name, IMC, which grew to 200 people. The diversification of Stanley Associates occurred by acquisition as well. The firm expanded into British Columbia and Saskatchewan and internationally, beginning a corporate move into central Canada. Stanley also made its first U.S. acquisition, in Phoenix, establishing a base for specialty services and future expansion in the US Southwest.
Following the success of IMC, Stanley Associates' various practices operated under boutique names, with as many as 20 different companies. By the early 1990s, the companies were placed under the umbrella of Stanley Technology Group, and most subsidiaries featured the name Stanley in their name. Staff numbers neared 900 and the firm went public on the Toronto Stock Exchange in 1994.
In 1998, Triffo stepped into the role of board chair, where he remained until retiring in 2011. Tony Franceschini, then vice president of the Commercial/Institutional sector and a board member, became president and CEO. Franceschini began his career with a consulting engineering firm in Toronto, Ontario in 1975 after graduating from the University of Waterloo with a degree in civil engineering, where he worked with Triffo.
The year Franceschini became president and CEO, Stantec had 2,000 employees in 40 offices and reported $185.5 million in gross revenue. “Our vision is to grow the company into a 10,000 employee, billion-dollar firm by 2008,” Franceschini said. Franceschini was instrumental in launching the new global, single-brand identity, Stantec, which enabled the company's services to be delivered through an integrated approach. “The move was a major achievement –– in a two-month period, we sought and received shareholder approval to change the name of over 30 companies,” says Franceschini.
Stantec was listed on the New York Stock Exchange in 2005. Franceschini retired in May 2009. Bob Gomes was appointed president and CEO. Like the Stantec's previous three presidents, Gomes is a licensed engineer who earned his degree in civil engineering from the University of Alberta and joined Stantec in 1988.
Between 2008 and 2011, gross revenue increased from $1.4 billion to $1.7 billion, the Stantec team grew from 8,000 staff to over 12,000 staff, the company acquired 16 firms, and strengthened its presence in markets across North America and internationally. According to Reuters, US Edition, "Its services are offered through more than 170 locations in North America and four locations internationally"
In May 2016, Stantec signed a definitive merger agreement with MWH Global, Inc. worth $1.04 billion CAD, making Stantec Inc. one of the world's top three global design firms. It expected to boost revenues by 60% a year, and increased the number of employees from 15,000 to 22,000.
Bob Gomes retired from Stantec in 2017. In January 2018, Gord Johnston became CEO of Stantec. Johnston has 30 years of private and public sector experience in the design and project management of infrastructure projects. Johnston has bachelor of science and master of engineering degrees in civil engineering from the University of Alberta, and is a registered professional engineer, certified project management professional, and Envision Sustainability Professional.
Growth
Stantec has 34,000 employees and 450 locations on six continents worldwide.
Acquisitions
Stantec has acquired over 130 firms since 1994. Acquisitions include MWH Global, Inc., KBR, Inc. Infrastructure Americas Division, Dessau engineering, Fay, Spofford & Thorndike, Sparling, Traffic Design Group, Cardno, ZETCON Engineering, and Hydrock.
In August 2025, the company completed the acquisition of Page, an American architecture firm.
Major projects
Panama Canal Expansion
Stantec Tower; 2014
Open Hearth Park; 2013
Telus Spark; 2011
Blatchford Community; 2010
Anthony Henday Drive Southeast; 2003-2007
Keystone Pipeline & Keystone Expansion Project; 2005
The Apollo – Saturn V Visitor Center; 1961-1972
Tesla Diner & Drive-In
Headquarters
On July 17, 2013, Stantec announced that it was going to initiate a request for proposal (RFP) to consolidate its Edmonton headquarters and other Edmonton offices into a single building. On August 26, 2014 the company announced that it had signed a 15-year lease with Edmonton's Arena District Partnership, a joint venture between the Katz Group and WAM Developments.
Stantec Tower is located in Edmonton's new downtown Ice District, and is a 66-storey, 250.8 metres (823 ft), mixed use skyscraper. It is the tallest building in Edmonton, and the tallest building in Western Canada and outside of Toronto.
Źródło: Wikipedia (Angielski), CC BY-SA 4.0 · Zobacz w Wikipedii ↗
Wyniki 10-letnie Trendy przychodów, zysku netto, marż i EPS
Wycena Wskaźniki P/E, P/S, P/B, EV/EBITDA — czy akcje są drogie, czy tanie?
| Wskaźnik | Trend 5-letni | STN | średnia z 5 lat | Mediana porównawcza | Werdykt |
|---|---|---|---|---|---|
| P/E | 22.5średnia z 5 lat ≈24.2 | ≈24.2 | · | · |
Mediana porównawcza jest obliczana na znormalizowanej podstawie dla każdej metryki i może nie zawsze odpowiadać podstawie TTM/MRQ pokazanej dla tej akcji.
Rentowność Marże brutto, operacyjne i netto; ROE, ROA, ROIC
| Wskaźnik | Trend 5-letni | STN | średnia z 5 lat | Mediana porównawcza | Werdykt |
|---|---|---|---|---|---|
| ROA | 6.4%średnia z 5 lat ≈5.6% | ≈5.6% | · | · | |
| ROE | 15.5%średnia z 5 lat ≈13.6% | ≈13.6% | · | · |
Zdrowie finansowe Dług, płynność, wypłacalność — siła bilansu
| Wskaźnik | Trend 5-letni | STN | średnia z 5 lat | Mediana porównawcza | Werdykt |
|---|---|---|---|---|---|
| Current Ratio (Wskaźnik bieżący) | 1.2średnia z 5 lat ≈1.3 | ≈1.3 | · | · | |
| Quick Ratio (Wskaźnik Szybkości) | 0.8średnia z 5 lat ≈0.8 | ≈0.8 | · | · |
Rozwój Wzrost przychodów, EPS i zysku netto: r/r, CAGR 3-letni, CAGR 5-letni
Za mało danych fundamentalnych, aby obliczyć tę grupę wskaźników.
Efektywność kapitałowa Rotacja aktywów, rotacja zapasów, rotacja należności
Za mało danych fundamentalnych, aby obliczyć tę grupę wskaźników.
wartość · ≈ średnia z 5 lat · mediana branżowa · werdykt względem mediany
Dywidendy Stopa dywidendy, wskaźnik wypłaty, historia dywidend, 5-letni CAGR
| Data ex-dywidendy | Kwota | Waluta | Stopa zwrotu |
|---|---|---|---|
| Wrz 29, 2026 | $0,17 | USD | ≈0.77% |
| Cze 30, 2026 | $0,17 | USD | ≈0.51% |
| Mar 31, 2026 | $0,18 | USD | ≈0.20% |
| Cze 30, 2025 | $0,16 | USD | ≈0.57% |
| Mar 28, 2025 | $0,16 | USD | ≈0.75% |
| Gru 31, 2024 | $0,15 | USD | ≈0.78% |
| Wrz 27, 2024 | $0,16 | USD | ≈0.76% |
| Cze 28, 2024 | $0,15 | USD | ≈0.72% |
| Mar 27, 2024 | $0,16 | USD | ≈0.71% |
| Gru 28, 2023 | $0,15 | USD | ≈0.73% |
| Wrz 28, 2023 | $0,14 | USD | ≈0.86% |
| Cze 29, 2023 | $0,15 | USD | ≈0.86% |
| Mar 30, 2023 | $0,14 | USD | ≈0.94% |
| Gru 29, 2022 | $0,13 | USD | ≈1.1% |
| Wrz 28, 2022 | $0,13 | USD | ≈1.2% |
| Cze 29, 2022 | $0,14 | USD | ≈1.2% |
| Mar 30, 2022 | $0,14 | USD | ≈1.1% |
| Gru 30, 2021 | $0,13 | USD | ≈0.94% |
| Wrz 28, 2021 | $0,13 | USD | ≈1.1% |
| Cze 29, 2021 | $0,13 | USD | ≈1.1% |
Historia zysków EPS faktyczny vs szacowany, zaskoczenie %, wskaźnik trafień, data następnych wyników
| Okres | Raport | EPS Actual | EPS Szacowany | Niespodzianka |
|---|---|---|---|---|
| 30 czerwca 2026 | $1.61 | $1.60 | 0.76% | |
| 31 marca 2026 | $1.33 | $1.31 | 1.9% | |
| 31 grudnia 2025 | $1.25 | $1.23 | 1.9% | |
| 30 września 2025 | $1.53 | $1.55 | -0.99% | |
| 30 czerwca 2025 | $1.36 | $1.38 | -1.1% | |
| 31 marca 2025 | $1.16 | $1.12 | 4.0% |
Pełne podstawowe wskaźniki Wszystkie wskaźniki roczne — rachunek zysków i strat, bilans, przepływy pieniężne
Rachunek zysków i strat
| Wskaźnik | Trend | 2025 | 2024 | 2023 | 2022 | 2021 | 2020 | 2019 | 2018 | 2017 | 2016 |
|---|---|---|---|---|---|---|---|---|---|---|---|
| Revenue | · | · | · | · | · | · | $4.83B | $4.28B | $4.03B | $4.30B | |
| Cost of Revenue | · | · | $2.32B | $2.04B | $1.67B | $1.75B | $1.70B | $1.54B | $1.41B | $1.42B | |
| Gross Profit | · | · | $2.74B | $2.42B | $1.96B | $1.93B | $2.01B | $1.82B | $1.76B | $1.68B | |
| SG&A Expense | $2.46B | $2.29B | $1.97B | $1.74B | $1.42B | $1.35B | $1.43B | $1.44B | $1.41B | $1.34B | |
| Interest Expense | $115M | $118M | $103M | $70M | $43M | $53M | $73M | $32M | $29M | $31M | |
| Interest Income | $15M | $14M | $12M | $6M | $5M | $4M | $4M | $3M | $3M | $3M | |
| Pretax Income | $630M | $465M | $408M | $325M | $263M | $217M | $266M | $226M | $264M | $181M | |
| Income Tax | $151M | $104M | $91M | $78M | $62M | $58M | $71M | $55M | $166M | $50M | |
| Net Income | $479M | $362M | $316M | $247M | $201M | $171M | $194M | $47M | $97M | $130M | |
| EPS (Basic) | $4.20 | $3.17 | $2.85 | $2.23 | $1.80 | $1.53 | $1.74 | · | $0.85 | $1.22 | |
| EPS (Diluted) | $4.20 | $3.17 | $2.85 | $2.22 | $1.80 | $1.53 | $1.74 | · | $0.85 | $1.22 | |
| Shares (Basic) | 114,066,995 | 114,066,995 | 111,228,491 | 110,936,481 | 111,242,658 | 111,553,711 | 111,550,424 | 113,733,118 | 113,991,507 | 107,006,168 | |
| Shares (Diluted) | 114,066,995 | 114,066,995 | 111,228,491 | 111,069,776 | 111,616,665 | 111,949,305 | 111,550,424 | 113,822,318 | 114,352,920 | 107,325,791 |
Bilans
| Wskaźnik | Trend | 2025 | 2024 | 2023 | 2022 | 2021 | 2020 | 2019 | 2018 | 2017 | 2016 |
|---|---|---|---|---|---|---|---|---|---|---|---|
| Cash & Equivalents | $394M | $216M | $194M | $140M | $184M | $279M | $208M | $176M | $235M | $207M | |
| Receivables | $1.31B | $1.32B | $1.06B | $1.03B | $824M | $738M | $818M | $878M | $816M | $806M | |
| Current Assets | $2.79B | $2.55B | $2.27B | $1.94B | $1.66B | $1.57B | $1.58B | $1.64B | $1.61B | $1.58B | |
| PP&E (Net) | $308M | $299M | $268M | $251M | $234M | $240M | $286M | $289M | $213M | $214M | |
| Goodwill | $3.22B | $2.71B | $2.07B | $2.35B | $2.18B | $1.67B | $1.65B | $1.62B | $1.56B | $1.83B | |
| Intangibles | $594M | $427M | $266M | $320M | $373M | $182M | $220M | $248M | $262M | $450M | |
| Total Assets | $7.96B | $6.96B | $5.77B | $5.65B | $5.23B | $4.39B | $4.56B | $4.01B | $3.88B | $4.28B | |
| Accounts Payable | $1.13B | $1.02B | $842M | $756M | $635M | $576M | $576M | $567M | $705M | $718M | |
| Current Liabilities | $2.27B | $1.98B | $1.62B | $1.41B | $1.18B | $987M | $1.01B | $894M | $1.16B | $1.07B | |
| Total Liabilities | $4.72B | $4.01B | $3.32B | $3.37B | $3.22B | $2.46B | $2.68B | $2.10B | $1.98B | $2.31B | |
| Retained Earnings | · | · | · | $1.15B | $1.04B | $959M | $918M | $851M | $947M | $918M | |
| Stockholders' Equity | $3.24B | $2.95B | $2.45B | $1.99B | $2.00B | $1.93B | $1.88B | $1.88B | $1.90B | $1.98B |
Przepływy pieniężne
| Wskaźnik | Trend | 2025 | 2024 | 2023 | 2022 | 2021 | 2020 | 2019 | 2018 | 2017 | 2016 |
|---|---|---|---|---|---|---|---|---|---|---|---|
| Operating Cash Flow | $863M | $603M | $520M | $304M | $397M | $604M | $452M | $173M | $264M | $286M | |
| CapEx | · | · | · | $68M | $46M | $31M | $57M | $125M | $59M | $58M | |
| Investing Cash Flow | $-534M | $-605M | $-202M | $-74M | $-765M | $-102M | $-135M | $-224M | $60M | $-1.14B | |
| Dividends Paid | $101M | $94M | $85M | $78M | $72M | $68M | $64M | $61M | $56M | $46M | |
| Financing Cash Flow | $-140M | $-152M | $-109M | $-297M | $276M | $-413M | $-286M | $-24M | $-281M | $995M | |
| Free Cash Flow | · | · | · | $236M | $351M | $573M | $396M | $48M | $202M | · | |
| Levered FCF | · | · | · | $183M | $319M | $534M | $342M | $24M | $192M | · |
Rentowność
| Wskaźnik | Trend | 2025 | 2024 | 2023 | 2022 | 2021 | 2020 | 2019 | 2018 | 2017 | 2016 |
|---|---|---|---|---|---|---|---|---|---|---|---|
| Gross Margin | · | · | · | · | · | · | 41.6% | 42.4% | 35.6% | · | |
| Net Margin | · | · | · | · | · | · | 4.0% | 1.1% | 1.9% | · | |
| Pretax Margin | · | · | · | · | · | · | 5.5% | 5.3% | 5.1% | · | |
| ROA | 6.4% | 5.7% | 5.8% | 4.5% | 4.2% | 3.8% | 4.5% | 1.2% | 2.4% | · | |
| ROE | 15.5% | 13.4% | 14.0% | 11.5% | 10.2% | 9.0% | 10.4% | 2.5% | 5.0% | · |
Płynność i wypłacalność
| Wskaźnik | Trend | 2025 | 2024 | 2023 | 2022 | 2021 | 2020 | 2019 | 2018 | 2017 | 2016 |
|---|---|---|---|---|---|---|---|---|---|---|---|
| Current Ratio | 1.2 | 1.3 | 1.4 | 1.4 | 1.4 | 1.6 | 1.6 | 1.9 | 1.4 | · | |
| Quick Ratio | 0.8 | 0.8 | 0.8 | 0.8 | 0.9 | 1.0 | 1.0 | 1.2 | 0.9 | · |
Efektywność
| Wskaźnik | Trend | 2025 | 2024 | 2023 | 2022 | 2021 | 2020 | 2019 | 2018 | 2017 | 2016 |
|---|---|---|---|---|---|---|---|---|---|---|---|
| Asset Turnover | · | · | · | · | · | · | 1.1 | 1.1 | 1.3 | · | |
| Receivables Turnover | · | · | · | · | · | · | 5.7 | 5.1 | 6.3 | · |
Na akcję
| Wskaźnik | Trend | 2025 | 2024 | 2023 | 2022 | 2021 | 2020 | 2019 | 2018 | 2017 | 2016 |
|---|---|---|---|---|---|---|---|---|---|---|---|
| Revenue / Share | · | · | · | · | · | · | $43.27 | $37.64 | $44.95 | · | |
| Cash Flow / Share | $7.56 | $5.29 | $4.90 | $2.74 | $3.56 | $5.39 | $4.06 | $1.52 | $2.31 | · | |
| EPS (TTM) | $4.20 | $3.17 | $2.85 | $2.22 | $1.80 | $1.53 | $1.74 | · | $0.85 | · |
Wycena (TTM)
| Wskaźnik | Trend | 2025 | 2024 | 2023 | 2022 | 2021 | 2020 | 2019 | 2018 | 2017 | 2016 |
|---|---|---|---|---|---|---|---|---|---|---|---|
| Revenue TTM | · | · | · | · | · | · | $4.83B | $4.28B | $4.03B | · | |
| Net Income TTM | $479M | $362M | $316M | $247M | $201M | $171M | $194M | $47M | $97M | · | |
| P/E | 22.5 | 24.7 | 28.1 | 21.6 | 31.2 | 21.2 | 16.3 | · | 32.9 | · | |
| Earnings Yield | 4.5% | 4.0% | 3.5% | 4.6% | 3.2% | 4.7% | 6.2% | · | 3.0% | · | |
| Payout Ratio | 21.1% | 26.0% | 25.6% | 31.7% | 36.0% | 39.7% | 32.9% | 129.3% | 57.2% | · | |
| Annual Payout | $101M | $94M | $85M | $78M | $72M | $68M | $64M | $61M | $56M | · |
Na akcję
| Wskaźnik | Trend | Q4 2024 | Q4 2021 | Q4 2018 | Q4 2016 | Q4 2015 | Q4 2014 | Q4 2013 | Q4 2012 | Q4 2011 | Q4 2010 | Q4 2009 | Q4 2008 | Q4 2007 | Q4 2006 | Q4 2005 |
|---|---|---|---|---|---|---|---|---|---|---|---|---|---|---|---|---|
| EPS (TTM) | $3.17 | $1.80 | · | $1.22 | · | · | · | · | · | · | · | · | · | · | · |
Wycena (TTM)
| Wskaźnik | Trend | Q4 2024 | Q4 2021 | Q4 2018 | Q4 2016 | Q4 2015 | Q4 2014 | Q4 2013 | Q4 2012 | Q4 2011 | Q4 2010 | Q4 2009 | Q4 2008 | Q4 2007 | Q4 2006 | Q4 2005 |
|---|---|---|---|---|---|---|---|---|---|---|---|---|---|---|---|---|
| Revenue TTM | · | · | $4.28B | $4.30B | · | · | · | · | · | · | · | · | · | · | · | |
| Net Income TTM | $362M | $201M | $47M | $130M | · | · | · | · | · | · | · | · | · | · | · | |
| P/E | 24.7 | 31.2 | · | 20.7 | · | · | · | · | · | · | · | · | · | · | · | |
| Earnings Yield | 4.0% | 3.2% | · | 4.8% | · | · | · | · | · | · | · | · | · | · | · | |
| Annual Payout | $94M | $72M | $61M | $46M | · | · | · | · | · | · | · | · | · | · | · |
Najnowszy okres po lewej · wartości null pokazane jako ·
Sprawozdania finansowe Rachunek zysków i strat, bilans, przepływy pieniężne — roczne, ostatnie 5 lat
| Wskaźnik | 2025-12-31 | 2024-12-31 | 2023-12-31 | 2023-01-01 | 2022-12-31 |
|---|---|---|---|---|---|
| Zysk netto | $479M | $362M | $316M | · | $247M |
| Rozwodniony EPS | $4.20 | $3.17 | $2.85 | · | $2.22 |
| Wskaźnik | 2025-12-31 | 2024-12-31 | 2023-12-31 | 2023-01-01 | 2022-12-31 |
|---|---|---|---|---|---|
| Wskaźnik bieżący | 1.2 | 1.3 | 1.4 | · | 1.4 |
| Wskaźnik Szybkości | 0.8 | 0.8 | 0.8 | · | 0.8 |
| Wskaźnik | 2025-12-31 | 2024-12-31 | 2023-12-31 | 2023-01-01 | 2022-12-31 |
|---|---|---|---|---|---|
| Wolny przepływ pieniężny | · | · | · | · | $236M |
Właściciele instytucjonalni (13F) 313 emitentów · $5.9B łącznie · Na dzień 30 września 2026
Instytucje, które zgłaszają posiadanie tych akcji w swoich kwartalnych zgłoszeniach SEC Form 13F. Tylko pozycje długie; pojedynczy zgłaszający może pojawić się dwukrotnie dla oddzielnych transz opcji. Duże przeciwstawne pozycje put/call zazwyczaj odzwierciedlają działalność market-makingową lub zabezpieczone zapasy, a nie przekonanie kierunkowe.
| Nowe pozycje | Zamknięte pozycje | Zwiększone | Zmniejszony | Zmiana liczby akcji netto |
|---|---|---|---|---|
| 29 (-24 vs poprzedni kw.) | 40 (+19 vs poprzedni kw.) | 129 (+21 vs poprzedni kw.) | 86 (-8 vs poprzedni kw.) | +1.6M |
Porównano z Q1 2026. Zgłoszenia SEC Form 13F są wymagane w ciągu 45 dni od końca kwartału plus krótki bufor dla spóźnionych zgłoszeń — kwartały mieszczące się jeszcze w tym terminie są pomijane na rzecz ostatniej w pełni zgłoszonej pary.
| Instytucja | Wartość | Akcje | % z śledzonych 13F | Typ |
|---|---|---|---|---|
| VANGUARD GROUP INC | $468 622 442 | 4 966 062 | 7,93% | Akcje |
| JARISLOWSKY, FRASER Ltd | $440 337 631 | 4 082 124 | 7,46% | Akcje |
| BANK OF MONTREAL /CAN/ | $339 614 643 | 4 928 863 | 5,75% | Akcje |
| 1832 Asset Management L.P. | $309 693 737 | 4 494 177 | 5,24% | Akcje |
| ALLIANCEBERNSTEIN L.P. | $286 461 360 | 3 315 525 | 4,85% | Akcje |
| VANGUARD CAPITAL MANAGEMENT LLC | $231 045 785 | 3 349 849 | 3,91% | Akcje |
| ROYAL BANK OF CANADA | $229 554 000 | 3 331 191 | 3,89% | Akcje |
| Fiera Capital Corp | $179 250 648 | 2 601 689 | 3,03% | Akcje |
| FMR LLC | $143 765 701 | 2 084 397 | 2,43% | Akcje |
| Pictet Asset Management Holding SA | $133 785 010 | 1 940 375 | 2,27% | Akcje |
| Man Group plc | $121 285 464 | 1 759 096 | 2,05% | Akcje |
| MORGAN STANLEY | $109 461 123 | 1 588 465 | 1,85% | Akcje |
| BANK OF AMERICA CORP /DE/ | $104 074 635 | 1 510 298 | 1,76% | Akcje |
| MANUFACTURERS LIFE INSURANCE COMPANY, THE | $98 395 875 | 1 429 426 | 1,67% | Akcje |
| GOLDMAN SACHS GROUP INC | $94 662 646 | 1 373 714 | 1,60% | Akcje |
| MACKENZIE FINANCIAL CORP | $93 684 366 | 957 722 | 1,59% | Akcje |
| Burgundy Asset Management Ltd. | $93 218 699 | 858 122 | 1,58% | Akcje |
| NORGES BANK | $90 932 019 | 1 319 706 | 1,54% | Akcje |
| Amundi | $86 775 077 | 1 050 103 | 1,47% | Akcje |
| GEODE CAPITAL MANAGEMENT, LLC | $84 290 535 | 1 216 558 | 1,43% | Akcje |
| FIRST TRUST ADVISORS LP | $79 524 417 | 1 154 036 | 1,35% | Akcje |
| CANADA PENSION PLAN INVESTMENT BOARD | $79 046 830 | 1 147 215 | 1,34% | Akcje |
| JANUS HENDERSON GROUP PLC | $77 331 856 | 903 925 | 1,31% | Akcje |
| BCV Asset Management Inc. | $72 447 124 | 1 048 820 | 1,23% | Akcje |
| VANGUARD FIDUCIARY TRUST CO | $69 812 631 | 1 012 188 | 1,18% | Akcje |
| NATIONAL BANK OF CANADA /FI/ | $64 914 389 | 943 197 | 1,10% | Akcje |
| MILLENNIUM MANAGEMENT LLC | $63 416 945 | 920 492 | 1,07% | Akcje |
| PRINCIPAL FINANCIAL GROUP INC | $62 391 405 | 904 905 | 1,06% | Akcje |
| JPMORGAN CHASE & CO | $57 966 397 | 839 971 | 0,98% | Akcje |
| TD Waterhouse Canada Inc. | $56 449 895 | 834 413 | 0,96% | Akcje |
| Legal & General Group Plc | $56 076 343 | 813 315 | 0,95% | Akcje |
| AQR CAPITAL MANAGEMENT LLC | $55 528 995 | 810 568 | 0,94% | Akcje |
| TORONTO DOMINION BANK | $52 553 150 | 762 717 | 0,89% | Akcje |
| TD Asset Management Inc | $51 062 626 | 740 596 | 0,86% | Akcje |
| TWO SIGMA INVESTMENTS, LP | $46 462 292 | 674 246 | 0,79% | Akcje |
| Clearbridge Investments, LLC | $43 865 630 | 636 564 | 0,74% | Akcje |
| Russell Investments Group, Ltd. | $41 080 333 | 595 582 | 0,70% | Akcje |
| Allianz Asset Management GmbH | $38 984 431 | 565 011 | 0,66% | Akcje |
| Alberta Investment Management Corp | $36 311 387 | 526 991 | 0,61% | Akcje |
| DIMENSIONAL FUND ADVISORS LP | $34 503 544 | 500 702 | 0,58% | Akcje |
| Vanguard Global Advisers, LLC | $33 483 354 | 485 463 | 0,57% | Akcje |
| CIBC WORLD MARKET INC. | $32 322 498 | 469 043 | 0,55% | Akcje |
| Waratah Capital Advisors Ltd. | $30 406 193 | 441 245 | 0,51% | Akcje |
| AXA Investment Managers S.A. | $30 404 020 | 282 041 | 0,51% | Akcje |
| Vontobel Holding Ltd. | $30 151 438 | 437 591 | 0,51% | Akcje |
| D. E. Shaw & Co., Inc. | $30 110 122 | 437 000 | 0,51% | Akcje |
| SCOTIA CAPITAL INC. | $27 445 339 | 399 160 | 0,46% | Akcje |
| Invesco Ltd. | $26 708 414 | 387 584 | 0,45% | Akcje |
| BlackRock, Inc. | $26 494 247 | 384 476 | 0,45% | Akcje |
| Qube Research & Technologies Ltd | $25 969 327 | 376 859 | 0,44% | Akcje |
Aktywiści i właściciele 5%+ 1 akcja
Inwestorzy, którzy złożyli SEC Schedule 13D — posiadanie beneficjentów powyżej 5% z zamiarem wpływania na emitenta (udziały aktywistów, kampanie zarządu, M&A). Każdy wiersz pokazuje najnowszy znany stan pozycji tego zgłaszającego.
| Zgłaszający | Złożono | Udział | Status | Cel | Zgłoszenie |
|---|---|---|---|---|---|
| STANTEC INC. | 19 kwietnia 2005 | · | Pierwotne zgłoszenie | M&A / sprzedaż | SEC |
Purpose is an automated classification of the filer's own stated purpose (SEC Item 4) — not investment advice. "—" means no clear purpose was stated or the text could not be classified.
Posiadanie ETF-ów Posiadane przez 34 fundusze ETF
Waga odzwierciedla wyłącznie bezpośrednie udziały kapitałowe (N-PORT); fundusze oparte na dźwigni lub instrumentach pochodnych mogą posiadać dodatkowe ekspozycje na swapy, które nie są pokazane.
| Fundusz | Waga | Jednostki | Na dzień | Źródło |
|---|---|---|---|---|
| PIO · Invesco Exchange-Traded Fund Trust … | 2,59% | 100 117 SH | 2 października 2026 | Dziennie |
| EFRA · iShares Trust | 2,19% | 1 735 SH | 11 września 2026 | Dziennie |
| PHO · Invesco Exchange-Traded Fund Trust | 0,68% | 191 265 SH | 2 października 2026 | Dziennie |
| PID · Invesco Exchange-Traded Fund Trust | 0,51% | 64 094 SH | 2 października 2026 | Dziennie |
| EWC · iShares, Inc. | 0,26% | 249 119 SH | 11 września 2026 | Dziennie |
| BBCA · J.P. Morgan Exchange-Traded Fund Tr… | 0,25% | 389 826 NS | 31 lipca 2026 | N-PORT |
| RODM · Lattice Strategies Trust | 0,18% | 42 272 NS | 31 lipca 2026 | N-PORT |
| PABD · iShares Trust | 0,18% | 8 332 SH | 11 września 2026 | Dziennie |
| VIGI · VANGUARD WHITEHALL FUNDS | 0,14% | 186 401 SH | 19 sierpnia 2026 | Dziennie |
| PDN · Invesco Exchange-Traded Fund Trust … | 0,14% | 7 136 SH | 2 października 2026 | Dziennie |
| DIHP · Dimensional ETF Trust | 0,09% | 79 580 NS | 31 lipca 2026 | N-PORT |
| DFSI · Dimensional ETF Trust | 0,08% | 12 922 NS | 31 lipca 2026 | N-PORT |
| DFIS · Dimensional ETF Trust | 0,05% | 42 320 NS | 31 lipca 2026 | N-PORT |
| DFIC · Dimensional ETF Trust | 0,05% | 97 992 NS | 31 lipca 2026 | N-PORT |
| SPWO · SP Funds Trust | 0,04% | 1 045 NS | 31 lipca 2026 | N-PORT |
| DFAX · Dimensional ETF Trust | 0,03% | 57 729 NS | 31 lipca 2026 | N-PORT |
| DFAI · Dimensional ETF Trust | 0,03% | 82 049 NS | 31 lipca 2026 | N-PORT |
| BKIE · BNY Mellon ETF Trust | 0,03% | 5 907 NS | 31 lipca 2026 | N-PORT |
| IGRO · iShares Trust | 0,03% | 5 234 SH | 10 września 2026 | Dziennie |
| IDEV · iShares Trust | 0,03% | 126 875 SH | 11 września 2026 | Dziennie |
| CRBN · iShares Trust | 0,02% | 4 085 SH | 11 września 2026 | Dziennie |
| ACWX · iShares Trust | 0,02% | 37 665 SH | 11 września 2026 | Dziennie |
| VXUS · VANGUARD STAR FUNDS | 0,02% | 1 680 912 SH | 19 sierpnia 2026 | Dziennie |
| VEU · VANGUARD INTERNATIONAL EQUITY INDEX… | 0,02% | 267 728 SH | 19 sierpnia 2026 | Dziennie |
| VEA · VANGUARD TAX-MANAGED FUNDS | 0,02% | 1 113 110 SH | 19 sierpnia 2026 | Dziennie |
| IMFL · Invesco Exchange-Traded Self-Indexe… | 0,02% | 3 056 SH | 2 października 2026 | Dziennie |
| IXUS · iShares Trust | 0,02% | 157 639 SH | 11 września 2026 | Dziennie |
| TLTD · FlexShares Trust | 0,02% | 1 488 NS | 31 lipca 2026 | N-PORT |
| VT · VANGUARD INTERNATIONAL EQUITY INDEX… | 0,01% | 101 462 SH | 19 sierpnia 2026 | Dziennie |
| URTH · iShares, Inc. | 0,01% | 10 611 SH | 10 września 2026 | Dziennie |
| TOK · iShares Trust | 0,01% | 295 SH | 10 września 2026 | Dziennie |
| ACWI · iShares Trust | 0,01% | 35 762 SH | 10 września 2026 | Dziennie |
| DXIV · Dimensional ETF Trust | 0,01% | 178 NS | 31 lipca 2026 | N-PORT |
| IFRA · iShares Trust | · | 180 948 SH | 11 września 2026 | Dziennie |
STN Konsensus analityków Bycze i niedźwiedzie opinie analityków, 12-miesięczny cel cenowy, potencjał wzrostu
Moje wskaźniki Twoja osobista lista obserwowanych — wybrane wiersze z Pełnych Fundamentów
Wybierz wskaźniki, które są dla Ciebie ważne — kliknij + obok dowolnego wiersza w sekcji Pełne dane fundamentalne powyżej.
Twój wybór został zapisany i będzie Ci towarzyszył we wszystkich tickerach.