
BN Клас A Brookfield Corporation Class A Limited Voting Shares
NYSE · Financial Services · Переглянути на SEC EDGAR ↗ закриття Жов 2, 2026 10-K/10-Q Бер 18, 2026BN Знімок акцій Ціна, ринкова капіталізація, P/E, EPS, ROE, борг/власний капітал, діапазон 52 тижнів
BN Графік ціни акцій Денні OHLCV з технічними індикаторами — панування, масштабування та налаштування вашого представлення
Гранулярність стовпчиків адаптується до вибраного періоду — наведіть курсор на графік, щоб побачити відкриття/максимум/мінімум/закриття для стовпчика.
| Дата екс-дивіденду | Спліт | Тип |
|---|---|---|
| 10 жовтня 2025 р. | 3-for-2 | Прямий |
| 12 грудня 2022 р. | 1237-for-1000 | Прямий |
| 02 квітня 2020 р. | 3-for-2 | Прямий |
| 20 червня 2016 р. | 127-for-125 | Прямий |
| 13 травня 2015 р. | 3-for-2 | Прямий |
| 15 квітня 2013 р. | 1033-for-1000 | Прямий |
| 01 травня 2012 р. | 883-for-786 | Прямий |
| 04 червня 2007 р. | 3-for-2 | Прямий |
| 28 квітня 2006 р. | 3-for-2 | Прямий |
| 02 червня 2004 р. | 3-for-2 | Прямий |
| 11 серпня 1997 р. | 3-for-2 | Прямий |
| 14 квітня 1986 р. | 2-for-1 | Прямий |
Про Brookfield Corporation Class A Limited Voting Shares Огляд компанії з Wikipedia
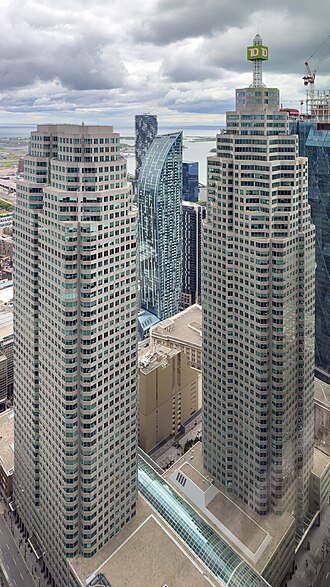
Brookfield Corporation is a Canadian multinational company that is one of the world's largest alternative investment management companies. It has over US$1 trillion of assets under management, much of which is workers’ deferred income from global public pension funds.
It focuses on direct control investments in real estate, renewable power, infrastructure, credit and private equity. The company invests in distressed securities through Oaktree Capital, which it bought in 2019. Brookfield Corporation's headquarters are in Toronto, while its primary subsidiary, Brookfield Asset Management, relocated to New York City in 2024.
The current Brookfield Corporation is the creation of the 1997 merger of Edper and Brascan. At its inception, the company was known as EdperBrascan, then changed its name to Brascan in 2000, and Brookfield Asset Management in 2005. In December 2022, the company renamed itself Brookfield Corporation (traded as BN) and spun off its asset management business as Brookfield Asset Management (traded as BAM).
In June 2024, Brookfield Asset Management ranked 24th in Private Equity International's PEI 300 ranking among the world's largest private equity firms.
As of 2026, Brookfield Corporation was ranked 224 on the Forbes Global 2000.
Predecessor companies
Brascan
The company was founded in 1899 as the São Paulo Tramway, Light and Power Company by William Mackenzie and Frederick Stark Pearson. It operated in the construction and management of electricity and transport infrastructure in Brazil.
In 1904, the Rio de Janeiro Tramway, Light and Power Company was founded by Mackenzie's group.
In 1912, Brazilian Traction, Light and Power Company was incorporated in Toronto as a public company to develop hydro-electric power operations and other utility services in Brazil, becoming a holding company for São Paulo Tramway Co. and Rio de Janeiro Tramway Co. In 1916, Great Lakes Power Company was incorporated to provide hydro-electric power in Sault Ste. Marie and the Algoma District in Ontario.
In 1966, Brazilian Traction, Light and Power Company changed its name to Brazilian Light and Power Company, and again in 1969, changed its name to Brascan Limited. Brascan is a portmanteau of “Brasil” and “Canada”.
During the 1970s, the company began to sell its Brazilian interests, and invested more heavily in industries such as real estate, timber and mining.
In 1979, the last of the company's Brazilian assets were transferred to Brazilian ownership (Eletropaulo and Light S.A.), the company meanwhile having diversified to other areas. The company provided electricity and tram services in São Paulo and Rio de Janeiro. After restructuring, the company's Brazilian portfolio operated as Light S.A., short for Brazilian Traction, Light and Power Co. Ltd.
In 1992, Brookfield and Johnson Controls was established through a merger in Canada of Brookfield and Johnson Controls—a building systems and facility management company that was founded in the late 19th century by Warren S. Johnson, whose invention of the first electric room thermostat helped launch the building control industry. By 2012, Brookfield and Johnson Controls became an established industry leader with 11,500 locations across Canada. In 2007, Brookfield Asset Management acquired the Multiplex, an Australian international construction contracting company founded in 1962 by John Roberts. which was valued at that time at approximately A$7.3 billion. It was renamed Brookfield Multiplex in 2016. In 2012 Brookfield Asset Management and Johnson Controls Global WorkPlace Solutions (GWS) merged to create Brookfield Johnson Controls.
Edper Investments
In 1959, Edper Investments was founded by brothers Peter and Edward Bronfman.
History of Brookfield
In April 1997, the Edper Group Ltd. announced its intention to merge with its subsidiary Brascan Ltd. At the time, Edper owned 47 per cent of Brascan shares. If approved, the merger would create a new $8 billion company. Robert Harding, president of Edper, stated that the intention of the merger was "furthering the simplification initiative that we started in 1993." On 10 July 1997, special meetings of both companies were held, and both groups of shareholders voted in favour of the merger. On 1 August 1997, the new EdperBrascan Corporation came into being as an Ontario corporation (number 1249197).
In 2002, Bruce Flatt was appointed CEO of Brascan.
In June 2005 Noranda, which was 41-percent-owned by Brascan, merged with Falconbridge Nickel Mines, and in August 2005 Brascan decided to sell its mineral holdings, to Xstrata.
In September 2005, after 37 years, Brascan Corp. was renamed to Brookfield Asset Management Inc. Between 2013 and 2018, the company and its subsidiaries invested approximately $10 billion in Brazilian energy, infrastructure and real estate developments, including acquisitions of oil pipelines from energy companies such as Petroleo Brasileiro SA.
In 2015, Brookfield Asset Management became the ultimate parent company of what is now Brookfield Global Integrated Solutions (BGIS), when it acquired control of Brookfield Johnson Controls from its joint venture partner, Milwaukee-based Johnson Controls. At that time, an activist investor had been putting pressure on Johnson Controls to divest of its real estate division. The facilities management business was renamed Brookfield Global Integrated Solutions (BGIS) as part of Brookfield's plan to establish a “leading global facilities management provider”. BGIS expanded rapidly following Brookfield's taking control of BGIS in 2015, In 2016, when BGIS acquired the US-based data centre facility management service—McKinstry FMS—which had over “350 engineers, technicians, planners and program managers”, BGIS became one of the largest facility management companies serving data centres in North America. By 2017, when Gord Hicks was named as Toronto-based BGIS’ CEO, the company had 7,000 staff members and 100 clients in the United States, the United Kingdom, Asia, and Canada, which included contracts with the Canadian federal government. By 2022, according to a Carleton University School of Public Policy and Administration analysis of federal government contracts for real estate management, the Government of Canada spent over $1 billion on contracts with BGIS in 2021–2022, representing the largest vendor contracts at that time. In 2019, Brookfield Asset Management sold its BGIS shares to CCMP Capital Advisors—an American private equity investment firm—for over CAD$1.3 billion with Hicks remaining as CEO. and was awarded the 2020 Private Equity Deal of the Year for the BGIS sale.
By 2018, Brookfield's major public subsidiaries included Brookfield Infrastructure Partners, Brookfield Renewable Partners, Brookfield Property Partners, and Brookfield Business Partners. In August 2018, Brookfield purchased Westinghouse Electric Company, a manufacturer of large nuclear reactors, out of bankruptcy for $4.6 billion.
On March 13, 2019, Brookfield Asset Management announced that it had agreed to buy most of Oaktree Capital Management for about $4.7 billion, creating one of the world's largest alternative money managers. On July 31, 2019, the sale of Vodafone New Zealand Limited to a consortium comprising Infratil Limited and Brookfield Asset Management Inc. was settled.
In a deal in October 2019, Brookfield bought The Leela Palaces, Hotels and Resorts, an Indian luxury hotel chain located in New Delhi, Bengaluru, Chennai, Udaipur, in a US$530 million settlement, marking the entry of Brookfield in India's hospitality market.
In 2020, in response to the COVID-19 pandemic, Brookfield's CEO Bruce Flatt assessed that the economic fallout was “much more manageable” than previous meltdowns.
In October 2020, Mark Carney, departing Governor of the Bank of England and future Prime Minister of Canada, became a vice-chair of Brookfield, leading the firm's environmental, social and governance (ESG) and impact fund investment strategy.
In November 2020, there were reports that Brookfield might partner with Rogers Communications to introduce condominiums to the site of the Rogers Centre baseball stadium, home of the Toronto Blue Jays of Major League Baseball, reducing the amount of space available for sport, but the partnership never transpired.
On April 25, 2022, it was announced the Brookfield and Simon Property Group were set to offer to buy Kohl's.
In November 2022, the Canada Pension Plan Investment Board (CPPIB) bought Brookfield's portfolio of Indian road assets for $1.2 billion.
In August 2022, Intel signed a $30 billion partnership with Brookfield to fund its recent factory expansions. As part of the deal, Intel would have a controlling stake by funding 51 percent of the cost of building new chip-making facilities in Chandler, Arizona, with Brookfield owning the remaining 49 percent stake, allowing the companies to split the revenue from those facilities.
On December 9, 2022, the company's name was changed from Brookfield Asset Management Inc. to Brookfield Corporation. Brookfield Corporation then spun-off 25% interest in their asset management business into the new publicly listed Brookfield Asset Management Ltd.
In April 2023, it was reported by Bloomberg that Brookfield Corporation had defaulted on $161.4 million worth of office building mortgages, mostly in the Washington D.C. area, due to high office vacancy and interest rates. Two months before, Brookfield defaulted on $784 million in mortgages for two Los Angeles office towers. It was suggested the defaults were a strategy to renegotiate commercial mortgages.
In November 2024, Brookfield committed an additional £900 million to support Canary Wharf Group months after its credit rating was cut to “junk” status. The value of CWG's office portfolio plunged by £1.5 billion to £4.27 billion after the COVID-19 pandemic caused a loss of tenants. Brookfield and Qatar Investment Authority had minority stakes in CWG until 2015 when the partners acquired 100% for an additional £2.6 billion.
Brookfield stated it was shifting towards residential properties and disposed of more than $10 billion of commercial properties from 2020 to 2022. In December 2024, Brookfield bought US student-housing communities for $893 million, eyeing communities that had growing student enrollment and limited supply. Brookfield also purchased, or was negotiating a $5 billion deal to obtain North American residential assets.
In January 2025, according to The Globe and Mail, it was announced that Brookfield had bought out its partners, CPPIB and Alberta Investment Management Corporation (AIMCo), in the Maritime Life Building in Toronto, which had been on the market for over two years without receiving a suitable offer.
In July 2025, Brookfield Wealth Solutions agreed to acquire Just Group, a UK-based financial services company, for $3.18 billion. The deal was part of Brookfield's planned expansion into the UK pension risk market.
In February 2026, Brookfield announced the promotion of Connor Teskey to Chief Executive of its asset management arm, as part of its broader succession planning for long-term Chief Executive Bruce Flatt.
Controversies
Bribery
In 2013, a Brazilian prosecutor filed charges against the company's local division, alleging the company paid bribes to local officials, which is also a violation of U.S. federal criminal law. The bribes were allegedly used to pave the way for Brookfield to build a shopping center in São Paulo. The U.S. Securities and Exchange Commission also opened a formal investigation into the company about the bribery charges. The company denied the charges. The U.S. Department of Justice also opened a criminal investigation into the company regarding these allegations, and did not end up making any arrests. According to the Stanford Law School Foreign Corrupt Practices Act Clearinghouse, which studied the case, the investigation and filing of charges was initiated by a whistleblower and anonymous tip. Later it was revealed that the whistleblower was the former CFO of a Brookfield subsidiary. She claims she was fired for refusing to participate in Brookfield's bribery scheme. The company disclosed the investigations on several 6-K forms between 2013 and 2015.
Circular cash flows
A March 2024 article in the Financial Times criticized Brookfield for its complex structure and its circular flows of cash after buying and selling multiple properties to itself at high, pre-pandemic valuations. These transactions were said to mask a $2 billion loss in its commercial real estate portfolio while boosting Brookfield's “distributable earnings,” a metric that the Financial Times called non-standard. Brookfield replied that there is nothing deceptive in its financial reporting and that the newspaper “willfully mischaracterized” its business.
Civil lawsuits and public reactions
In September 2010, a group called Birch Mountain Shareholders for Justice filed a lawsuit with the Ontario Superior Court of Justice against Brookfield Asset Management, challenging an acquisition and transfer of assets. Birch Mountain had run into financial troubles and accused Brookfield of financial engineering that resulted in Brookfield acquiring the company's $1.6 billion limestone quarry for $50 million. According to Birch Mountain, Brookfield had made use of death spiral financing and insider trading. After five years of litigation the case was dismissed, based on the fact that Birch Mountain had failed to present credible evidence. In May 2015, the plaintiffs filed a notice of appeal, but their case was likewise dismissed two years later.
In 2009, Brookfield sued financial and insurance giant American International Group (AIG) in a Manhattan federal court, alleging that AIG's collapse caused default provisions in interest-rate swaps. The suit stemmed from AIG's acceptance of a $182.3 billion bailout package from the federal government, which Brookfield argued overturned AIG's bankruptcy protection. The insurance firm countersued, claiming that Brookfield was trying to get out of its $1.5 billion debt to AIG. The litigation ended with Brookfield paying $905 million to settle the lawsuit.
In March 2013, the Southern Investigative Reporting Foundation called into question Brookfield's makeup. The analysis written by Roddy Boyd accused the company of using a pyramidal control structure, alleging that a small group of shareholders hold outsized power and may easily use the capital of other investors without risking their own.
In August 2018, Brookfield signed a 99-year lease on the financially troubled 666 Fifth Avenue (later renamed 660 Fifth Avenue) skyscraper in New York City, of Donald Trump's son-in-law Jared Kushner. The deal raised suspicions that the Qatar Investment Authority, a major investor in Brookfield, was attempting to influence the first Trump administration.
Finances
For the fiscal year 2018, Brookfield Asset Management reported earnings of US$3.584 billion, with an annual revenue of $56.771 billion, an increase of 39.2% over the previous fiscal cycle. Brookfield Asset Management's shares traded at over $38 per share, and its market capitalization was valued at over $40.8 billion in November 2018.
Leadership
Chief Executive Officer
Jack Lynn Cockwell, 1 August 1997 – February 2002
James Bruce Flatt, February 2002 – present
President
Jack Lynn Cockwell, 1 August 1997 – February 2002
James Bruce Flatt, February 2002 – 2005
Nicholas Howard Goodman, 12 December 2022 – present
Chairman of the Board
Robert James Harding, 1 August 1997 – 5 August 2010
Francis Joseph McKenna, 5 August 2010 – present
Джерело: Wikipedia (Англійська), CC BY-SA 4.0 · Переглянути на Wikipedia ↗
10-річна ефективність Тренди виручки, чистого прибутку, маржі та EPS
Оцінка Співвідношення P/E, P/S, P/B, EV/EBITDA — акція дорога чи дешева?
| Метрика | 5-річний тренд | BN | середнє за 5 років | Медіана аналогів | Висновок |
|---|---|---|---|---|---|
| P/E | 93.7середнє за 5 років ≈72.0 | ≈72.0 | · | · |
Медіана аналогічних компаній розраховується на стандартизованій основі для кожного показника і може не завжди відповідати базі TTM/MRQ, показаній для цієї акції.
Прибутковість Валова, операційна та чиста маржа; ROE, ROA, ROIC
| Метрика | 5-річний тренд | BN | середнє за 5 років | Медіана аналогів | Висновок |
|---|---|---|---|---|---|
| EBITDA Margin (Маржа EBITDA) | 13.8%середнє за 5 років ≈10.3% | ≈10.3% | · | · | |
| Net Profit Margin (Маржа чистого прибутку) | 1.7%середнє за 5 років ≈2.2% | ≈2.2% | · | · | |
| ROA | 0.26%середнє за 5 років ≈0.44% | ≈0.44% | · | · | |
| ROE | 0.79%середнє за 5 років ≈1.3% | ≈1.3% | · | · |
Фінансове здоровʼя Борг, ліквідність, платоспроможність — міцність балансу
Ще недостатньо фундаментальних даних для обчислення цієї групи коефіцієнтів.
Зростання Зростання виручки, EPS та чистого прибутку: рік до року, 3-річний CAGR, 5-річний CAGR
Ще недостатньо фундаментальних даних для обчислення цієї групи коефіцієнтів.
Ефективність капіталу Оборотність активів, оборотність запасів, оборотність дебіторської заборгованості
| Метрика | 5-річний тренд | BN | середнє за 5 років | Медіана аналогів | Висновок |
|---|---|---|---|---|---|
| Asset Turnover (Оборотність активів) | 0.1середнє за 5 років ≈0.2 | ≈0.2 | · | · | |
| Inventory Turnover (Оборотність запасів) | 5.0середнє за 5 років ≈6.0 | ≈6.0 | · | · | |
| Receivables Turnover (Оборотність дебіторської заборгованості) | 3.5середнє за 5 років ≈4.6 | ≈4.6 | · | · |
значення · ≈ середнє за 5 років · медіана галузі · вердикт відносно медіани
Дивіденди Дивідендна дохідність, коефіцієнт виплат, історія дивідендів, 5-річний CAGR
| Дата екс-дивіденду | Сума | Валюта | Дохідність |
|---|---|---|---|
| Вер 14, 2026 | $0,07 | USD | ≈0.72% |
| Чер 15, 2026 | $0,07 | USD | ≈0.57% |
| Бер 17, 2026 | $0,07 | USD | ≈0.63% |
| Гру 16, 2025 | $0,06 | USD | ≈0.53% |
| Вер 12, 2025 | $0,06 | USD | ≈0.52% |
| Чер 13, 2025 | $0,06 | USD | ≈0.59% |
| Бер 14, 2025 | $0,06 | USD | ≈0.65% |
| Гру 16, 2024 | $0,05 | USD | ≈0.54% |
| Вер 12, 2024 | $0,05 | USD | ≈0.63% |
| Чер 13, 2024 | $0,05 | USD | ≈0.73% |
| Бер 12, 2024 | $0,05 | USD | ≈0.69% |
| Лис 29, 2023 | $0,05 | USD | ≈0.79% |
| Сер 30, 2023 | $0,05 | USD | ≈0.95% |
| Тра 30, 2023 | $0,05 | USD | ≈1.2% |
| Лют 27, 2023 | $0,05 | USD | ≈1.6% |
| Лис 29, 2022 | $0,08 | USD | ≈1.6% |
| Сер 30, 2022 | $0,08 | USD | ≈1.4% |
| Тра 31, 2022 | $0,08 | USD | ≈1.3% |
| Тра 27, 2022 | $0,08 | USD | ≈1.1% |
| Лют 25, 2022 | $0,08 | USD | ≈0.97% |
Історія прибутків EPS фактичний проти прогнозу, сюрприз %, коефіцієнт перевищення, дата наступного звіту про прибутки
| Період | Звіт | EPS (факт) | EPS прогноз | Сюрприз |
|---|---|---|---|---|
| 30 червня 2026 р. | Сер 13, 2026 | $0.66 | $0.67 | -1.0% |
| 31 березня 2026 р. | Тра 14, 2026 | $0.66 | $0.64 | 2.9% |
| 31 грудня 2025 р. | $0.67 | $0.62 | 7.4% | |
| 30 вересня 2025 р. | $0.63 | $0.59 | 7.6% | |
| 30 червня 2025 р. | $0.59 | $0.60 | -2.4% | |
| 31 березня 2025 р. | $0.65 | $0.62 | 6.2% |
Повні фундаментальні показники Усі показники за роками — звіт про прибутки та збитки, баланс, рух грошових коштів
Звіт про прибутки та збитки
| Метрика | Тенденція | 2025 | 2024 | 2023 | 2022 | 2021 | 2020 | 2019 | 2018 | 2017 |
|---|---|---|---|---|---|---|---|---|---|---|
| Revenue | $75.10B | $86.01B | $95.92B | $92.77B | $75.73B | $62.75B | $67.83B | $56.77B | $40.79B | |
| Cost of Revenue | $28.35B | $40.12B | $52.22B | $54.04B | $44.15B | $35.15B | $41.46B | $37.51B | $26.46B | |
| SG&A Expense | $5.13B | $4.93B | $5.35B | $3.93B | $3.20B | $2.86B | $2.61B | $1.76B | $1.34B | |
| Interest Expense | · | · | · | $10.70B | $7.60B | $7.21B | $7.23B | $4.85B | $3.61B | |
| Income Tax | $1.14B | $982M | $1.01B | $1.47B | $2.32B | $837M | $495M | $-248M | $613M | |
| Net Income | $1.31B | $641M | $1.13B | $2.06B | $3.97B | $-134M | $2.81B | $3.58B | $1.46B | |
| EPS (Basic) | $0.51 | $0.21 | $0.62 | $1.22 | $2.47 | $-0.12 | $1.78 | $3.47 | $1.37 | |
| EPS (Diluted) | $0.49 | $0.20 | $0.61 | $1.19 | $2.39 | $-0.12 | $1.73 | $3.40 | $1.34 | |
| Shares (Basic) | 2,247,400,000 | 2,267,300,000 | 1,558,500,000 | 1,567,500,000 | 1,536,500,000 | 1,511,400,000 | 1,452,900,000 | 957,600,000 | 957,600,000 | |
| Shares (Diluted) | 2,367,800,000 | 2,376,800,000 | 1,588,200,000 | 1,608,200,000 | 1,586,900,000 | 1,511,400,000 | 1,488,400,000 | 977,400,000 | 977,400,000 | |
| EBITDA | $10.38B | $9.74B | $9.07B | $7.68B | $6.44B | $5.79B | $4.88B | $3.10B | $2.35B |
Баланс
| Метрика | Тенденція | 2025 | 2024 | 2023 | 2022 | 2021 | 2020 | 2019 | 2018 | 2017 |
|---|---|---|---|---|---|---|---|---|---|---|
| Cash & Equivalents | $10.90B | $10.50B | $8.80B | $12.00B | $10.80B | $8.20B | $5.70B | $7.70B | $4.50B | |
| Receivables | $22.77B | $20.28B | $20.26B | $19.49B | $16.10B | $14.19B | $13.86B | $11.91B | $8.49B | |
| Inventory | $5.92B | $5.42B | $7.06B | $9.11B | $8.56B | $6.34B | $7.05B | $4.58B | $3.58B | |
| Current Assets | · | · | · | · | · | · | · | · | $9.64B | |
| PP&E (Net) | $165.99B | $153.02B | $147.62B | $124.27B | $115.49B | $100.01B | $89.26B | $67.29B | $53.01B | |
| Goodwill | $43.35B | $35.73B | $34.91B | $28.66B | $20.23B | $14.71B | $14.55B | $8.81B | $5.32B | |
| Intangibles | $38.50B | $36.07B | $38.99B | $38.41B | $30.61B | $24.66B | $27.71B | $18.76B | $14.24B | |
| Total Assets | $518.97B | $490.42B | $490.10B | $441.28B | $391.00B | $343.70B | $323.97B | $256.28B | $192.72B | |
| Accounts Payable | $32.29B | $30.12B | $33.41B | $33.57B | $29.14B | $25.86B | $23.21B | $14.34B | $11.15B | |
| Current Liabilities | · | · | · | · | · | · | · | · | $10.31B | |
| Total Liabilities | $352.78B | $325.04B | $321.85B | $299.39B | $256.26B | $221.05B | $207.12B | $159.13B | $112.85B | |
| Stockholders' Equity | $166.19B | $165.38B | $168.24B | $141.89B | $134.74B | $122.64B | $116.85B | $97.15B | $79.87B |
Грошовий потік
| Метрика | Тенденція | 2025 | 2024 | 2023 | 2022 | 2021 | 2020 | 2019 | 2018 | 2017 |
|---|---|---|---|---|---|---|---|---|---|---|
| D&A | $10.38B | $9.74B | $9.07B | $7.68B | $6.44B | $5.79B | $4.88B | $3.10B | $2.35B | |
| Other Non-cash | $-728M | $-2.81B | $-3.74B | $-988M | $-2.53B | $2.68B | $-1.35B | $-1.53B | $198M | |
| Operating Cash Flow | $10.96B | $7.57B | $6.47B | $8.75B | $7.87B | $8.34B | $6.33B | $5.16B | $4.00B | |
| CapEx | $14.75B | $11.17B | $8.07B | $7.24B | $6.88B | $4.01B | $3.05B | $1.96B | $1.69B | |
| Investing Cash Flow | $-31.78B | $-29.96B | $-29.76B | $-39.65B | $-21.05B | $-13.87B | $-36.67B | $-19.83B | $-11.39B | |
| Financing Cash Flow | $21.69B | $26.90B | $19.93B | $32.46B | $16.26B | $8.70B | $28.75B | $18.14B | $8.19B | |
| Free Cash Flow | $-3.79B | $-3.60B | $-1.60B | $1.51B | $993M | $4.33B | $3.27B | $3.20B | $2.31B |
Прибутковість
| Метрика | Тенденція | 2025 | 2024 | 2023 | 2022 | 2021 | 2020 | 2019 | 2018 | 2017 |
|---|---|---|---|---|---|---|---|---|---|---|
| Net Margin | 1.7% | 0.75% | 1.2% | 2.2% | 5.2% | -0.21% | 4.1% | 6.3% | 3.6% | |
| EBITDA Margin | 13.8% | 11.3% | 9.5% | 8.3% | 8.5% | 9.2% | 7.2% | 5.5% | 5.8% | |
| ROA | 0.26% | 0.13% | 0.24% | 0.49% | 1.1% | -0.04% | · | 1.6% | 0.83% | |
| ROE | 0.79% | 0.38% | 0.73% | 1.5% | 3.1% | -0.11% | · | 4.0% | 2.0% |
Ліквідність та платоспроможність
| Метрика | Тенденція | 2025 | 2024 | 2023 | 2022 | 2021 | 2020 | 2019 | 2018 | 2017 |
|---|---|---|---|---|---|---|---|---|---|---|
| Current Ratio | · | · | · | · | · | · | · | · | 0.9 | |
| Quick Ratio | · | · | · | · | · | · | · | · | 1.3 |
Ефективність
| Метрика | Тенденція | 2025 | 2024 | 2023 | 2022 | 2021 | 2020 | 2019 | 2018 | 2017 |
|---|---|---|---|---|---|---|---|---|---|---|
| Asset Turnover | 0.1 | 0.2 | 0.2 | 0.2 | 0.2 | 0.2 | · | 0.3 | 0.2 | |
| Inventory Turnover | 5.0 | 6.4 | 6.5 | 6.1 | 5.9 | 5.2 | · | 9.2 | 8.1 | |
| Receivables Turnover | 3.5 | 4.2 | 4.8 | 5.2 | 5.0 | 4.5 | · | 5.6 | 5.4 |
На акцію
| Метрика | Тенденція | 2025 | 2024 | 2023 | 2022 | 2021 | 2020 | 2019 | 2018 | 2017 |
|---|---|---|---|---|---|---|---|---|---|---|
| Revenue / Share | $31.72 | $54.28 | $60.40 | $57.69 | $47.72 | $41.52 | $68.35 | $58.08 | · | |
| Cash Flow / Share | $4.63 | $4.78 | $4.07 | $5.44 | $4.96 | $5.52 | $6.38 | $5.28 | · | |
| EPS (TTM) | $0.49 | $0.20 | $0.61 | $1.19 | $2.39 | $-0.12 | $1.73 | $3.40 | $1.34 |
Оцінка (TTM)
| Метрика | Тенденція | 2025 | 2024 | 2023 | 2022 | 2021 | 2020 | 2019 | 2018 | 2017 |
|---|---|---|---|---|---|---|---|---|---|---|
| Revenue TTM | $75.10B | $86.01B | $95.92B | $92.77B | $75.73B | $62.75B | $67.83B | $56.77B | $40.79B | |
| Net Income TTM | $1.31B | $641M | $1.13B | $2.06B | $3.97B | $-134M | $2.81B | $3.58B | $1.46B | |
| P/E | 93.7 | 191.5 | 43.8 | 17.6 | 13.6 | -184.1 | 11.9 | 4.0 | 11.6 | |
| Earnings Yield | 1.1% | 0.52% | 2.3% | 5.7% | 7.3% | -0.54% | 8.4% | 24.9% | 8.6% |
На акцію
| Метрика | Тенденція | Q4 2020 | Q4 2017 | Q4 2016 | Q4 2015 | Q4 2014 | Q4 2013 | Q4 2012 | Q4 2011 | Q4 2010 | Q4 2009 | Q4 2006 | Q4 2005 | Q4 2004 | Q4 2003 | Q4 2002 | Q4 2001 |
|---|---|---|---|---|---|---|---|---|---|---|---|---|---|---|---|---|---|
| EPS (TTM) | $-0.12 | $1.34 | $1.55 | · | · | · | · | · | · | · | · | · | · | · | · | · |
Оцінка (TTM)
| Метрика | Тенденція | Q4 2020 | Q4 2017 | Q4 2016 | Q4 2015 | Q4 2014 | Q4 2013 | Q4 2012 | Q4 2011 | Q4 2010 | Q4 2009 | Q4 2006 | Q4 2005 | Q4 2004 | Q4 2003 | Q4 2002 | Q4 2001 |
|---|---|---|---|---|---|---|---|---|---|---|---|---|---|---|---|---|---|
| Revenue TTM | $62.75B | $40.79B | $24.41B | · | · | · | · | · | · | · | · | · | · | · | · | · | |
| Net Income TTM | $-134M | $1.46B | $1.65B | · | · | · | · | · | · | · | · | · | · | · | · | · | |
| P/E | -184.1 | 11.6 | 7.6 | · | · | · | · | · | · | · | · | · | · | · | · | · | |
| Earnings Yield | -0.54% | 8.6% | 13.2% | · | · | · | · | · | · | · | · | · | · | · | · | · |
Найновіший період ліворуч · нульові значення показані як ·
Фінансова звітність Звіт про прибутки та збитки, баланс, рух грошових коштів — річні, за останні 5 років
| Метрика | 2025-12-31 | 2024-12-31 | 2023-12-31 | 2022-12-31 | 2021-12-31 |
|---|---|---|---|---|---|
| Виручка | $75.10B | $86.01B | $95.92B | $92.77B | $75.73B |
| Чистий прибуток | $1.31B | $641M | $1.13B | $2.06B | $3.97B |
| Розбавлений EPS | $0.49 | $0.20 | $0.61 | $1.19 | $2.39 |
Ще недостатньо фундаментальних даних для побудови цього звіту.
| Метрика | 2025-12-31 | 2024-12-31 | 2023-12-31 | 2022-12-31 | 2021-12-31 |
|---|---|---|---|---|---|
| Вільний грошовий потік | $-3.79B | $-3.60B | $-1.60B | $1.51B | $993M |
Інституційні власники (13F) 1 007 подавачів звітності · $71.8B всього · Станом на 30 вересня 2026 р.
Інституційні інвестори, які звітують про володіння цими акціями у своїй квартальній формі SEC 13F. Тільки довгі позиції; один подавець звітності може з'явитися двічі для окремих опціонних контрактів. Великі протилежні опціонні позиції (пут/кол) зазвичай відображають маркет-мейкінг або хеджування запасів, а не спрямованість переконань.
| Нові позиції | Закриті позиції | Збільшено | Зменшено | Зміна чистих акцій |
|---|---|---|---|---|
| 100 (-6 проти попереднього кв.) | 63 (-25 проти попереднього кв.) | 309 (-24 проти попереднього кв.) | 325 (+43 проти попереднього кв.) | +25.3M |
Порівняно з Q1 2026. Звіти SEC Form 13F подаються протягом 45 днів після закінчення кварталу плюс невеликий буфер для тих, хто подає із запізненням — квартали, що ще знаходяться в цьому вікні, пропускаються на користь останньої повністю звітної пари.
| Інституційний інвестор | Вартість | Акції | % від відстежуваного 13F | Тип |
|---|---|---|---|---|
| Partners Value Investments L.P. | $7 726 079 623 | 181 405 955 | 10,76% | Акції |
| ROYAL BANK OF CANADA | $4 930 098 000 | 115 757 146 | 6,86% | Акції |
| VANGUARD GROUP INC | $4 228 914 755 | 92 103 120 | 5,89% | Акції |
| Capital World Investors | $3 351 399 738 | 78 684 708 | 4,67% | Акції |
| VANGUARD CAPITAL MANAGEMENT LLC | $2 618 843 361 | 61 381 539 | 3,65% | Акції |
| Dodge & Cox | $2 606 961 626 | 61 210 651 | 3,63% | Акції |
| PERSHING SQUARE INC. | $2 448 117 792 | 57 481 047 | 3,41% | Акції |
| BANK OF MONTREAL /CAN/ | $2 417 059 825 | 56 708 514 | 3,36% | Акції |
| Pershing Square Capital Management, L.P. | $2 415 946 008 | 59 697 208 | 3,36% | Акції |
| PRINCIPAL FINANCIAL GROUP INC | $2 344 907 077 | 55 057 354 | 3,26% | Акції |
| Brookfield Corp /ON/ | $1 994 251 366 | 46 824 404 | 2,78% | Акції |
| 1832 Asset Management L.P. | $1 809 967 311 | 42 497 472 | 2,52% | Акції |
| MACKENZIE FINANCIAL CORP | $1 497 600 475 | 24 936 347 | 2,08% | Акції |
| TD Asset Management Inc | $1 217 738 554 | 28 551 753 | 1,70% | Акції |
| NORGES BANK | $1 195 603 176 | 28 058 813 | 1,66% | Акції |
| FIL Ltd | $1 111 407 915 | 26 049 484 | 1,55% | Акції |
| NATIONAL BANK OF CANADA /FI/ | $1 036 076 594 | 24 328 364 | 1,44% | Акції |
| JARISLOWSKY, FRASER Ltd | $1 016 131 581 | 14 806 245 | 1,41% | Акції |
| GEODE CAPITAL MANAGEMENT, LLC | $970 862 920 | 22 299 618 | 1,35% | Акції |
| FIRST MANHATTAN CO. LLC. | $964 389 062 | 22 611 066 | 1,34% | Акції |
| CIBC WORLD MARKET INC. | $800 930 930 | 18 805 610 | 1,12% | Акції |
| VANGUARD FIDUCIARY TRUST CO | $791 333 695 | 18 547 608 | 1,10% | Акції |
| BANK OF NOVA SCOTIA | $707 454 833 | 16 584 463 | 0,98% | Акції |
| CIBC Asset Management Inc | $672 293 242 | 15 748 767 | 0,94% | Акції |
| CANADA PENSION PLAN INVESTMENT BOARD | $625 175 634 | 14 667 730 | 0,87% | Акції |
| TD Waterhouse Canada Inc. | $595 675 990 | 13 903 270 | 0,83% | Акції |
| MORGAN STANLEY | $585 114 538 | 13 738 306 | 0,81% | Акції |
| Capital International Investors | $564 185 430 | 13 247 143 | 0,79% | Акції |
| TORONTO DOMINION BANK | $559 238 067 | 13 120 954 | 0,78% | Акції |
| Markel Group Inc. | $556 805 009 | 13 073 609 | 0,78% | Акції |
| Federation des caisses Desjardins du Quebec | $546 558 098 | 12 858 377 | 0,76% | Акції |
| AKRE CAPITAL MANAGEMENT LLC | $516 187 709 | 12 119 927 | 0,72% | Акції |
| FMR LLC | $501 620 407 | 11 765 054 | 0,70% | Акції |
| UBS Group AG | $470 162 211 | 11 039 263 | 0,65% | Акції |
| SCOTIA CAPITAL INC. | $454 056 830 | 10 662 421 | 0,63% | Акції |
| Legal & General Group Plc | $445 539 999 | 10 447 234 | 0,62% | Акції |
| BANK OF AMERICA CORP /DE/ | $420 136 519 | 9 864 675 | 0,58% | Акції |
| DAVENPORT & Co LLC | $411 025 896 | 9 666 951 | 0,57% | Акції |
| GOLDMAN SACHS GROUP INC | $406 188 181 | 9 537 173 | 0,57% | Акції |
| JPMORGAN CHASE & CO | $383 476 565 | 9 100 060 | 0,53% | Акції |
| REGENTS OF THE UNIVERSITY OF CALIFORNIA | $382 424 298 | 8 979 204 | 0,53% | Акції |
| Vanguard Global Advisers, LLC | $380 003 161 | 8 906 672 | 0,53% | Акції |
| MANUFACTURERS LIFE INSURANCE COMPANY, THE | $345 453 446 | 8 112 388 | 0,48% | Акції |
| NEUBERGER BERMAN GROUP LLC | $300 418 485 | 7 053 087 | 0,42% | Акції |
| HEALTHCARE OF ONTARIO PENSION PLAN TRUST FUND | $295 558 436 | 6 936 231 | 0,41% | Акції |
| BAILLIE GIFFORD & CO | $248 657 073 | 5 838 391 | 0,35% | Акції |
| MASSACHUSETTS FINANCIAL SERVICES CO /MA/ | $217 952 621 | 4 030 678 | 0,30% | Акції |
| Connor, Clark & Lunn Investment Management Ltd. | $205 981 546 | 4 832 734 | 0,29% | Акції |
| PICTON MAHONEY ASSET MANAGEMENT | $202 235 091 | 4 751 905 | 0,28% | Акції |
| CHECK CAPITAL MANAGEMENT INC/CA | $187 786 592 | 4 409 171 | 0,26% | Акції |
Активісти та власники %+ 5 21 холдинг
Інвестори, які подали Розклад SEC 13D — бенефіціарна власність понад 5% з наміром вплинути на емітента (активістські частки, кампанії в раді директорів, M&A). Кожен рядок показує останній відомий стан позиції цього подавця.
| Подавець | Подано | Частка | Статус | Мета | Подача |
|---|---|---|---|---|---|
| BROOKFIELD CORPORATION, BROOKFIELD WEALTH SOLUTIONS LTD., BUSI II-C L.P., BUSI II GP-C LLC, BIM CAPITAL LLC, BROOKFIELD REIT ADVISER LLC ×20 подання | 22 квітня 2026 р. | 33,90% | Поправка | · | SEC |
| PARTNERS VALUE INVESTMENTS L.P., PARTNERS VALUE SPLIT CORP., PARTNERS VALUE INVESTMENTS INC. | 30 листопада 2023 р. | · | Первинна подача | · | SEC |
| BROOKFIELD ASSET MANAGEMENT LTD., BROOKFIELD ASSET MANAGEMENT ULC, BROOKFIELD US HOLDINGS INC., BROOKFIELD US INC., BROOKFIELD CORPORATION, BPG HOLDINGS GROUP INC., BPGH NEW SUBCO INC., BPGH NEW SUBCO 2 INC., BPGH SUB INC., BPG HOLDINGS GROUP (US) HOLDINGS INC., BROOKFIELD PROPERTY PARTNERS LIMITED, BROOKFIELD PROPERTY PARTNERS L.P., BROOKFIELD PROPERTY L.P., BROOKFIELD BPY HOLDINGS INC., BROOKFIELD US II INC., BROOKFIELD PROPERTY MASTER HOLDINGS LLC, BROOKFIELD PROPERTY GROUP LLC, BROOKFIELD PROPERTY GROUP II LLC, BUSI II NTR SUB LLC, BUSI II GP-C LLC, BUSI II-C L.P., BROOKFIELD PUBLIC SECURITIES GROUP HOLDINGS LLC, BROOKFIELD PUBLIC SECURITIES GROUP LLC, BIM CAPITAL LLC, BROOKFIELD REIT ADVISER LLC | 10 квітня 2023 р. | · | Первинна подача | · | SEC |
| BROOKFIELD ASSET MANAGEMENT INC., BAM PARTNERS TRUST, BROOKFIELD HOLDINGS CANADA INC., BROOKFIELD US HOLDINGS INC., BROOKFIELD US INC., BROOKFIELD US II INC., BROOKFIELD PROPERTY MASTER HOLDINGS LLC, BROOKFIELD PROPERTY GROUP LLC, BROOKFIELD PROPERTY GROUP II LLC, BUSI II NTR SUB LLC, BUSI II GP-C LLC, BUSI II-C L.P., BROOKFIELD PUBLIC SECURITIES GROUP HOLDINGS LLC, BROOKFIELD PUBLIC SECURITIES GROUP LLC, BIM CAPITAL LLC, BROOKFIELD REIT ADVISER LLC ×123 подання | 01 липня 2022 р. | · | Первинна подача | · | SEC |
| PARTNERS VALUE INVESTMENTS LP, PARTNERS VALUE SPLIT CORP., PARTNERS LIMITED ×2 подання | 09 квітня 2021 р. | · | Первинна подача | · | SEC |
| BIF IV Cypress Aggregator (Delaware) LLC, Brookfield Infrastructure Fund IV GP LLC, Brookfield Asset Management Private Institutional Capital Adviser (Canada), L.P., Brookfield Asset Management Inc., Partners Limited | 30 вересня 2020 р. | · | Первинна подача | Кампанія в раді директорів | SEC |
| 251091708 Delaware LP, PubCo Investments LP, 2484842 Ontario Limited, Brookfield Capital Partners Ltd., BCP GP Limited, Brookfield Private Equity Group Holdings LP, Brookfield Private Equity Inc., Brookfield Asset Management Private Institutional Capital Adviser (Private Equity) LP, Brookfield Asset Management Inc., Partners Limited ×6 подання | 07 квітня 2017 р. | · | Первинна подача | · | SEC |
| Brookfield Retail Holdings LLC, Brookfield Retail Holdings II LLC, Brookfield Retail Holdings III LLC, Brookfield Retail Holdings IV-A LLC, Brookfield Retail Holdings IV-B LLC, Brookfield Retail Holdings IV-C LLC, Brookfield Retail Holdings IV-D LLC, Brookfield Retail Holdings V LP, Brookfield Retail Holdings VI LLC, Brookfield Asset Management Inc., Partners Limited, Brookfield Holdings Canada Inc., Brookfield Asset Management Private Institutional Capital Adviser (Canada) LP, Brookfield Private Funds Holdings Inc., Brookfield Retail Split LP, Brookfield Retail Split II LLC, Brookfield US Holdings Inc., Brookfield US Corporation, Brookfield REP GP Inc. ×2 подання | 27 серпня 2012 р. | · | Первинна подача | · | SEC |
| BROOKFIELD ASSET MANAGEMENT INC. N/A, PARTNERS LIMITED N/A ×7 подання | 14 жовтня 2011 р. | · | Первинна подача | · | SEC |
| TRICAP PARTNERS LTD., BRASCAN ASSET MANAGEMENT HOLDINGS LIMITED, BROOKFIELD ASSET MANAGEMENT INC. | 16 грудня 2008 р. | · | Первинна подача | · | SEC |
| Нерозкрита особа, що звітує, Нерозкрита особа, що звітує | 01 серпня 2008 р. | · | Первинна подача | Кампанія в раді директорів | SEC |
| Нерозкрита особа, що звітує, Нерозкрита особа, що звітує | 20 квітня 2007 р. | · | Первинна подача | · | SEC |
| Нерозкрита особа, що звітує | 29 березня 2007 р. | · | Первинна подача | M&A / продаж | SEC |
| Нерозкрита особа, що звітує, Нерозкрита особа, що звітує, Нерозкрита особа, що звітує | 18 січня 2006 р. | · | Первинна подача | · | SEC |
| Нерозкрита особа, що звітує, Нерозкрита особа, що звітує, Нерозкрита особа, що звітує | 21 листопада 2005 р. | · | Первинна подача | · | SEC |
| Нерозкрита особа, що звітує, Нерозкрита особа, що звітує, Нерозкрита особа, що звітує | 06 жовтня 2005 р. | · | Первинна подача | M&A / продаж | SEC |
| BRASCAN CORPORATION, PARTNERS LIMITED ×4 подання | 17 серпня 2005 р. | · | Первинна подача | · | SEC |
| Нерозкрита особа, що звітує, Нерозкрита особа, що звітує, Нерозкрита особа, що звітує | 28 липня 2005 р. | · | Первинна подача | · | SEC |
| Нерозкрита особа, що звітує, Нерозкрита особа, що звітує, Нерозкрита особа, що звітує, Нерозкрита особа, що звітує | 23 лютого 2005 р. | · | Первинна подача | · | SEC |
| Нерозкрита особа, що звітує, Нерозкрита особа, що звітує | 07 жовтня 2003 р. | · | Первинна подача | Структура капіталу | SEC |
| BRASCAN REAL ESTATE FINANCE FUND I L.P., BRASCAN CORPORATION, EDPERPARTNERS LIMITED, BARRY S. BLATTMAN | 03 лютого 2003 р. | · | Первинна подача | · | SEC |
Purpose is an automated classification of the filer's own stated purpose (SEC Item 4) — not investment advice. "—" means no clear purpose was stated or the text could not be classified.
Інсайдери компанії 1 інсайдер · 0 керівники · 0 директори
| Інсайдер | Роль | Остання активність | Кількість акцій у власності | Купівлі за 12 міс. | Продажі за 12 міс. | Нетто 12 міс |
|---|---|---|---|---|---|---|
| Brookfield Corporation | Власник 10% | 23 листопада 2005 р. S | 14 140 893 | 0 | 0 | $0 |
Інсайдери згідно з формами SEC 3/4/5; чистий результат = лише відкритий ринок купівлі/продажу
Присутність в ETF Належить 43 ETF
Вага відображає лише прямі акціонерні володіння (N-PORT); фонди з кредитним плечем або похідними інструментами можуть мати додаткову експозицію за свопами, яка не відображається.
| Фонд | Вага | Одиниці | Станом на | Джерело |
|---|---|---|---|---|
| LBO · EA Series Trust | 3,11% | 5 155 NS | 31 липня 2026 р. | N-PORT |
| BBCA · J.P. Morgan Exchange-Traded Fund Tr… | 2,55% | 6 514 357 NS | 31 липня 2026 р. | N-PORT |
| EWC · iShares, Inc. | 2,44% | 4 385 543 SH | 11 вересня 2026 р. | Щоденно |
| EWQ · iShares, Inc. | 2,14% | 103 710 SH | 11 вересня 2026 р. | Щоденно |
| VIGI · VANGUARD WHITEHALL FUNDS | 1,64% | 3 489 336 SH | 19 серпня 2026 р. | Щоденно |
| KXI · iShares Trust | 1,25% | 186 392 SH | 11 вересня 2026 р. | Щоденно |
| EFAV · iShares Trust | 0,72% | 543 420 SH | 11 вересня 2026 р. | Щоденно |
| LQAI · Exchange Listed Funds Trust | 0,70% | 364 NS | 31 липня 2026 р. | N-PORT |
| EZU · iShares, Inc. | 0,59% | 802 283 SH | 11 вересня 2026 р. | Щоденно |
| IXG · iShares Trust | 0,51% | 93 103 SH | 11 вересня 2026 р. | Щоденно |
| VEA · VANGUARD TAX-MANAGED FUNDS | 0,43% | 26 617 621 SH | 19 серпня 2026 р. | Щоденно |
| IDLV · Invesco Exchange-Traded Fund Trust … | 0,41% | 19 665 SH | 01 жовтня 2026 р. | Щоденно |
| IDEV · iShares Trust | 0,41% | 2 867 292 SH | 11 вересня 2026 р. | Щоденно |
| EFV · iShares Trust | 0,40% | 1 770 480 SH | 11 вересня 2026 р. | Щоденно |
| PTIN · Pacer Funds Trust | 0,38% | 16 365 NS | 31 липня 2026 р. | N-PORT |
| BKIE · BNY Mellon ETF Trust | 0,36% | 111 211 NS | 31 липня 2026 р. | N-PORT |
| ESGD · iShares Trust | 0,35% | 583 041 SH | 11 вересня 2026 р. | Щоденно |
| VEU · VANGUARD INTERNATIONAL EQUITY INDEX… | 0,34% | 6 371 143 SH | 19 серпня 2026 р. | Щоденно |
| IEV · iShares Trust | 0,33% | 76 005 SH | 11 вересня 2026 р. | Щоденно |
| PXF · Invesco Exchange-Traded Fund Trust … | 0,32% | 203 248 SH | 01 жовтня 2026 р. | Щоденно |
| ACWX · iShares Trust | 0,32% | 875 688 SH | 11 вересня 2026 р. | Щоденно |
| VGK · VANGUARD INTERNATIONAL EQUITY INDEX… | 0,32% | 1 513 278 SH | 19 серпня 2026 р. | Щоденно |
| VXUS · VANGUARD STAR FUNDS | 0,31% | 40 030 291 SH | 19 серпня 2026 р. | Щоденно |
| IEUR · iShares Trust | 0,29% | 363 550 SH | 11 вересня 2026 р. | Щоденно |
| VYMI · VANGUARD WHITEHALL FUNDS | 0,28% | 707 080 SH | 19 серпня 2026 р. | Щоденно |
| IXUS · iShares Trust | 0,28% | 3 606 306 SH | 11 вересня 2026 р. | Щоденно |
| IMFL · Invesco Exchange-Traded Self-Indexe… | 0,23% | 38 292 SH | 01 жовтня 2026 р. | Щоденно |
| DFSI · Dimensional ETF Trust | 0,22% | 59 799 NS | 31 липня 2026 р. | N-PORT |
| EFA · iShares Trust | 0,21% | 2 252 564 SH | 11 вересня 2026 р. | Щоденно |
| DFAI · Dimensional ETF Trust | 0,20% | 840 095 NS | 31 липня 2026 р. | N-PORT |
| IEFA · iShares Trust | 0,17% | 4 737 221 SH | 11 вересня 2026 р. | Щоденно |
| VSGX · VANGUARD WORLD FUND | 0,15% | 126 751 SH | 19 серпня 2026 р. | Щоденно |
| TLTD · FlexShares Trust | 0,15% | 23 116 NS | 31 липня 2026 р. | N-PORT |
| TOK · iShares Trust | 0,15% | 7 457 SH | 11 вересня 2026 р. | Щоденно |
| URTH · iShares, Inc. | 0,14% | 239 257 SH | 11 вересня 2026 р. | Щоденно |
| VT · VANGUARD INTERNATIONAL EQUITY INDEX… | 0,12% | 2 296 805 SH | 19 серпня 2026 р. | Щоденно |
| ACWI · iShares Trust | 0,12% | 829 878 SH | 11 вересня 2026 р. | Щоденно |
| VOXP · Advisors Series Trust | 0,10% | 138 NS | 31 липня 2026 р. | N-PORT |
| INTF · iShares Trust | 0,10% | 49 657 SH | 11 вересня 2026 р. | Щоденно |
| DFIC · Dimensional ETF Trust | 0,08% | 263 873 NS | 31 липня 2026 р. | N-PORT |
| DFAX · Dimensional ETF Trust | 0,06% | 175 748 NS | 31 липня 2026 р. | N-PORT |
| ACWV · iShares, Inc. | 0,06% | 26 701 SH | 11 вересня 2026 р. | Щоденно |
| CRBN · iShares Trust | 0,00% | 1 077 SH | 10 вересня 2026 р. | Щоденно |
BN Консенсус аналітиків Бичачі та ведмежі думки аналітиків, 12-місячна цільова ціна, потенціал зростання
12-місячна цільова ціна
10 аналітиків · 2026-09-30Середня цільова ціна $54.40 +47,3%
Останні новини Останні заголовки, що згадують цю компанію
Торгові сигнали Останні сигнали купівлі/продажу із зазначенням ціни входу та коефіцієнта ризику/прибутку
Зараз немає активних сигналів — жодна картка не заповнена, і це чесно.
Мої показники Ваш персональний список спостереження — вибрані рядки з Повних фундаментальних даних
Виберіть показники, які для вас важливі — натисніть + поруч із будь-яким рядком у розділі Повна фундаментальна інформація вище.
Ваш вибір збережено і він буде застосовуватися до всіх тікерів.