
GGAL Клас B Grupo Financiero Galicia S.A. - American Depositary Shares, Class B Shares underlying
NASDAQ · Banking · Переглянути на SEC EDGAR ↗ закриття Жов 2, 2026 10-K/10-Q Кві 16, 2026GGAL Знімок акцій Ціна, ринкова капіталізація, P/E, EPS, ROE, борг/власний капітал, діапазон 52 тижнів
GGAL Графік ціни акцій Денні OHLCV з технічними індикаторами — панування, масштабування та налаштування вашого представлення
Гранулярність стовпчиків адаптується до вибраного періоду — наведіть курсор на графік, щоб побачити відкриття/максимум/мінімум/закриття для стовпчика.
Про Grupo Financiero Galicia S.A. - American Depositary Shares, Class B Shares underlying Огляд компанії з Wikipedia
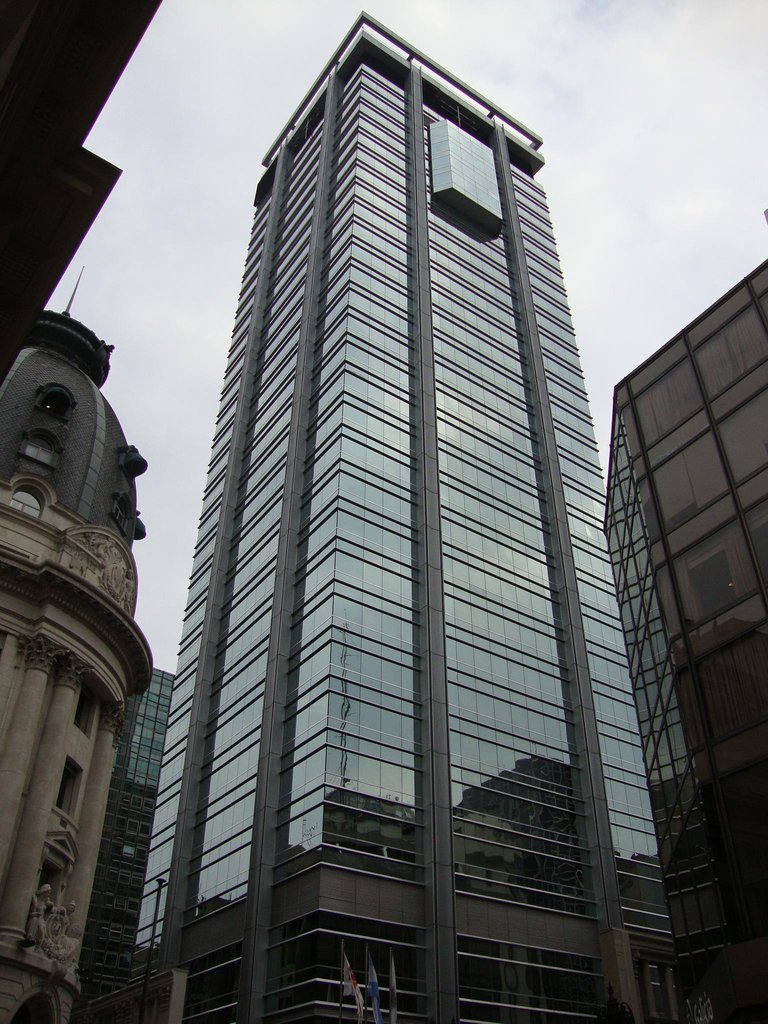
Grupo Financiero Galicia S.A. is a financial services holding company based in Buenos Aires, and its banking operations are the fifth largest in Argentina, as well as the largest among all domestically owned private banks in the country.
Overview
The bank was founded in 1905 as the Banco de Galicia y Buenos Aires by a consortium led by Manuel Escasany, a jeweler and clockmaker of Galician origin. It was registered under the laws of the Argentine Republic. Its executive offices are located in Buenos Aires. The name referred to the Galician heritage of the Escasanys, the largest original shareholders, as well as to the Spanish Argentine immigrant community from that region (who were second only to Italian Argentines in number).
The bank maintained over 2,500 accounts by the end of its first year, and in 1907, it was listed on the Buenos Aires Stock Exchange and garnered nearly 3,300 initial shareholders. The Buenos Aires branches were followed by one in neighboring Montevideo, Uruguay, in 1910, and in 1921, it began offering time deposits (which remain the most common form of savings among the Argentine public).
Following the founder's death in 1948, his son, Eduardo Escasany, became its president and by 1960, he had secured a partnership with the Ayerzas and the Brauns, two influential local families prominent in the Argentine ranching and retail sectors, respectively. The Banco de Galicia became the largest, domestically owned private bank in Argentina in 1965 and by 1975, ranked second to the public National Mortgage Bank in new home loans, and employed around 3,900 staff in 93 branches, nationwide. Banco de Galicia in 1993 became the first Latin American bank to enter both the U.S. and European stock markets, and the first to raise funds on the U.S. domestic capital market by floating a $200 million, ten-year Yankee bond. The following year it was the first to issue convertible bonds on the international securities market, enabling the bank to remain in Argentine hands at a time when many of its rivals were sold to Spanish banks. A branch was opened in New York in 1994, and the group acquired a one-eighth share in the newly privatized postal service. Banco Galicia established an insurance company, Sudamericana Holding S.A., in 1996 as a joint venture with The Hartford.
The company's decision in 2000 to demolish its historic downtown Buenos Aires headquarters in favor of a modern, 34-story building was controversial. A family feud among the Escasany siblings led to the establishment in 2000 of the Banco de Galicia Foundation, which owns over 94% of the outstanding shares of Banco Galicia. Though a sell-off of public shares was averted, given the controversy, the 1998–2002 Argentine great depression led to the loss of nearly half of the bank's deposits between 2001 and 2002, and to its near-insolvency, when its dollar-denominated debt of US$1.8 billion required borrowing on flexible terms from the Central Bank of Argentina; Escasany, who had also been chairman of the Argentine Banking Association, resigned as CEO in 2002. The bank recovered during 2003, however, when its losses of US$436 million were trimmed to US$73 million, and it has remained profitable in the ensuing years.
The bank remains the largest private sector commercial bank in Argentina ranked by deposits, assets or loans. As of April 2009, the group maintained 236 branches and total deposits in Argentina amounted to nearly US$4.5 billion, a 6% market share, and 7.6% among private sector depositors. Consolidated assets totaled US$7.7 billion and loans to the private sector, US$3.7 billion (6.5% of the market).
Besides its holdings in Banco Galicia, GFG participates in other business sectors through four companies: Grupo Sudamericana, an insurance holding company specialized in life, retirement, and hemeowner's policies; Galicia Warrants S.A., a warehouse rental services and issuer of certificate of deposits company; Net Investment, a holding company oriented to invest in Internet projects that can have synergies with Banco Galicia; and Galval Agente de Valores S.A., a wholly owned subsidiary of GFG, based in Uruguay and created with the purpose of providing custody services.
Grupo Galicia Class B shares trade on the Córdoba Stock Exchange while Grupo Galicia ADSs trade on the Nasdaq Capital Market, both under the ticker symbol "GGAL." Grupo Galicia comprises the Buenos Aires Stock Exchange's blue-chip MERVAL Index and are included in the Morgan Stanley Capital International and Standard & Poor's indices, as well.
In 2020, Grupo Financiero Galicia introduced its first digital wallet that integrates the most important banks in Argentina in a single app.
Shareholders and investors
The capital structure of the Group consists of 1,474,692,091 shares, divided into Class A and Class B shares. The 281,221,650 Class A shares carry five votes each, while the remaining Class B shares grant one vote per share. Traded under the symbol GGAL, the Class B shares are listed on BYMA, MAE, and the Córdoba Stock Exchange, with one ADS equivalent to ten Class B shares.
The controlling stake is held by EBA Holding, which owns 19.7% of the shares but commands 55.1% of the voting power due to its multiple-voting Class A shares. EBA Holding is entirely owned by the Escasany, Ayerza, and Braun families—the Escasanys being the founders of Galicia Bank in 1905, while the Ayerza and Braun families joined in the mid-20th century.
Джерело: Wikipedia (Англійська), CC BY-SA 4.0 · Переглянути на Wikipedia ↗
10-річна ефективність Тренди виручки, чистого прибутку, маржі та EPS
Оцінка Співвідношення P/E, P/S, P/B, EV/EBITDA — акція дорога чи дешева?
| Метрика | 5-річний тренд | GGAL | середнє за 5 років | Медіана аналогів | Висновок |
|---|---|---|---|---|---|
| P/E | 0.4середнє за 5 років ≈0.1 | ≈0.1 | · | · |
Медіана аналогічних компаній розраховується на стандартизованій основі для кожного показника і може не завжди відповідати базі TTM/MRQ, показаній для цієї акції.
Прибутковість Валова, операційна та чиста маржа; ROE, ROA, ROIC
| Метрика | 5-річний тренд | GGAL | середнє за 5 років | Медіана аналогів | Висновок |
|---|---|---|---|---|---|
| ROA | 0.48%середнє за 5 років ≈2.6% | ≈2.6% | · | · | |
| ROE | 2.7%середнє за 5 років ≈14.0% | ≈14.0% | · | · | |
| ROIC | 2.7%середнє за 5 років ≈11.1% | ≈11.1% | · | · |
Фінансове здоровʼя Борг, ліквідність, платоспроможність — міцність балансу
| Метрика | 5-річний тренд | GGAL | середнє за 5 років | Медіана аналогів | Висновок |
|---|---|---|---|---|---|
| Interest Coverage (Покриття відсотків) | 0.1середнє за 5 років ≈0.2 | ≈0.2 | · | · |
Зростання Зростання виручки, EPS та чистого прибутку: рік до року, 3-річний CAGR, 5-річний CAGR
Ще недостатньо фундаментальних даних для обчислення цієї групи коефіцієнтів.
Ефективність капіталу Оборотність активів, оборотність запасів, оборотність дебіторської заборгованості
Ще недостатньо фундаментальних даних для обчислення цієї групи коефіцієнтів.
значення · ≈ середнє за 5 років · медіана галузі · вердикт відносно медіани
Дивіденди Дивідендна дохідність, коефіцієнт виплат, історія дивідендів, 5-річний CAGR
| Дата екс-дивіденду | Сума | Валюта | Дохідність |
|---|---|---|---|
| Вер 28, 2026 | $0,05 | USD | ≈5.3% |
| Сер 24, 2026 | $0,05 | USD | ≈4.7% |
| Сер 3, 2026 | $0,05 | USD | ≈4.0% |
| Тра 11, 2026 | $0,62 | USD | ≈5.5% |
| Тра 4, 2026 | $0,16 | USD | ≈4.3% |
| Бер 30, 2026 | $0,16 | USD | ≈3.7% |
| Бер 2, 2026 | $0,15 | USD | ≈3.2% |
| Лют 2, 2026 | $0,15 | USD | ≈2.3% |
| Гру 29, 2025 | $0,14 | USD | ≈2.1% |
| Гру 1, 2025 | $0,14 | USD | ≈1.9% |
| Лис 3, 2025 | $0,14 | USD | ≈1.4% |
| Вер 30, 2025 | $0,14 | USD | ≈2.6% |
| Сер 29, 2025 | $0,15 | USD | ≈1.5% |
| Лип 29, 2025 | $0,15 | USD | ≈2.2% |
| Чер 3, 2025 | $0,27 | USD | ≈4.7% |
| Сер 19, 2024 | $0,73 | USD | ≈7.6% |
| Лип 26, 2024 | $0,66 | USD | ≈7.3% |
| Чер 21, 2024 | $0,70 | USD | ≈4.9% |
| Чер 10, 2024 | $0,29 | USD | ≈2.7% |
| Вер 22, 2023 | $0,12 | USD | ≈8.3% |
Історія прибутків EPS фактичний проти прогнозу, сюрприз %, коефіцієнт перевищення, дата наступного звіту про прибутки
| Період | Звіт | EPS (факт) | EPS прогноз | Сюрприз |
|---|---|---|---|---|
| 30 червня 2026 р. | $1723.39 | $133.36 | 1192.2% | |
| 31 березня 2026 р. | $41.40 | $43.35 | -4.5% | |
| 31 грудня 2025 р. | $-39.33 | $-24.17 | -62.7% | |
| 30 вересня 2025 р. | $-54.70 | $8.60 | -736.3% | |
| 30 червня 2025 р. | $113.00 | $118.02 | -4.3% | |
| 31 березня 2025 р. | $-39.33 | $-24.17 | -62.7% | |
| 31 грудня 2024 р. | $435.90 | $141.04 | 209.1% |
Повні фундаментальні показники Усі показники за роками — звіт про прибутки та збитки, баланс, рух грошових коштів
Звіт про прибутки та збитки
| Метрика | Тенденція | 2025 | 2024 | 2023 | 2022 | 2021 | 2020 | 2019 | 2018 | 2017 |
|---|---|---|---|---|---|---|---|---|---|---|
| Operating Income | $299.09B | $1.96T | $1.55T | $447.45B | $288.93B | $136.49B | $82.51B | $7.07B | $22.46B | |
| Interest Expense | $3.88T | $4.07T | $8.67T | $3.83T | $1.10T | $266.58B | $196.61B | $94.05B | $38.18B | |
| Interest Income | $9.47T | $10.85T | $13.62T | $4.86T | $1.76T | $492.14B | $268.18B | $163.93B | $84.14B | |
| Pretax Income | $303.85B | $2.89T | $1.56T | $444.45B | $288.14B | $136.13B | $82.51B | $7.07B | $22.95B | |
| Income Tax | $91.24B | $771.68B | $589.66B | $115.07B | $99.52B | $61.11B | $33.57B | $14.48B | $11.26B | |
| Net Income | $212.52B | $2.12T | $965.88B | $329.38B | $188.62B | $74.01B | $48.72B | $-7.26B | $10.45B | |
| EPS (Basic) | $132.48 | $1426.39 | $654.97 | $223.36 | $127.90 | $51.30 | $34.15 | $-5.09 | $7.84 | |
| EPS (Diluted) | $132.48 | $1426.39 | $654.97 | $223.36 | $127.90 | $51.30 | $34.15 | $-5.09 | $7.84 | |
| Shares (Basic) | 1,604,164,000 | 1,483,089,000 | 1,474,692,000 | 1,474,692,000 | 1,474,692,000 | 1,442,740,000 | 1,426,765,000 | 1,426,765,000 | 1,332,617,000 | |
| Shares (Diluted) | 1,604,164,000 | 1,483,089,000 | 1,474,692,000 | 1,474,692,000 | 1,474,692,000 | 1,442,740,000 | 1,426,765,000 | 1,426,765,000 | 1,332,617,000 | |
| EBITDA | $299.09B | $1.49T | $540.08B | $66.08B | $47.63B | $43.50B | $36.86B | $3.37B | · |
Баланс
| Метрика | Тенденція | 2025 | 2024 | 2023 | 2022 | 2021 | 2020 | 2019 | 2018 | 2017 |
|---|---|---|---|---|---|---|---|---|---|---|
| Cash & Equivalents | $9.37T | $8.87T | $4.35T | $1.39T | $462.49B | $264.79B | $177.87B | $220.46B | $87.04B | |
| PP&E (Net) | $1.20T | $1.31T | $773.63B | $360.68B | $121.15B | $66.01B | $44.88B | $29.79B | $18.21B | |
| Intangibles | $381.32B | $400.55B | $269.19B | $119.93B | $41.36B | $21.84B | $11.83B | $7.06B | $1.72B | |
| Total Assets | $45.67T | $42.76T | $22.25T | $10.49T | $3.27T | $1.59T | $933.27B | $876.37B | $489.64B | |
| Total Liabilities | $37.91T | $34.81T | $17.85T | $8.59T | $2.68T | $1.32T | $774.21B | $781.23B | $422.16B | |
| Retained Earnings | $-1.60T | $-1.58T | $-1.20T | $-544.27B | $-173.44B | $-154.35B | $-77.96B | $-22.99B | $-9.60B | |
| Stockholders' Equity | $7.76T | $7.95T | $4.39T | $1.90T | $593.09B | $275.22B | $155.12B | $92.49B | $64.52B |
Грошовий потік
| Метрика | Тенденція | 2025 | 2024 | 2023 | 2022 | 2021 | 2020 | 2019 | 2018 | 2017 |
|---|---|---|---|---|---|---|---|---|---|---|
| Operating Cash Flow | $-1.61T | $4.61T | $4.78T | $3.91T | $1.72T | $540.28B | $-39.46B | $188.24B | $-13.81B | |
| Investing Cash Flow | $-222.93B | $1.14T | $-234.50B | $-126.81B | $-51.06B | $-19.94B | $-10.84B | $-7.51B | $-5.95B | |
| Dividends Paid | $329.13B | $808.95B | $513.56B | $144.19B | $11.68B | $5.99B | $5.47B | $3.59B | $859M | |
| Financing Cash Flow | $873.80B | $543.99B | $-658.19B | $182.83B | $51.13B | $-103.22B | $-37.88B | $16.41B | $20.60B |
Прибутковість
| Метрика | Тенденція | 2025 | 2024 | 2023 | 2022 | 2021 | 2020 | 2019 | 2018 | 2017 |
|---|---|---|---|---|---|---|---|---|---|---|
| ROA | 0.48% | 5.9% | 3.3% | 1.5% | 1.9% | 2.5% | 3.0% | -0.65% | · | |
| ROE | 2.7% | 31.1% | 17.2% | 8.1% | 10.7% | 14.9% | 23.0% | -5.6% | · | |
| ROIC | 2.7% | 18.1% | 16.6% | 8.0% | 10.2% | 14.0% | 20.9% | -5.9% | · |
Ліквідність та платоспроможність
| Метрика | Тенденція | 2025 | 2024 | 2023 | 2022 | 2021 | 2020 | 2019 | 2018 | 2017 |
|---|---|---|---|---|---|---|---|---|---|---|
| Interest Coverage | 0.1 | 0.5 | 0.2 | 0.1 | 0.3 | 0.5 | 0.4 | 0.1 | · |
На акцію
| Метрика | Тенденція | 2025 | 2024 | 2023 | 2022 | 2021 | 2020 | 2019 | 2018 | 2017 |
|---|---|---|---|---|---|---|---|---|---|---|
| Cash Flow / Share | $-1000.78 | $2361.82 | $1130.61 | $393.45 | $191.78 | $127.36 | $-7.41 | $60462.55 | · | |
| EPS (TTM) | $132.48 | $1426.39 | $654.97 | $223.36 | $127.90 | $51.30 | $34.15 | $-5.09 | · |
Оцінка (TTM)
| Метрика | Тенденція | 2025 | 2024 | 2023 | 2022 | 2021 | 2020 | 2019 | 2018 | 2017 |
|---|---|---|---|---|---|---|---|---|---|---|
| Net Income TTM | $212.52B | $2.12T | $965.88B | $329.38B | $188.62B | $74.01B | $48.72B | $-7.26B | · | |
| P/E | 0.4 | 0.0 | 0.0 | 0.0 | 0.1 | 0.2 | 0.5 | -5.4 | · | |
| Earnings Yield | 245.6% | 2288.8% | 3792.5% | 2295.6% | 1347.7% | 587.0% | 210.4% | -18.5% | · | |
| Payout Ratio | 154.9% | 37.9% | 53.2% | 51.8% | 6.2% | 8.1% | 11.2% | -46.7% | · | |
| Annual Payout | $329.13B | $808.95B | $513.56B | $144.19B | $11.68B | $5.99B | $5.47B | $3.59B | · |
На акцію
| Метрика | Тенденція | Q4 2018 | Q4 2017 | Q4 2016 | Q4 2015 | Q4 2014 | Q4 2013 | Q4 2012 | Q4 2011 | Q4 2010 | Q4 2009 | Q4 2008 | Q4 2007 | Q4 2006 | Q4 2005 | Q4 2004 |
|---|---|---|---|---|---|---|---|---|---|---|---|---|---|---|---|---|
| EPS (TTM) | $-5.09 | $7.84 | · | · | · | · | · | · | · | · | · | · | · | · | · |
Оцінка (TTM)
| Метрика | Тенденція | Q4 2018 | Q4 2017 | Q4 2016 | Q4 2015 | Q4 2014 | Q4 2013 | Q4 2012 | Q4 2011 | Q4 2010 | Q4 2009 | Q4 2008 | Q4 2007 | Q4 2006 | Q4 2005 | Q4 2004 |
|---|---|---|---|---|---|---|---|---|---|---|---|---|---|---|---|---|
| Net Income TTM | $-7.26B | $10.45B | · | · | · | · | · | · | · | · | · | · | · | · | · | |
| P/E | -5.4 | 8.4 | · | · | · | · | · | · | · | · | · | · | · | · | · | |
| Earnings Yield | -18.5% | 11.9% | · | · | · | · | · | · | · | · | · | · | · | · | · | |
| Annual Payout | $3.59B | $859M | · | · | · | · | · | · | · | · | · | · | · | · | · |
Найновіший період ліворуч · нульові значення показані як ·
Фінансова звітність Звіт про прибутки та збитки, баланс, рух грошових коштів — річні, за останні 5 років
| Метрика | 2025-12-31 | 2024-12-31 | 2023-12-31 | 2022-12-31 | 2021-12-31 |
|---|---|---|---|---|---|
| Чистий прибуток | $212.52B | $2.12T | $965.88B | $329.38B | $188.62B |
| Розбавлений EPS | $132.48 | $1426.39 | $654.97 | $223.36 | $127.90 |
Ще недостатньо фундаментальних даних для побудови цього звіту.
Ще недостатньо фундаментальних даних для побудови цього звіту.
Інституційні власники (13F) 163 подавачі звітності · $1.7B всього · Станом на 30 червня 2026 р.
Інституційні інвестори, які звітують про володіння цими акціями у своїй квартальній формі SEC 13F. Тільки довгі позиції; один подавець звітності може з'явитися двічі для окремих опціонних контрактів. Великі протилежні опціонні позиції (пут/кол) зазвичай відображають маркет-мейкінг або хеджування запасів, а не спрямованість переконань.
| Нові позиції | Закриті позиції | Збільшено | Зменшено | Зміна чистих акцій |
|---|---|---|---|---|
| 37 (-1 проти попереднього кв.) | 27 (+6 проти попереднього кв.) | 48 (-2 проти попереднього кв.) | 50 (+5 проти попереднього кв.) | +1.9M |
Порівняно з Q1 2026. Звіти SEC Form 13F подаються протягом 45 днів після закінчення кварталу плюс невеликий буфер для тих, хто подає із запізненням — квартали, що ще знаходяться в цьому вікні, пропускаються на користь останньої повністю звітної пари.
| Інституційний інвестор | Вартість | Акції | % від відстежуваного 13F | Тип |
|---|---|---|---|---|
| Westwood Global Investments, LLC | $277 171 603 | 5 540 108 | 16,08% | Акції |
| Aquamarine Financial (Cayman) Ltd | $175 883 667 | 3 515 564 | 10,20% | Акції |
| MAK CAPITAL ONE LLC | $74 338 326 | 1 485 875 | 4,31% | Акції |
| PointState Capital LP | $69 991 970 | 1 399 000 | 4,06% | Акції |
| Carrhae Capital LLP | $68 051 807 | 1 360 220 | 3,95% | Акції |
| MIRAE ASSET GLOBAL ETFS HOLDINGS Ltd. | $55 930 788 | 1 117 945 | 3,24% | Акції |
| INCA Investments LLC | $53 306 515 | 1 065 491 | 3,09% | Акції |
| DISCOVERY CAPITAL MANAGEMENT, LLC / CT | $45 923 988 | 917 929 | 2,66% | Акції |
| MORGAN STANLEY | $44 058 366 | 880 638 | 2,56% | Акції |
| CITADEL ADVISORS LLC | $43 305 968 | 865 600 | 2,51% | Опціон кол |
| Driehaus Capital Management LLC | $43 031 353 | 860 111 | 2,50% | Акції |
| RWC Asset Management LLP | $42 697 853 | 853 445 | 2,48% | Акції |
| SUSQUEHANNA INTERNATIONAL GROUP, LLP | $42 410 431 | 847 700 | 2,46% | Опціон кол |
| PING CAPITAL MANAGEMENT, INC. | $41 644 972 | 832 400 | 2,42% | Акції |
| CITADEL ADVISORS LLC | $37 422 440 | 748 000 | 2,17% | Опціон пут |
| SUSQUEHANNA INTERNATIONAL GROUP, LLP | $36 767 047 | 734 900 | 2,13% | Опціон пут |
| MILLENNIUM MANAGEMENT LLC | $33 840 292 | 676 400 | 1,96% | Акції |
| Sagil Capital LLP | $32 951 059 | 658 626 | 1,91% | Акції |
| Kora Management LP | $32 886 370 | 657 333 | 1,91% | Акції |
| Route One Investment Company, L.P. | $28 984 881 | 579 350 | 1,68% | Акції |
| RWC ASSET ADVISORS (US) LLC | $25 892 526 | 517 540 | 1,50% | Акції |
| CITADEL ADVISORS LLC | $24 909 387 | 497 889 | 1,44% | Акції |
| NOMURA ASSET MANAGEMENT INTERNATIONAL INC. | $23 660 000 | 472 923 | 1,37% | Акції |
| Long Focus Capital Management, LLC | $22 813 680 | 456 000 | 1,32% | Акції |
| JANE STREET GROUP, LLC | $22 513 500 | 450 000 | 1,31% | Опціон пут |
| TT International Asset Management LTD | $21 529 060 | 430 323 | 1,25% | Акції |
| CITIGROUP INC | $18 692 409 | 373 624 | 1,08% | Акції |
| JPMORGAN CHASE & CO | $16 844 897 | 330 941 | 0,98% | Акції |
| JANE STREET GROUP, LLC | $16 795 071 | 335 700 | 0,97% | Опціон кол |
| Fourth Sail Capital LP | $15 971 927 | 319 247 | 0,93% | Акції |
| Moerus Capital Management LLC | $12 331 745 | 246 487 | 0,72% | Акції |
| UBS Group AG | $12 303 128 | 245 915 | 0,71% | Акції |
| Caption Management, LLC | $12 257 350 | 245 000 | 0,71% | Опціон кол |
| Itau Unibanco Holding S.A. | $11 843 033 | 236 736 | 0,69% | Акції |
| Fiera Capital Corp | $9 701 868 | 193 921 | 0,56% | Акції |
| USS Investment Management Ltd | $9 487 625 | 189 544 | 0,55% | Акції |
| Fundamenta Capital S.A. | $9 118 468 | 182 260 | 0,53% | Акції |
| Amundi | $8 612 414 | 172 145 | 0,50% | Акції |
| Walleye Trading LLC | $8 470 079 | 169 300 | 0,49% | Опціон кол |
| LAZARD ASSET MANAGEMENT LLC | $8 265 373 | 165 208 | 0,48% | Акції |
| HSBC HOLDINGS PLC | $7 537 388 | 147 966 | 0,44% | Акції |
| Walleye Trading LLC | $7 319 389 | 146 300 | 0,42% | Опціон пут |
| Aquatic Capital Management LLC | $6 671 651 | 133 353 | 0,39% | Акції |
| Russell Investments Group, Ltd. | $6 633 196 | 132 584 | 0,38% | Акції |
| GOLDMAN SACHS GROUP INC | $4 940 065 | 98 742 | 0,29% | Акції |
| TUDOR INVESTMENT CORP ET AL | $4 857 913 | 97 100 | 0,28% | Опціон пут |
| Brevan Howard Capital Management LP | $4 578 870 | 88 712 | 0,27% | Акції |
| SPX Gestao de Recursos Ltda | $4 252 550 | 85 000 | 0,25% | Акції |
| BNP PARIBAS FINANCIAL MARKETS | $4 187 061 | 83 691 | 0,24% | Акції |
| MILLENNIUM MANAGEMENT LLC | $3 752 250 | 75 000 | 0,22% | Опціон пут |
Інсайдери компанії 1 інсайдер · 0 керівники · 1 директори
| Інсайдер | Роль | Остання активність | Кількість акцій у власності | Купівлі за 12 міс. | Продажі за 12 міс. | Нетто 12 міс |
|---|---|---|---|---|---|---|
| Silvestre Vila Moret | Директор | 08 липня 2026 р. P | 3 000 000 | 7 | 0 | $4 253 109 |
Інсайдери згідно з формами SEC 3/4/5; чистий результат = лише відкритий ринок купівлі/продажу
Присутність в ETF Належить 1 ETF
Вага відображає лише прямі акціонерні володіння (N-PORT); фонди з кредитним плечем або похідними інструментами можуть мати додаткову експозицію за свопами, яка не відображається.
| Фонд | Вага | Одиниці | Станом на | Джерело |
|---|---|---|---|---|
| ARGT · Global X Funds | 6,34% | 1 079 097 NS | 31 липня 2026 р. | N-PORT |
GGAL Консенсус аналітиків Бичачі та ведмежі думки аналітиків, 12-місячна цільова ціна, потенціал зростання
12-місячна цільова ціна
10 аналітиків · 2026-09-30Середня цільова ціна $66.57 +85,5%
Мої показники Ваш персональний список спостереження — вибрані рядки з Повних фундаментальних даних
Виберіть показники, які для вас важливі — натисніть + поруч із будь-яким рядком у розділі Повна фундаментальна інформація вище.
Ваш вибір збережено і він буде застосовуватися до всіх тікерів.