MCHPP Microchip Technology Incorporated - Depositary Shares Each Representing a 1/20th Interest in a Share of 7.50% Series A Mandatory Convertible Preferred Stock
NASDAQ · Semiconductors close Oct 2, 2026MCHPP Stock Snapshot Price, market cap, P/E, EPS, ROE, debt/equity, 52-week range
MCHPP Stock Price Chart Daily OHLCV with technical indicators — pan, zoom, and customize your view
Bar granularity adapts to the selected period — hover the chart to see open/high/low/close for a bar.
About Microchip Technology Incorporated - Depositary Shares Each Representing a 1/20th Interest in a Share of 7.50% Series A Mandatory Convertible Preferred Stock Company overview from Wikipedia
Microchip Technology Incorporated is an American publicly traded semiconductor corporation that manufactures microcontrollers, microprocessors, integrated circuits (digital, mixed-signal, and analog), and flash memory.
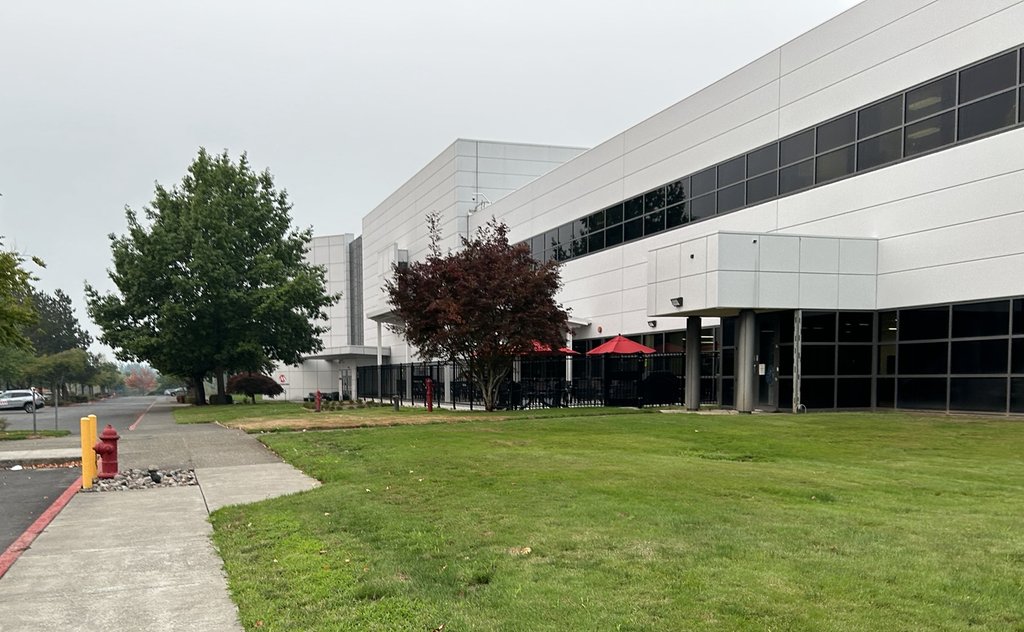
Its corporate headquarters is located in Chandler, Arizona. Its wafer fabs are located in Gresham, Oregon, and Colorado Springs, Colorado. The company's assembly/test facilities are in Chachoengsao, Thailand, and Calamba and Cabuyao, Philippines.
History
Origins
Microchip Technology was founded in February 14, 1989 when General Instrument spun off its microelectronics division as a wholly owned subsidiary. The newly formed company was a supplier of programmable non-volatile memory, microcontrollers, digital signal processors, card chip on board, and consumer integrated circuits. An initial public offering (IPO) later in the year was canceled because of the October 1987 stock market crash.
Microchip Technology became an independent company in 1989 when it was acquired by a group of venture capitalists led by Sequoia Capital. In the same year, Microchip Technology announced the release of small, inexpensive 8-bit reduced instruction set computing (RISC) microcontrollers for $2.40 apiece, whereas most RISC microcontrollers were 32-bit devices selling for hundreds of dollars.
1990-2024
In 1990, 60% of Microchip Technology's sales were from the disc drive industry and the product portfolio relied heavily on commodity EEPROM products. The company was losing US$2.5 million per quarter, had less than 6 months of cash in reserve, had exhausted lines of credit, and was failing to control expenses. Early in the year, the venture capital investors accepted an offer to sell Microchip Technology to Winbond Electronics Corporation of Taiwan for $15 million. Winbond Electronics backed out of the deal after the Taiwanese stock market decreased in May 1990. Vice President of Operations, Steve Sanghi, was named president and chief operating officer of Microchip Technology in 1990. After several quarters of losses, Sanghi oversaw Microchip Technology's transition from selling commodity-based products to specialized chips, such as the RISC technology.
Microchip Technology conducted an IPO in 1993, which Fortune magazine cited as the best-performing IPO of the year with a stock appreciation of 500% and over $1 billion in market capitalization. At the end of 2015, Microchip Technology posted its 100th consecutive quarter of profitability.
In March 2021, Sanghi was replaced as CEO by Ganesh Moorthy.
2024-present
In March 2024, Microchip furloughed production staff and non-manufacturing employees were forced to take a pay-cut for two weeks. This was done again in June. In late November, Moorthy retired as CEO and Steve Sanghi was appointed interim CEO, and was subsequently announced he would continue as CEO and Chairman on a permanent basis on July 2, 2025.
In early December 2024, Sanghi announced the closure of Fab 2 in Tempe, Arizona and also announced that Microchip would suspend its application for CHIPS and Science Act funding. On February 10, 2025, Microchip announced that it would again furlough employees intermittently throughout the rest of the year.
Acquisitions
In 1995, Microchip acquired KeeLoq technology from Nanoteq of South Africa for $10M in cash. Microchip Technology used the purchase to create the Secure Data Products Group.
On May 24, 2000, Microchip acquired a wafer fab in Puyallup, Washington that was formerly owned by Matsushita Electric Industrial Company. On October 19, 2007, due to the great recession, the facility, known as Fab 3, was sold for $30M from an unsolicited offer.
On October 27, 2000, Microchip purchased TelCom Semiconductor of Mountain View, California for $300M.
In 2002, Microchip acquired a wafer fab in Gresham, Oregon from Fujitsu for $183.5M. This fab became, and still is, Microchip's largest and is known as Fab 4.
On October 15, 2008, Microchip acquired Hampshire Company, a company that sold large-format universal touch screen controller electronics and related software.
On February 20, 2009, Microchip acquired Australia-based HI-TECH Software.
On January 11, 2010, Microchip acquired Thomas H. Lee's Sunnyvale, California-based ZeroG Wireless for an undisclosed amount after a year-long partnership. The deal allowed Microchip to provide a Wi-Fi product for its PIC microcontrollers.
In April 2010, Microchip completed the acquisition of Silicon Storage Technology (SST) from for about $292M. Microchip and Cerberus Capital Management both made offers for the company. Microchip sold several SST flash memory assets back to Bing Yeh, co-founder of SST, to another one his companies the next month.
In 2012, Microchip acquired German-based Ident Technology AG, California based Roving Networks, and Standard Microsystems Corporation.
On June 3, 2013, Microchip acquired Novocell Semiconductor, Inc. through its Silicon Storage Technology (SST) subsidiary.
In 2014, Microchip acquired Supertex, Inc and Belgian-based EqcoLogic on February 10, and Taiwan-based ISSC Technologies on May 22.
On August 3, 2015, Microchip acquired IC manufacturer Micrel for about $839M.
In January 2016, Microchip purchased San Jose, California-based Atmel for $3.56bn. JPMorgan Chase advised Microchip while Qatalyst Partners advised Atmel.
In May 2018, Microchip acquired Microsemi Corporation.
In October 2020, Microchip acquired New Zealand-based Tekron International Limited for an undisclosed amount.
In April 2024, Microchip acquired both South Korea-based VSI Co. Ltd. and Neuronix AI Labs.
In September 2026, Microchip acquired Israeli AI company Hailo.
Products
Microchip offers 8, 16, and 32-bit microcontrollers including PIC and AVR microcontrollers, microprocessors, analog power management and conversion, CAN and LIN serial communication interface devices, high-voltage MEMS and piezoelectric drivers, ultrasound multiplexers, digital signal controllers, embedded controllers, memory products (including serial EEPROM, serial SRAM, serial flash, serial NvSRAM, serial EERAM, parallel EEPROM, parallel one-time programmable flash, parallel flash and CryptoMemory devices.)
Microchip also offers custom programming, hardware and software development tools, and reference designs. Available reference designs include complete systems, subsystems or functions which are purpose-built and include design files, software and support.
Microchip crypto element devices that provide authentication, data integrity, and confidentiality in a variety of applications, such as disposables, accessories and nodes; Timing, communication and real-time clock and calendar products; USB products; Power Management Integrated Circuits (PMICs); and networking products including Ethernet interface and wireless products.
Product milestones
In April 2009, Microchip Technology announced the nanoWatt XLP microcontrollers, claiming the world's lowest sleep current. Microchip Technology had sold more than 6 billion microcontrollers as of 2009. As of 2011, Microchip Technology ships over a billion processors every year. In September 2011, Microchip Technology shipped the 10 billionth PIC microcontroller.
== Wafer fabs ==
Source: Wikipedia, CC BY-SA 4.0 · View on Wikipedia ↗
10-Year Performance Revenue, net income, margins and EPS trends
Valuation P/E, P/S, P/B, EV/EBITDA ratios — is the stock expensive or cheap?
Not enough fundamentals data to compute this ratio group yet.
Profitability Gross, operating and net margins; ROE, ROA, ROIC
Not enough fundamentals data to compute this ratio group yet.
Financial Health Debt, liquidity, solvency — balance sheet strength
Not enough fundamentals data to compute this ratio group yet.
Growth Revenue, EPS and net income growth: YoY, 3Y CAGR, 5Y CAGR
Not enough fundamentals data to compute this ratio group yet.
Capital Efficiency Asset turnover, inventory turnover, receivables turnover
Not enough fundamentals data to compute this ratio group yet.
value · ≈ 5Y avg · industry median · verdict relative to median
Dividends Yield, payout ratio, dividend history, 5Y CAGR
| Ex-date | Amount | Currency | Yield |
|---|---|---|---|
| Sep 1, 2026 | $0.94 | USD | ≈6.1% |
| Jun 1, 2026 | $0.94 | USD | ≈4.8% |
| Feb 27, 2026 | $0.94 | USD | ≈5.6% |
| Dec 1, 2025 | $0.94 | USD | ≈5.4% |
| Aug 29, 2025 | $0.94 | USD | ≈3.0% |
| May 30, 2025 | $0.84 | USD | ≈1.5% |
Earnings History EPS actual vs estimate, surprise %, beat rate, next earnings date
| Period | Report | EPS Actual | EPS Est | Surprise |
|---|---|---|---|---|
| March 31, 2027 | $0.76 | $0.71 | 7.4% | |
| June 30, 2026 | $0.76 | $0.71 | 7.4% | |
| March 31, 2026 | $0.57 | $0.52 | 10.6% | |
| Dec. 31, 2025 | $0.44 | $0.42 | 4.7% | |
| Sept. 30, 2025 | $0.35 | $0.34 | 2.6% | |
| June 30, 2025 | $0.27 | $0.24 | 11.8% | |
| March 31, 2025 | $0.11 | $0.11 | 2.6% |
Institutional owners (13F) 86 filers · $2.0B total · As of June 30, 2026
Institutions that report holding this stock in their quarterly SEC Form 13F. Long positions only; a single filer may appear twice for separate option legs. Large offsetting put/call legs typically reflect market-making or hedged inventory, not directional conviction.
| New positions | Exited positions | Increased | Decreased | Net shares change |
|---|---|---|---|---|
| 15 (-5 vs prior Q) | 10 (+1 vs prior Q) | 20 (-7 vs prior Q) | 38 (+20 vs prior Q) | +619K |
Compared to Q1 2026. SEC Form 13F filings are due within 45 days of quarter-end plus a short buffer for late filers — quarters still inside that window are skipped in favor of the most recent fully-reported pair.
| Institution | Value | Shares | % of tracked 13F | Type |
|---|---|---|---|---|
| VOYA INVESTMENT MANAGEMENT LLC | $383,362,828 | 4,997,560 | 18.80% | Shares |
| Capital International Investors | $239,391,659 | 3,120,736 | 11.74% | Shares |
| BlackRock, Inc. | $177,288,160 | 2,311,148 | 8.69% | Shares |
| Aequim Alternative Investments LP | $130,407,000 | 1,700,000 | 6.40% | Shares |
| Calamos Advisors LLC | $111,891,814 | 1,458,634 | 5.49% | Shares |
| Magnetar Financial LLC | $75,582,493 | 982,230 | 3.71% | Shares |
| FRANKLIN RESOURCES INC | $67,108,746 | 874,837 | 3.29% | Shares |
| TWO SIGMA INVESTMENTS, LP | $57,007,113 | 743,151 | 2.80% | Shares |
| VAN ECK ASSOCIATES CORP | $56,995,453 | 742,999 | 2.80% | Shares |
| SUSQUEHANNA ADVISORS GROUP, INC. | $53,697,000 | 700,000 | 2.63% | Shares |
| AMERIPRISE FINANCIAL INC | $52,707,441 | 687,100 | 2.58% | Shares |
| ADVENT CAPITAL MANAGEMENT /DE/ | $46,498,208 | 603,716 | 2.28% | Shares |
| MacKay Shields LLC | $46,450,746 | 603,491 | 2.28% | Shares |
| Weiss Asset Management LP | $46,107,747 | 600,000 | 2.26% | Shares |
| MIRAE ASSET GLOBAL ETFS HOLDINGS Ltd. | $43,202,919 | 563,198 | 2.12% | Shares |
| CSS LLC/IL | $42,957,787 | 558,552 | 2.11% | Shares |
| Walleye Capital LLC | $38,510,000 | 500,000 | 1.89% | Shares |
| STATE STREET CORP | $35,305,662 | 459,769 | 1.73% | Shares |
| Portman Square Capital LLP | $34,659,000 | 450,000 | 1.70% | Shares |
| FMR LLC | $25,710,478 | 334,467 | 1.26% | Shares |
| BANK OF AMERICA CORP /DE/ | $23,670,942 | 308,577 | 1.16% | Shares |
| Alberta Investment Management Corp | $23,013,000 | 300,000 | 1.13% | Shares |
| INFRASTRUCTURE CAPITAL ADVISORS, LLC | $20,520,769 | 267,511 | 1.01% | Shares |
| WOLVERINE ASSET MANAGEMENT LLC | $20,348,034 | 264,806 | 1.00% | Shares |
| TPG GP A, LLC | $19,217,500 | 250,000 | 0.94% | Shares |
| CITIGROUP INC | $18,327,707 | 238,922 | 0.90% | Shares |
| Nuveen, LLC | $15,342,000 | 200,000 | 0.75% | Shares |
| SSI INVESTMENT MANAGEMENT LLC | $14,015,325 | 182,325 | 0.69% | Shares |
| Sculptor Capital LP | $13,069,737 | 170,077 | 0.64% | Shares |
| MORGAN STANLEY | $12,992,296 | 169,369 | 0.64% | Shares |
| SCHRODER INVESTMENT MANAGEMENT GROUP | $12,822,641 | 170,650 | 0.63% | Shares |
| Point72 Asset Management, L.P. | $11,139,293 | 145,000 | 0.55% | Shares |
| GABELLI FUNDS LLC | $9,780,525 | 127,500 | 0.48% | Shares |
| BlueCrest Capital Management Ltd | $8,997,162 | 117,288 | 0.44% | Shares |
| JANE STREET GROUP, LLC | $5,326,666 | 69,439 | 0.26% | Shares |
| Invesco Ltd. | $4,602,600 | 60,000 | 0.23% | Shares |
| Nicholas Investment Partners, LP | $3,909,608 | 50,860 | 0.19% | Shares |
| LAFFER TENGLER INVESTMENTS, INC. | $3,904,399 | 50,820 | 0.19% | Shares |
| Jefferies Financial Group Inc. | $3,615,573 | 47,133 | 0.18% | Shares |
| D. E. Shaw & Co., Inc. | $3,072,657 | 40,000 | 0.15% | Shares |
| GOLDMAN SACHS GROUP INC | $2,805,745 | 36,576 | 0.14% | Shares |
| JPMORGAN CHASE & CO | $2,532,203 | 44,448 | 0.12% | Shares |
| BARCLAYS PLC | $2,137,294 | 27,862 | 0.10% | Shares |
| WELLS FARGO & COMPANY/MN | $2,058,436 | 26,834 | 0.10% | Shares |
| Elequin Capital, LP | $1,516,504 | 19,750 | 0.07% | Shares |
| Russell Investments Group, Ltd. | $1,436,164 | 936,100 | 0.07% | Shares |
| Uniplan Investment Counsel, Inc. | $1,435,740 | 18,716 | 0.07% | Shares |
| UBS Group AG | $1,135,999 | 14,809 | 0.06% | Shares |
| Calamos Wealth Management LLC | $963,247 | 12,557 | 0.05% | Shares |
| Dakota Wealth Management | $848,413 | 11,060 | 0.04% | Shares |
Company insiders 12 insiders · 6 officers · 7 directors
| Insider | Role | Last activity | Shares owned | Buys 12m | Sells 12m | Net 12m |
|---|---|---|---|---|---|---|
| Steve Sanghi | President, CEO and Chair of Bd | Aug. 15, 2026 M | 9,435,057 | 0 | 0 | $0 |
| James Eric Bjornholt | SENIOR CORPORATE VP AND CFO | Aug. 15, 2026 M | 32,685 | 0 | 2 | $-376,894 |
| Richard J Simoncic | CHIEF OPERATING OFFICER | Aug. 15, 2026 M | 134,668 | 0 | 0 | $0 |
| Stephanus Duvenhage | Sr. Corp VP, Analog Bus Unit | Sept. 1, 2026 A | 7,210 | 0 | 0 | $0 |
| Joseph R Krawczyk II | SR. CORP VP, WW CLIENT ENGMT | Sept. 1, 2026 A | 16,599 | 0 | 0 | $0 |
| Mathew B Bunker | SR CORPORATE VP, OPERATIONS | Sept. 1, 2026 A | 20,243 | 0 | 0 | $0 |
| Richard B. Cassidy II | Director | Aug. 18, 2026 A | 4,348 | 0 | 0 | $0 |
| Karen Marie Rapp | Director | Aug. 18, 2026 A | 14,227 | 0 | 0 | $0 |
| Ellen Barker | Director | Aug. 18, 2026 A | 6,887 | 0 | 0 | $0 |
| Victor Peng | Director | Aug. 18, 2026 A | 5,416 | 0 | 0 | $0 |
| Mitchell R Little | Director | Aug. 18, 2026 A | 1,558 | 0 | 0 | $0 |
| Matthew W Chapman | Director | Aug. 18, 2026 A | 20,755 | 0 | 0 | $0 |
Insiders from SEC Form 3/4/5 filings; net = open-market P/S only
ETF ownership Held by 3 ETFs
Weight reflects direct equity holdings (N-PORT) only; leveraged or derivative-based funds may hold additional swap exposure not shown.
MCHPP Analyst Consensus Bullish and bearish analyst opinions, 12-month price target, upside
Peer comparison (GICS sub-industry) Key metrics vs sector peers
FY basis, prices as of each company's last fiscal year-end close.
| Ticker | Market Cap | P/E | Rev YoY | Net Margin | ROE | Gross Margin |
|---|---|---|---|---|---|---|
| MCHPP | · | · | · | · | · | · |
| QCOM | $181.72B | 33.8 | 13.7% | 12.5% | 22.7% | · |
| MPWR | $44.15B | 70.5 | 26.4% | 22.3% | 18.0% | 55.2% |
| ALAB | $28.31B | 136.4 | 115.1% | 25.7% | 17.5% | 75.7% |
| MRVL | $68.75B | 26.4 | 42.1% | 32.6% | 19.3% | 51.0% |
| MCHP | $35.02B | 293.7 | 7.1% | 4.9% | 3.5% | 57.7% |
| CBRS | · | · | · | · | · | · |
| ON | $21.48B | 186.7 | -15.3% | 2.0% | 1.5% | 33.1% |
| GFS | · | 22.0 | · | 13.0% | 7.8% | 24.9% |
| MTSI | $9.49B | -174.5 | 32.6% | -5.6% | -4.3% | 54.7% |
| SITM | $9.29B | -205.3 | 61.2% | -13.1% | -3.8% | 53.6% |
My Metrics Your personal watchlist — selected rows from Full Fundamentals
Pick the metrics that matter to you — click the + next to any row in Full Fundamentals above.
Your selection is saved and follows you across all tickers.