
SIG Signet Jewelers Limited Common Shares
NYSE · Retail · Auf SEC EDGAR ansehen ↗ 10-K/10-Q Sep 9, 2026SIG Aktien-Snapshot Kurs, Marktkapitalisierung, P/E, EPS, ROE, Schulden/Eigenkapital, 52-Wochen-Spanne
SIG Aktienkurs-Chart Täglich OHLCV mit technischen Indikatoren — Schwenken, Zoom und Ansicht anpassen
Die Balkengranularität passt sich der ausgewählten Periode an – bewegen Sie den Mauszeiger über das Diagramm, um Eröffnungs-/Höchst-/Tiefst-/Schlusskurse für einen Balken anzuzeigen.
| Ex-Datum | Split | Typ |
|---|---|---|
| 11. September 2008 | 1-for-2 | Umgekehrt |
| 19. Oktober 2004 | 3-for-1 | Vorwärts |
| 4. September 1997 | 1-for-10 | Umgekehrt |
Über Signet Jewelers Limited Common Shares Unternehmensübersicht von Wikipedia
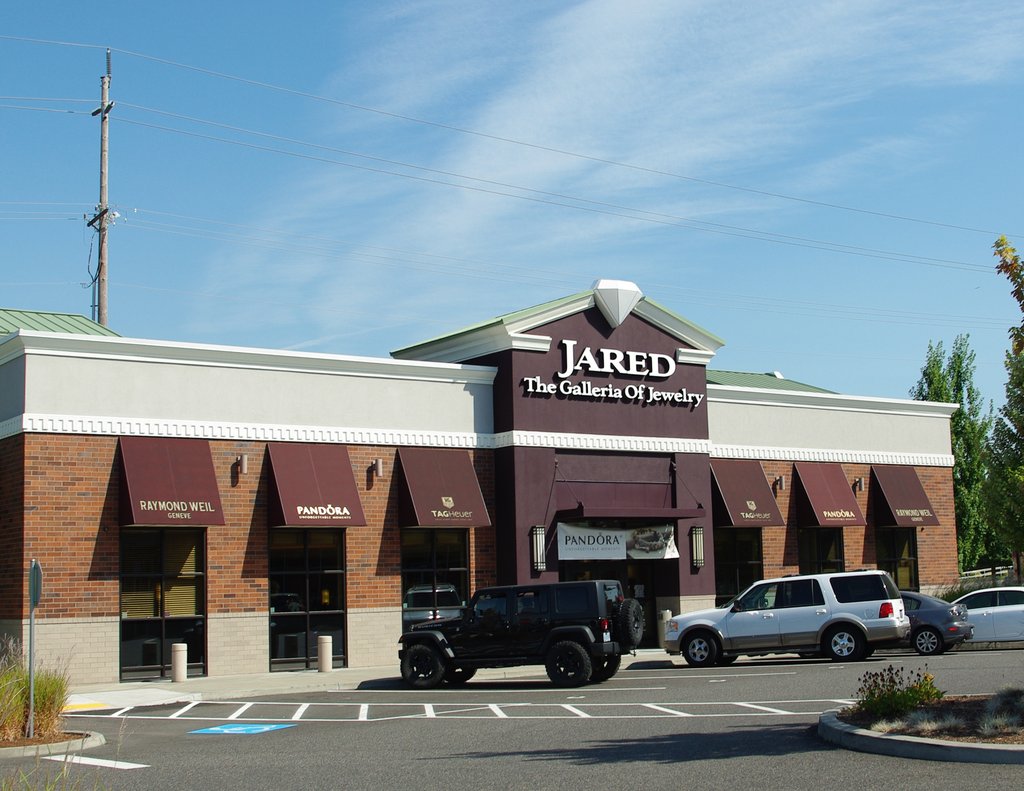
Signet Jewelers Limited, von 1949 bis 1993 Ratner Group und von 1993 bis September 2008 Signet Group plc genannt, ist die weltgrößte Juwelierkette. Die Aktien des in Bermuda ansässigen Unternehmens, das in Birmingham, Großbritannien seinen Verwaltungssitz hat, werden sowohl an der New York Stock Exchange als auch an der London Stock Exchange gehandelt. Das Unternehmen konzentriert sich auf den Schmuck- und Uhrenverkauf im mittleren Preissegment und ist Marktführer in den USA und in Großbritannien. Die zum Unternehmen gehörenden Ketten „Jared“ in den USA sowie „Ernest Jones“ und „Leslie Davis“ in Großbritannien sind im gehobenen Preissegment aktiv.
Unternehmensgeschichte
Die Gründung des Unternehmens erfolgte 1949 durch Leslie Ratner. Das Unternehmen war in der Lage, bis in die späten 1980er aus eigener Kraft zu expandieren. In den späten 1980er Jahren und zu Beginn der 1990er wuchs die zu dem Zeitpunkt noch mehrheitlich in Familienbesitz befindliche Unternehmensgruppe vor allem, indem sie andere Juwelierläden übernahm.
Der Ruf des Unternehmens nahm erheblichen Schaden, als Gerald Ratner, Sohn von Leslie Ratner und zu dem Zeitpunkt Vorstandsvorsitzender des Unternehmens, 1991 Rede vor dem britischen Institute of Directors unterhaltsam gestalten wollte und sich abfällig über die Qualität einzelner Produkte äußerte:
Er provozierte weitere Lacher, als er erklärte, dass einige der Ohrringe nicht mehr kosten würden als ein Krabbensandwich bei Marks & Spencers, aber weniger lange halten würden als dieses. Über seine Äußerungen wurde in den Tagen darauf von der Presse ausführlich berichtet. Der Aktienpreis des Unternehmens fiel von 2 britischen Pfund auf weniger als 8 Pence, wodurch ein Börsenwert von mehr als 500 Millionen britischen Pfund vernichtet wurde. Das Unternehmen, das 1991 noch einen Gewinn von 112 Millionen britischen Pfund ausgewiesen hatte, wies 1992 einen Verlust von 122 Millionen britischen Pfund aus. Der Marketing-Experte Tom Blacket kommentierte, dass es Konsumenten mittlerweile peinlich sei, eines der Produkte des Unternehmens zu besitzen. In der Folge wurden zwischen Januar 1992 und Mai 1994 mehr als 300 Filialen geschlossen. Das Unternehmen musste restrukturiert werden, Ratner selbst sah sich gezwungen, das Unternehmen zu verlassen.
Der als Beleg für mangelndes Urteilsvermögen und Verachtung gegenüber den eigenen Kunden eingestufte Patzer Ratners führte im englischen Sprachgebrauch zu dem Ausdruck „doing a Ratner“ – ein Wortspiel, das die Bedeutung von „to rat“ (deutsch: jemanden verraten oder verpfeifen bzw. jemanden im Stich lassen) aufgreift.
Vermarktung
Im Januar 2010 gehörten zu Signet 1933 Filialen. 1379 der Filialen befanden sich in den Vereinigten Staaten, wo das Unternehmen als Kay Jewelers, Jared – The Galleria of Jewelry und mit den Regionalfilialen JB Robinson Jewelers, Marks & Morgan Jewelers, Belden Jewelers, Osterman Jewelers, Shaw’s Jewelers, Weisfield’s Jewelers, LeRoy’s Jewelers, Rogers Jewelers, Goodman Jewelers und Friedlander’s Jewelers auftritt. Kay Jewelers ist darunter die wichtigste Marke, die ausschließlich in Einkaufszentren Niederlassungen führt. Jared – The Galleria of Jewelry operiert dagegen ausschließlich außerhalb von Einkaufszentren. Alle US-amerikanischen Filialen werden von einer Tochtergesellschaft von Signet Jewelry, der Sterling Jewelers, Inc. geführt. Die 553 Filialen in Großbritannien operieren unter den Namen H. Samuel, Ernest Jones und Leslie Davis. H. Samuel ist mit 348 Filialen die wichtigste britische Marke.
Die britische Marke Ernest Jones konzentriert sich auf hochpreisigere Ware als H. Samuel. Zu den von Ernest Jones verkauften Uhren gehören unter anderem die Marken TAG Heuer, RADO Switzerland, Gucci, Longines und Omega; einige der Filialen führen auch Uhren der Marke Rolex. Per 2. Januar 2010 operierten 191 Filialen unter diesem Namen.
Die Marke Leslie Davis wird von Signet Jeweler als Jewelers of Distinction (der Juwelier mit dem feinen Unterschied) vermarktet. Die Auswahl ist etwas modeorientierter als in den Ernest-Jones-Filialen. Neben Uhren von Marken wie Omega und TAG Heuer werden auch Uhren von Modedesignern wie Gucci, Armani, Christian Dior und Burberry angeboten. 2011 gehörten elf Leslie-Davis-Filialen zum Unternehmen.
Quelle: Wikipedia, CC BY-SA 4.0 · Auf Wikipedia ansehen ↗
10-Jahres-Performance Umsatz-, Nettoergebnis-, Margen- und EPS-Trends
Bewertung P/E-, P/S-, P/B-, EV/EBITDA-Verhältnisse — ist die Aktie teuer oder günstig?
| Kennzahl | 5-Jahres-Trend | SIG | 5-Jahres-Durchschnitt | Peer-Median | Fazit |
|---|---|---|---|---|---|
| P/E (TTM) | 13.3 | · | · | · | |
| P/S | 0.7 | · | · | · | |
| P/B (K/B) | 2.4 | · | · | · | |
| Price / FCF (Kurs / FCF) | 8.8 | · | · | · | |
| Price / Cash Flow (Kurs / Cashflow) | 6.8 | · | · | · | |
| Price / Tangible Book (Kurs / Materieller Buchwert) | 3.7 | · | · | · |
Der Median der Vergleichsgruppe wird pro Kennzahl standardisiert berechnet und stimmt möglicherweise nicht immer mit der für diese Aktie angezeigten TTM/MRQ-Basis überein.
Rentabilität Brutto-, Betriebs- und Nettomargen; ROE, ROA, ROIC
| Kennzahl | 5-Jahres-Trend | SIG | 5-Jahres-Durchschnitt | Peer-Median | Fazit |
|---|---|---|---|---|---|
| Bruttogewinnmarge (TTM) | 39.1% | · | · | · | |
| Betriebsgewinnmarge (TTM) | 6.8% | · | · | · | |
| EBITDA-Marge (TTM) | 8.9% | · | · | · | |
| Vorgewinnmarge (TTM) | 6.8% | · | · | · | |
| Nettogewinnmarge (TTM) | 5.2% | · | · | · | |
| ROA | 5.0% | · | · | · | |
| ROE | 15.9% | · | · | · | |
| ROIC | 14.8% | · | · | · |
Finanzielle Gesundheit Verschuldung, Liquidität, Solvenz — Bilanzstärke
| Kennzahl | 5-Jahres-Trend | SIG | 5-Jahres-Durchschnitt | Peer-Median | Fazit |
|---|---|---|---|---|---|
| Current Ratio (Liquiditätsgrad) | 1.6 | · | · | · | |
| Quick Ratio | 0.5 | · | · | · |
Wachstum Umsatz-, EPS- und Nettoergebniswachstum: YoY, 3-Jahres-CAGR, 5-Jahres-CAGR
| Kennzahl | 5-Jahres-Trend | SIG | 5-Jahres-Durchschnitt | Peer-Median | Fazit |
|---|---|---|---|---|---|
| Revenue YoY (Umsatz YoY) | 1.6% | · | · | · | |
| Revenue CAGR 3Y (Umsatz CAGR 3J) | -4.6% | · | · | · | |
| Revenue CAGR 5Y (Umsatz CAGR 5J) | 5.5% | · | · | · | |
| EPS YoY (EPS VjV) | 126.0% | · | · | · | |
| Net Income YoY (Nettogewinn YoY) | 381.1% | · | · | · | |
| EPS CAGR 3Y (EPS CAGR 3J) | 2.2% | · | · | · | |
| Net Income CAGR 3Y (Nettoergebnis CAGR 3J) | -7.9% | · | · | · |
Kapitaleffizienz Umsatz pro Vermögenswert, Lagerumschlag, Forderungsumschlag
| Kennzahl | 5-Jahres-Trend | SIG | 5-Jahres-Durchschnitt | Peer-Median | Fazit |
|---|---|---|---|---|---|
| Asset Turnover (Umsatz / Vermögenswerte) | 1.2 | · | · | · | |
| Inventory Turnover (Lagerumschlag) | 2.1 | · | · | · | |
| Revenue / Employee (Umsatz / Mitarbeiter) | ≈$251.5K | · | · | · |
Wert · ≈ 5-Jahres-Durchschnitt · Branchenmedian · Urteil relativ zum Median
Dividenden Rendite, Ausschüttungsquote, Dividendenhistorie, 5-Jahres-CAGR
| Ex-Datum | Betrag | Währung | Rendite |
|---|---|---|---|
| Okt 23, 2026 | $0,35 | USD | ≈0.90% |
| Jul 24, 2026 | $0,35 | USD | ≈0.77% |
| Apr 24, 2026 | $0,35 | USD | ≈0.76% |
| Jul 25, 2025 | $0,32 | USD | ≈1.4% |
| Apr 25, 2025 | $0,32 | USD | ≈2.0% |
| Jan 24, 2025 | $0,29 | USD | ≈1.9% |
| Okt 25, 2024 | $0,29 | USD | ≈1.2% |
| Jul 26, 2024 | $0,29 | USD | ≈1.3% |
| Apr 25, 2024 | $0,29 | USD | ≈0.98% |
| Jan 25, 2024 | $0,23 | USD | ≈0.92% |
| Okt 26, 2023 | $0,23 | USD | ≈1.3% |
| Jul 27, 2023 | $0,23 | USD | ≈1.1% |
| Apr 27, 2023 | $0,23 | USD | ≈1.1% |
| Jan 26, 2023 | $0,20 | USD | ≈1.1% |
| Okt 27, 2022 | $0,20 | USD | ≈1.2% |
| Jul 28, 2022 | $0,20 | USD | ≈1.3% |
| Apr 28, 2022 | $0,20 | USD | ≈0.99% |
| Jan 27, 2022 | $0,18 | USD | ≈0.66% |
| Okt 28, 2021 | $0,18 | USD | ≈0.40% |
| Jul 29, 2021 | $0,18 | USD | ≈0.28% |
Ergebnisverlauf EPS Ist vs. Schätzung, Überraschung %, Beat-Rate, nächstes Ergebnisdatum
| Zeitraum | Bericht | EPS Actual | EPS est. | Überraschung |
|---|---|---|---|---|
| 30. Juni 2027 | Sep 9, 2026 | $2.19 | $1.75 | 24.9% |
| 31. März 2027 | Jun 2, 2026 | $1.56 | $1.37 | 13.9% |
| 30. September 2026 | $2.19 | $1.75 | 24.9% | |
| 30. Juni 2026 | $1.56 | $1.37 | 13.9% | |
| 31. März 2026 | $6.25 | $6.17 | 1.2% | |
| 31. Dezember 2025 | $0.63 | $0.29 | 117.9% | |
| 30. September 2025 | $1.61 | $1.24 | 30.1% | |
| 30. Juni 2025 | $1.18 | $1.04 | 13.3% |
Vollständige Fundamentaldaten Alle Kennzahlen nach Jahr — Gewinn- und Verlustrechnung, Bilanz, Cashflow
Gewinn- und Verlustrechnung
| Kennzahl | Trend | 2026 | 2025 | 2024 | 2023 | 2022 | 2021 | 2020 |
|---|---|---|---|---|---|---|---|---|
| Revenue | $6.81B | $6.70B | · | · | $7.83B | · | · | |
| Cost of Revenue | $4.12B | $4.08B | · | · | $4.70B | · | · | |
| Gross Profit | $2.69B | $2.63B | · | · | $3.12B | · | · | |
| SG&A Expense | $2.17B | $2.12B | · | · | $2.23B | · | · | |
| Operating Income | $393M | $111M | · | · | $903M | · | · | |
| Interest Expense | · | · | · | · | $17M | · | · | |
| Other Non-op | $1M | $4M | · | · | $-2M | · | · | |
| Pretax Income | $398M | $124M | · | · | $884M | · | · | |
| Income Tax | $104M | $63M | · | · | $114M | · | · | |
| Net Income | $294M | $61M | · | · | $770M | · | · | |
| EPS (Basic) | $7.13 | $-0.81 | · | · | $14.01 | · | · | |
| EPS (Diluted) | $7.08 | $-0.81 | · | · | $12.22 | · | · | |
| Shares (Basic) | 41,300,000 | 44,100,000 | · | · | 52,500,000 | · | · | |
| Shares (Diluted) | 41,600,000 | 44,100,000 | · | · | 63,000,000 | · | · | |
| EBITDA | $541M | $259M | · | · | $1.07B | · | · |
Bilanz
| Kennzahl | Trend | 2026 | 2025 | 2024 | 2023 | 2022 | 2021 | 2020 |
|---|---|---|---|---|---|---|---|---|
| Cash & Equivalents | $875M | $604M | $729M | $690M | $1.42B | $1.30B | $1.07B | |
| Receivables | · | · | · | · | $18M | $10M | $28M | |
| Inventory | $1.94B | $1.94B | $1.98B | $2.09B | $2.06B | $2.02B | $2.39B | |
| Other Current Assets | $190M | $157M | $202M | $194M | $209M | $187M | $328M | |
| Current Assets | $3.02B | $2.71B | $2.92B | $2.99B | $3.73B | $3.64B | $4.02B | |
| PP&E (Net) | $499M | $506M | $475M | $554M | $576M | $544M | $687M | |
| PP&E (Gross) | $2.06B | $1.97B | · | · | $1.82B | · | · | |
| Accum. Depreciation | $1.56B | $1.46B | $1.47B | $1.42B | $1.25B | $1.21B | $1.09B | |
| Goodwill | $428M | $482M | $754M | $754M | $485M | $245M | $238M | |
| Intangibles | $286M | $307M | $402M | $406M | $314M | $191M | $179M | |
| Other Non-current Assets | $291M | $315M | $315M | $288M | $226M | $241M | $205M | |
| Total Assets | $5.95B | $5.73B | $6.15B | $6.09B | $6.58B | $6.18B | $6.88B | |
| Accounts Payable | $772M | $767M | $599M | $571M | $900M | $700M | $329M | |
| Accrued Liabilities | $161M | $181M | · | · | $243M | · | · | |
| Short-term Debt | · | · | · | · | $0 | · | $22M | |
| Current Liabilities | $1.89B | $1.83B | $1.75B | $1.85B | $2.07B | $1.90B | $1.68B | |
| Capital Leases | $930M | $900M | $818M | $832M | $1.01B | $1.09B | $1.33B | |
| Deferred Tax | $175M | $173M | $202M | $167M | $161M | $171M | $96M | |
| Other Non-current Liabilities | $83M | $85M | $94M | $98M | $118M | $109M | $113M | |
| Total Liabilities | $3.99B | $3.87B | $3.74B | $3.82B | $4.36B | $4.21B | $5.28B | |
| Long-term Debt | · | $0 | $148M | $148M | · | · | · | |
| Total Debt | · | $0 | · | · | $147M | · | · | |
| Common Stock | $13M | $13M | $13M | $13M | $13M | $13M | $13M | |
| Paid-in Capital | $120M | $120M | $182M | $220M | $231M | $252M | $246M | |
| Retained Earnings | $3.99B | $3.75B | $3.78B | $3.24B | $2.88B | $2.30B | $2.04B | |
| Treasury Stock | $1.93B | $1.75B | $1.62B | $1.60B | $1.21B | $965M | $985M | |
| AOCI | $-219M | $-278M | $-270M | $-260M | $-351M | $-284M | $-328M | |
| Stockholders' Equity | $1.97B | $1.85B | $2.08B | $1.61B | $1.56B | $1.32B | $984M | |
| Liabilities + Equity | $5.95B | $5.73B | $6.15B | $6.09B | $6.58B | $6.18B | $6.88B | |
| Shares Outstanding | 40,400,000 | 43,200,000 | 44,700,000 | 44,800,000 | 49,900,000 | 52,700,000 | 52,300,000 |
Cashflow
| Kennzahl | Trend | 2026 | 2025 | 2024 | 2023 | 2022 | 2021 | 2020 |
|---|---|---|---|---|---|---|---|---|
| D&A | $148M | $148M | · | · | $164M | · | · | |
| Stock-based Comp | $27M | $22M | · | · | $46M | · | · | |
| Deferred Tax | $21M | $-31M | · | · | $100.0K | · | · | |
| Amort. of Intangibles | $500.0K | $900.0K | · | · | $1M | · | · | |
| Restructuring | $26M | $12M | · | · | $-3M | · | · | |
| Other Non-cash | $189M | $390M | · | · | $278M | · | · | |
| Operating Cash Flow | $679M | $591M | · | · | $1.26B | · | · | |
| CapEx | $154M | $153M | · | · | $130M | · | · | |
| Investing Cash Flow | $-158M | $-159M | · | · | $-643M | · | · | |
| Stock Repurchased | $205M | $138M | · | · | $312M | · | · | |
| Net Stock Activity | $-205M | $-138M | · | · | $-312M | · | · | |
| Dividends Paid | $52M | $49M | · | · | $19M | · | · | |
| Financing Cash Flow | $-265M | $-1.20B | · | · | $-367M | · | · | |
| Taxes Paid | $78M | $116M | · | · | $121M | · | · | |
| Free Cash Flow | $525M | $438M | · | · | $1.13B | · | · | |
| Levered FCF | · | · | · | · | $1.11B | · | · |
Rentabilität
| Kennzahl | Trend | 2026 | 2025 | 2024 | 2023 | 2022 | 2021 | 2020 |
|---|---|---|---|---|---|---|---|---|
| Gross Margin | 39.6% | 39.2% | · | · | 39.9% | · | · | |
| Operating Margin | 5.8% | 1.7% | · | · | 11.5% | · | · | |
| Net Margin | 4.3% | 0.91% | · | · | 9.8% | · | · | |
| Pretax Margin | 5.8% | 1.8% | · | · | 11.3% | · | · | |
| EBITDA Margin | 7.9% | 3.9% | · | · | 13.6% | · | · | |
| ROA | 5.0% | 1.1% | · | · | 11.9% | · | · | |
| ROE | 15.9% | 3.4% | · | · | 49.7% | · | · | |
| ROIC | 14.8% | 2.9% | · | · | 46.0% | · | · |
Liquidität & Solvenz
| Kennzahl | Trend | 2026 | 2025 | 2024 | 2023 | 2022 | 2021 | 2020 |
|---|---|---|---|---|---|---|---|---|
| Current Ratio | 1.6 | 1.5 | · | · | 1.8 | · | · | |
| Quick Ratio | 0.5 | 0.3 | · | · | 0.7 | · | · | |
| Debt / Equity | · | 0.0 | · | · | 0.1 | · | · | |
| LT Debt / Equity | · | 0.0 | · | · | 0.1 | · | · | |
| Interest Coverage | · | · | · | · | 53.5 | · | · |
Effizienz
| Kennzahl | Trend | 2026 | 2025 | 2024 | 2023 | 2022 | 2021 | 2020 |
|---|---|---|---|---|---|---|---|---|
| Asset Turnover | 1.2 | 1.2 | · | · | 1.2 | · | · | |
| Inventory Turnover | 2.1 | 2.0 | · | · | 2.2 | · | · | |
| Receivables Turnover | · | · | · | · | 443.4 | · | · |
Pro Aktie
| Kennzahl | Trend | 2026 | 2025 | 2024 | 2023 | 2022 | 2021 | 2020 |
|---|---|---|---|---|---|---|---|---|
| Book Value / Share | $48.67 | $42.87 | · | · | $31.34 | · | · | |
| Revenue / Share | $163.79 | $152.01 | · | · | $124.22 | · | · | |
| Cash Flow / Share | $16.32 | $13.40 | · | · | $19.96 | · | · | |
| Cash / Share | $21.65 | $13.98 | · | · | $28.42 | · | · | |
| Dividend Paid / Share | $1.28 | $1.16 | · | · | $0.54 | · | · | |
| EPS (TTM) | $7.08 | $-0.81 | · | · | $12.22 | · | · |
Wachstumsraten
| Kennzahl | Trend | 2026 | 2025 | 2024 | 2023 | 2022 | 2021 | 2020 |
|---|---|---|---|---|---|---|---|---|
| Revenue YoY | 1.6% | -6.5% | · | · | 49.7% | · | · | |
| Revenue CAGR 3Y | -4.6% | -5.0% | · | · | · | · | · | |
| Revenue CAGR 5Y | 5.5% | · | · | · | · | · | · | |
| EPS CAGR 3Y | 2.2% | · | · | · | · | · | · | |
| Net Income YoY | 381.1% | -92.5% | · | · | · | · | · | |
| Net Income CAGR 3Y | -7.9% | -57.0% | · | · | · | · | · | |
| Dividends Paid CAGR 5Y | 21.8% | · | · | · | · | · | · |
Bewertung (TTM)
| Kennzahl | Trend | 2026 | 2025 | 2024 | 2023 | 2022 | 2021 | 2020 |
|---|---|---|---|---|---|---|---|---|
| Revenue TTM | $6.81B | $6.70B | · | · | $7.83B | · | · | |
| Net Income TTM | $294M | $61M | · | · | $770M | · | · | |
| Market Cap | $3.73B | $2.56B | · | · | $4.26B | · | · | |
| Enterprise Value | · | $1.95B | · | · | $2.99B | · | · | |
| P/E | 13.0 | -73.1 | · | · | 7.0 | · | · | |
| P/S | 0.5 | 0.4 | · | · | 0.5 | · | · | |
| P/B | 1.9 | 1.4 | · | · | 2.7 | · | · | |
| P / Tangible Book | 3.0 | 2.4 | · | · | 5.6 | · | · | |
| P / Cash Flow | 5.5 | 4.3 | · | · | 3.4 | · | · | |
| P / FCF | 7.1 | 5.8 | · | · | 3.8 | · | · | |
| EV / EBITDA | · | 7.6 | · | · | 2.8 | · | · | |
| EV / FCF | · | 4.5 | · | · | 2.7 | · | · | |
| EV / Revenue | · | 0.3 | · | · | 0.4 | · | · | |
| Dividend Yield | 1.4% | 1.9% | · | · | 0.45% | · | · | |
| Earnings Yield | 7.7% | -1.4% | · | · | 14.3% | · | · | |
| Payout Ratio | 17.6% | 79.4% | · | · | 2.5% | · | · | |
| Annual Payout | $52M | $49M | · | · | $19M | · | · |
Gewinn- und Verlustrechnung
| Kennzahl | Trend | Q3 2027 | Q2 2027 | Q4 2026 | Q3 2026 | Q2 2026 | Q4 2025 | Q3 2025 | Q2 2025 | Q1 2025 | Q4 2024 | Q3 2024 | Q2 2024 | Q1 2024 | Q4 2023 | Q3 2023 |
|---|---|---|---|---|---|---|---|---|---|---|---|---|---|---|---|---|
| Revenue | $1.53B | $1.55B | $2.35B | $1.54B | $1.54B | $2.19B | $1.35B | $1.49B | $1.51B | $2.50B | $1.39B | $1.61B | $1.67B | $2.67B | $1.58B | |
| Cost of Revenue | $926M | $997M | $1.36B | $943M | $943M | $1.28B | $864M | $925M | $938M | $1.42B | $891M | $1.00B | $1.04B | $1.56B | $1.03B | |
| Gross Profit | $602M | $556M | $985M | $592M | $599M | $914M | $485M | $566M | $572M | $1.08B | $501M | $611M | $632M | $1.11B | $553M | |
| SG&A Expense | $494M | $510M | $657M | $505M | $526M | $593M | $470M | $498M | $515M | $672M | $484M | $511M | $530M | $702M | $502M | |
| Operating Income | $88M | $37M | $318M | $3M | $48M | $112M | $9M | $-101M | $50M | $416M | $13M | $90M | $102M | $370M | $48M | |
| Interest Expense | · | · | · | · | · | · | · | · | · | · | · | · | · | · | $4M | |
| Other Non-op | $2M | $300.0K | $500.0K | $2M | $-3M | $2M | $200.0K | $2M | $200.0K | $2M | $-2M | $300.0K | $-400.0K | $300.0K | $-3M | |
| Pretax Income | $73M | $41M | $322M | $5M | $46M | $104M | $8M | $-97M | $59M | $427M | $14M | $92M | $107M | $367M | $42M | |
| Income Tax | $21M | $9M | $72M | $14M | $12M | $48M | $1M | $2M | $6M | $-199M | $2M | $17M | $10M | $90M | $5M | |
| Net Income | $52M | $32M | $250M | $-9M | $34M | $56M | $7M | $-98M | $52M | $626M | $12M | $75M | $97M | $277M | $38M | |
| EPS (Basic) | $1.34 | $0.79 | $6.06 | $-0.22 | $0.79 | $3.27 | $0.12 | $-2.28 | $-0.90 | $13.78 | $0.07 | $1.47 | $1.96 | $5.66 | $0.62 | |
| EPS (Diluted) | $1.33 | $0.78 | $6.02 | $-0.22 | $0.78 | $3.27 | $0.12 | $-2.28 | $-0.90 | $11.77 | $0.07 | $1.38 | $1.79 | $5.35 | $0.60 | |
| Shares (Basic) | 39,000,000 | 40,000,000 | · | 41,100,000 | 42,500,000 | · | 43,900,000 | 44,500,000 | 44,600,000 | · | 44,700,000 | 45,200,000 | 45,300,000 | · | 46,100,000 | |
| Shares (Diluted) | 39,300,000 | 40,400,000 | · | 41,100,000 | 42,700,000 | · | 44,700,000 | 44,500,000 | 44,600,000 | · | 45,600,000 | 54,300,000 | 54,500,000 | · | 48,100,000 | |
| EBITDA | $123M | $72M | · | $40M | $85M | · | $9M | $-101M | $86M | · | $13M | $90M | $145M | · | $48M |
Bilanz
| Kennzahl | Trend | Q3 2027 | Q2 2027 | Q4 2026 | Q3 2026 | Q2 2026 | Q4 2025 | Q3 2025 | Q2 2025 | Q1 2025 | Q4 2024 | Q3 2024 | Q2 2024 | Q1 2024 | Q4 2023 | Q3 2023 |
|---|---|---|---|---|---|---|---|---|---|---|---|---|---|---|---|---|
| Cash & Equivalents | $527M | $603M | $875M | $281M | $264M | $604M | $158M | $403M | $729M | · | $644M | $690M | $656M | · | $327M | |
| Receivables | · | · | · | · | · | · | · | · | · | · | · | · | · | · | $30M | |
| Inventory | $1.96B | $1.99B | $1.94B | $1.99B | $2.01B | $1.94B | $2.14B | $1.98B | $1.98B | · | $2.10B | $2.09B | $2.18B | · | $2.43B | |
| Other Current Assets | $160M | $183M | $190M | $167M | $180M | $157M | $174M | $186M | $202M | · | $259M | $177M | $178M | · | $180M | |
| Current Assets | $2.72B | $2.82B | $3.02B | $2.46B | $2.47B | $2.71B | $2.54B | $2.58B | $2.92B | · | $3.02B | $2.99B | $3.08B | · | $3.19B | |
| PP&E (Net) | $491M | $488M | $499M | $478M | $492M | $506M | $501M | $470M | $475M | · | $510M | $554M | $568M | · | $592M | |
| PP&E (Gross) | · | · | $2.06B | · | · | $1.97B | · | · | · | · | · | · | · | · | · | |
| Accum. Depreciation | $1.59B | $1.58B | $1.56B | $1.52B | $1.50B | $1.46B | $1.53B | $1.51B | $1.47B | · | $1.40B | $1.42B | $1.37B | · | $1.31B | |
| Goodwill | $434M | $428M | $428M | $428M | $482M | $482M | $632M | $632M | $754M | · | $754M | $754M | $751M | · | $752M | |
| Intangibles | $267M | $286M | $286M | $292M | $308M | $307M | $359M | $359M | $402M | · | $406M | $406M | $407M | · | $414M | |
| Other Non-current Assets | $256M | $284M | $291M | $286M | $301M | $315M | $320M | $320M | $315M | · | $316M | $288M | $286M | · | $276M | |
| Total Assets | $5.59B | $5.73B | $5.95B | $5.34B | $5.45B | $5.73B | $5.69B | $5.61B | $6.15B | · | $6.06B | $6.09B | $6.21B | · | $6.35B | |
| Accounts Payable | $605M | $693M | $772M | $513M | $572M | $767M | $642M | $548M | $599M | · | $645M | $571M | $702M | · | $800M | |
| Accrued Liabilities | · | · | $161M | · | · | $181M | · | · | · | · | · | · | · | · | · | |
| Short-term Debt | · | · | · | · | · | · | · | · | · | · | · | · | · | · | $0 | |
| Current Liabilities | $1.66B | $1.74B | $1.89B | $1.60B | $1.65B | $1.83B | $1.63B | $1.53B | $1.75B | · | $1.87B | $1.85B | $1.78B | · | $2.05B | |
| Capital Leases | $941M | $932M | $930M | $887M | $894M | $900M | $852M | $794M | $818M | · | $855M | $832M | $902M | · | $917M | |
| Deferred Tax | $165M | $167M | $175M | $164M | $171M | $173M | $195M | $188M | $202M | · | $160M | $167M | $173M | · | $246M | |
| Other Non-current Liabilities | $82M | $81M | $83M | $77M | $78M | $85M | $88M | $90M | $94M | · | $95M | $98M | $97M | · | $99M | |
| Total Liabilities | $3.75B | $3.83B | $3.99B | $3.61B | $3.68B | $3.87B | $3.89B | $3.47B | $3.74B | · | $3.84B | $3.82B | $3.97B | · | $4.33B | |
| Long-term Debt | · | · | · | · | $0 | · | $253M | $0 | $148M | · | $148M | $148M | · | · | · | |
| Total Debt | · | · | · | · | · | · | $253M | $0 | $148M | · | $148M | $148M | $148M | · | $147M | |
| Common Stock | $13M | $13M | $13M | $13M | $13M | $13M | $13M | $13M | $13M | · | $13M | $13M | $13M | · | $13M | |
| Paid-in Capital | $119M | $111M | $120M | $110M | $105M | $120M | $119M | $165M | $182M | · | $227M | $220M | $210M | · | $252M | |
| Retained Earnings | $4.04B | $4.00B | $3.99B | $3.74B | $3.77B | $3.75B | $3.66B | $3.66B | $3.78B | · | $3.23B | $3.24B | $3.18B | · | $2.89B | |
| Treasury Stock | $2.09B | $2.01B | $1.93B | $1.88B | $1.85B | $1.75B | $1.73B | $1.66B | $1.62B | · | $1.63B | $1.60B | $1.56B | · | $1.51B | |
| AOCI | $-246M | $-224M | $-219M | $-255M | $-256M | $-278M | $-265M | $-266M | $-270M | · | $-269M | $-260M | $-268M | · | $-282M | |
| Stockholders' Equity | $1.84B | $1.90B | $1.97B | $1.73B | $1.78B | $1.85B | $1.80B | $1.92B | $2.08B | $2.17B | $1.57B | $1.61B | $1.58B | $1.58B | $1.36B | |
| Liabilities + Equity | $5.59B | $5.73B | $5.95B | $5.34B | $5.45B | $5.73B | $5.69B | $5.61B | $6.15B | · | $6.06B | $6.09B | $6.21B | · | $6.35B | |
| Shares Outstanding | 38,700,000 | 39,700,000 | 40,400,000 | 41,000,000 | 41,400,000 | 43,200,000 | 43,500,000 | 44,300,000 | 44,700,000 | · | 44,400,000 | 44,800,000 | 45,400,000 | · | 45,900,000 |
Cashflow
| Kennzahl | Trend | Q3 2027 | Q2 2027 | Q4 2026 | Q3 2026 | Q2 2026 | Q4 2025 | Q3 2025 | Q2 2025 | Q1 2025 | Q4 2024 | Q3 2024 | Q2 2024 | Q1 2024 | Q4 2023 | Q3 2023 |
|---|---|---|---|---|---|---|---|---|---|---|---|---|---|---|---|---|
| D&A | $35M | $35M | $37M | $37M | $37M | $37M | $36M | $38M | $37M | $32M | $43M | $44M | $43M | $41M | $44M | |
| Stock-based Comp | · | $8M | $6M | · | $7M | $2M | $2M | · | $8M | $5M | $11M | $14M | $11M | $8M | $11M | |
| Deferred Tax | · | $-2M | $22M | · | $4M | $-24M | $7M | · | $500.0K | $-220M | $-8M | $-4M | $52M | $-162M | $74M | |
| Restructuring | $2M | $8M | $400.0K | $3M | $19M | $1M | $5M | $1M | $5M | $2M | $2M | $4M | $0 | $0 | $0 | |
| Other Non-cash | · | $-217M | · | · | $-256M | · | · | · | $-255M | · | · | · | $-585M | · | · | |
| Operating Cash Flow | · | $-145M | $737M | · | $-175M | $781M | $-75M | · | $-158M | $752M | $48M | $128M | $-382M | $953M | $-41M | |
| CapEx | · | $24M | $60M | · | $37M | $39M | $63M | · | $23M | $36M | $34M | $28M | $27M | $45M | $36M | |
| Investing Cash Flow | · | $-24M | $-62M | · | $-37M | $-38M | $-64M | · | $-22M | $18M | $-33M | $-34M | $-27M | $-37M | $-433M | |
| Stock Repurchased | · | $83M | $27M | · | $117M | $24M | $67M | · | $7M | $22M | $35M | $43M | $39M | $65M | $20M | |
| Net Stock Activity | · | $-83M | · | · | $-117M | · | · | · | $-7M | · | · | · | $-39M | · | · | |
| Dividends Paid | · | $13M | $13M | · | $13M | $13M | $13M | · | $10M | $10M | $10M | $10M | $9M | $9M | $9M | |
| Financing Cash Flow | · | $-103M | $-41M | · | $-137M | $-291M | $-107M | · | $-468M | $-40M | $-56M | $-63M | $-101M | $-82M | $-40M | |
| Free Cash Flow | · | $-169M | · | · | $-212M | · | · | · | $-182M | · | · | · | $-409M | · | · |
Rentabilität
| Kennzahl | Trend | Q3 2027 | Q2 2027 | Q4 2026 | Q3 2026 | Q2 2026 | Q4 2025 | Q3 2025 | Q2 2025 | Q1 2025 | Q4 2024 | Q3 2024 | Q2 2024 | Q1 2024 | Q4 2023 | Q3 2023 |
|---|---|---|---|---|---|---|---|---|---|---|---|---|---|---|---|---|
| Gross Margin | 39.4% | 35.8% | · | 38.6% | 38.8% | · | 36.0% | 38.0% | 37.9% | · | 36.0% | 37.9% | 37.9% | · | 34.9% | |
| Operating Margin | 5.7% | 2.4% | · | 0.18% | 3.1% | · | 0.68% | -6.8% | 3.3% | · | 0.96% | 5.6% | 6.1% | · | 3.1% | |
| Net Margin | 3.4% | 2.0% | · | -0.59% | 2.2% | · | 0.52% | -6.6% | 3.5% | · | 0.84% | 4.7% | 5.8% | · | 2.4% | |
| Pretax Margin | 4.8% | 2.6% | · | 0.33% | 3.0% | · | 0.62% | -6.5% | 3.9% | · | 0.98% | 5.7% | 6.4% | · | 2.7% | |
| EBITDA Margin | 8.0% | 4.6% | · | 2.6% | 5.5% | · | 0.68% | -6.8% | 5.7% | · | 0.96% | 5.6% | 8.7% | · | 3.1% | |
| ROA | · | · | · | · | · | · | 0.12% | -1.7% | 0.84% | · | 0.19% | 1.2% | 1.6% | · | 0.59% | |
| ROE | · | · | · | · | · | · | 0.42% | -5.6% | 2.8% | · | 0.80% | 5.0% | 6.9% | · | 2.6% | |
| ROIC | · | · | · | · | · | · | 0.37% | -5.3% | 2.0% | · | 0.67% | 4.2% | 5.4% | · | 2.9% |
Liquidität & Solvenz
| Kennzahl | Trend | Q3 2027 | Q2 2027 | Q4 2026 | Q3 2026 | Q2 2026 | Q4 2025 | Q3 2025 | Q2 2025 | Q1 2025 | Q4 2024 | Q3 2024 | Q2 2024 | Q1 2024 | Q4 2023 | Q3 2023 |
|---|---|---|---|---|---|---|---|---|---|---|---|---|---|---|---|---|
| Current Ratio | · | · | · | · | · | · | 1.6 | 1.7 | 1.7 | · | 1.6 | 1.6 | 1.7 | · | 1.6 | |
| Quick Ratio | · | · | · | · | · | · | 0.1 | 0.3 | 0.4 | · | 0.3 | 0.4 | 0.4 | · | 0.2 | |
| Debt / Equity | · | · | · | · | · | · | 0.1 | 0.0 | 0.1 | · | 0.1 | 0.1 | 0.1 | · | 0.1 | |
| LT Debt / Equity | · | · | · | · | · | · | 0.1 | 0.0 | 0.0 | · | 0.0 | 0.0 | 0.1 | · | 0.1 | |
| Interest Coverage | · | · | · | · | · | · | · | · | · | · | · | · | · | · | 13.4 |
Effizienz
| Kennzahl | Trend | Q3 2027 | Q2 2027 | Q4 2026 | Q3 2026 | Q2 2026 | Q4 2025 | Q3 2025 | Q2 2025 | Q1 2025 | Q4 2024 | Q3 2024 | Q2 2024 | Q1 2024 | Q4 2023 | Q3 2023 |
|---|---|---|---|---|---|---|---|---|---|---|---|---|---|---|---|---|
| Asset Turnover | · | · | · | · | · | · | 0.2 | 0.3 | 0.2 | · | 0.2 | 0.3 | 0.3 | · | 0.2 | |
| Inventory Turnover | · | · | · | · | · | · | 0.4 | 0.5 | 0.5 | · | 0.4 | 0.5 | 0.5 | · | 0.5 | |
| Receivables Turnover | · | · | · | · | · | · | · | · | · | · | · | · | · | · | 67.6 |
Pro Aktie
| Kennzahl | Trend | Q3 2027 | Q2 2027 | Q4 2026 | Q3 2026 | Q2 2026 | Q4 2025 | Q3 2025 | Q2 2025 | Q1 2025 | Q4 2024 | Q3 2024 | Q2 2024 | Q1 2024 | Q4 2023 | Q3 2023 |
|---|---|---|---|---|---|---|---|---|---|---|---|---|---|---|---|---|
| Book Value / Share | · | · | · | · | · | · | $41.36 | $43.28 | $46.57 | · | $35.41 | $36.03 | $34.83 | · | $29.59 | |
| Revenue / Share | $38.88 | $38.46 | · | $37.35 | $36.10 | · | $30.19 | $33.51 | $33.87 | · | $30.52 | $29.72 | $30.61 | · | $32.90 | |
| Cash Flow / Share | · | $-3.58 | · | · | $-4.11 | · | · | · | $-3.55 | · | · | · | $-7.01 | · | · | |
| Cash / Share | · | · | · | · | · | · | $3.63 | $9.10 | $16.32 | · | $14.50 | $15.41 | $14.45 | · | $7.13 | |
| Dividend / Share | $0.35 | $0.35 | · | $0.32 | $0.32 | · | $0.32 | $0.29 | $0.29 | · | $0.23 | $0.23 | $0.23 | · | $0.20 | |
| Dividend Paid / Share | · | · | $0.32 | $0.32 | $0.32 | $0.29 | $0.29 | $0.29 | $0.29 | · | $0.23 | $0.23 | $0.23 | $0.20 | $0.20 | |
| EPS (TTM) | $8.62 | $7.07 | · | $3.95 | · | $-0.81 | · | · | · | · | $8.59 | $9.12 | $10.32 | · | $6.24 |
Bewertung (TTM)
| Kennzahl | Trend | Q3 2027 | Q2 2027 | Q4 2026 | Q3 2026 | Q2 2026 | Q4 2025 | Q3 2025 | Q2 2025 | Q1 2025 | Q4 2024 | Q3 2024 | Q2 2024 | Q1 2024 | Q4 2023 | Q3 2023 |
|---|---|---|---|---|---|---|---|---|---|---|---|---|---|---|---|---|
| Revenue TTM | $6.82B | $6.83B | · | $6.62B | · | $6.70B | · | · | · | · | $7.34B | $7.53B | $7.67B | · | $7.99B | |
| Net Income TTM | $354M | $293M | · | $87M | · | $61M | · | · | · | · | $462M | $487M | $558M | · | $414M | |
| Market Cap | · | · | · | · | · | · | $4.00B | $3.46B | $4.22B | · | $3.01B | $3.58B | $3.34B | · | $3.09B | |
| Enterprise Value | · | · | · | · | · | · | $4.10B | $3.06B | $3.64B | · | $2.51B | $3.03B | $2.83B | · | $2.91B | |
| P/E | 10.8 | 12.1 | · | 19.1 | · | -73.1 | · | · | · | · | 7.9 | 8.8 | 7.1 | · | 10.8 | |
| P/S | · | · | · | · | · | · | · | · | · | · | 0.4 | 0.5 | 0.4 | · | 0.4 | |
| P/B | · | · | · | · | · | · | 2.2 | 1.8 | 2.0 | · | 1.9 | 2.2 | 2.1 | · | 2.3 | |
| P / Tangible Book | · | · | · | · | · | · | 5.0 | 3.7 | 4.6 | · | 7.3 | 7.9 | 7.9 | · | 16.1 | |
| P / Cash Flow | · | · | · | · | · | · | · | · | -26.7 | · | · | · | -8.7 | · | · | |
| EV / Revenue | · | · | · | · | · | · | · | · | · | · | 0.3 | 0.4 | 0.4 | · | 0.4 | |
| Dividend Yield | · | · | · | · | · | · | 1.1% | · | · | · | 1.3% | 1.1% | 1.1% | · | 1.2% | |
| Earnings Yield | 9.3% | 8.2% | · | 5.2% | · | -1.4% | · | · | · | · | 12.7% | 11.4% | 14.0% | · | 9.3% | |
| Payout Ratio | · | 41.0% | · | · | 37.6% | · | · | · | 19.6% | · | · | · | 9.2% | · | · | |
| Annual Payout | · | · | · | · | · | $49M | $44M | · | · | · | $39M | $38M | $37M | · | $37M |
Aktuellster Zeitraum links · fehlende Werte werden als · angezeigt
Finanzberichte Gewinn- und Verlustrechnung, Bilanz, Cashflow — jährlich, letzte 5 Jahre
| Kennzahl | 2026-01-31 | 2025-08-02 | 2025-05-03 | 2025-02-01 | 2024-11-02 |
|---|---|---|---|---|---|
| Umsatz | $6.81B | · | · | $6.70B | · |
| Bruttogewinnmarge % | 39.6% | · | · | 39.2% | · |
| Betriebsgewinnmarge % | 5.8% | · | · | 1.7% | · |
| Nettoergebnis | $294M | · | · | $61M | · |
| Verwässerte EPS | $7.08 | · | · | $-0.81 | · |
| Kennzahl | 2026-01-31 | 2025-08-02 | 2025-05-03 | 2025-02-01 | 2024-11-02 |
|---|---|---|---|---|---|
| Fremdkapital / Eigenkapital | · | · | · | 0.0 | · |
| Liquiditätsgrad | 1.6 | · | · | 1.5 | · |
| Quick Ratio | 0.5 | · | · | 0.3 | · |
| Kennzahl | 2026-01-31 | 2025-08-02 | 2025-05-03 | 2025-02-01 | 2024-11-02 |
|---|---|---|---|---|---|
| Freier Cashflow | $525M | · | · | $438M | · |
Institutionelle Eigentümer (13F) 374 Einreicher · $4.0B gesamt · Stand 30. September 2026
Institutionen, die diese Aktie in ihrer vierteljährlichen SEC-Formular 13F melden. Nur Long-Positionen; ein einzelner Einreicher kann für separate Optionsscheine zweimal erscheinen. Große gegenläufige Put/Call-Positionen spiegeln typischerweise Market-Making oder abgesicherte Bestände wider, nicht die gerichtete Überzeugung.
| Neue Positionen | Geschlossene Positionen | Erhöht | Abgenommen | Nettoveränderung der Aktien |
|---|---|---|---|---|
| 50 (-27 vs. Vorquartal) | 61 (+18 vs. Vorquartal) | 125 (+4 vs. Vorquartal) | 119 (+3 vs. Vorquartal) | -1.9M |
Verglichen mit Q1 2026. SEC-Formular 13F-Einreichungen sind innerhalb von 45 Tagen nach Quartalsende fällig, zuzüglich einer kurzen Pufferzeit für verspätete Einreicher — Quartale, die noch in diesem Fenster liegen, werden zugunsten des letzten vollständig berichteten Paares übersprungen.
| Institution | Wert | Aktien | % der verfolgten 13F | Typ |
|---|---|---|---|---|
| BlackRock, Inc. | $569.589.536 | 6.607.767 | 14,12% | Aktien |
| VANGUARD GROUP INC | $397.794.080 | 4.799.639 | 9,86% | Aktien |
| VANGUARD PORTFOLIO MANAGEMENT LLC | $305.678.561 | 3.546.155 | 7,58% | Aktien |
| DIMENSIONAL FUND ADVISORS LP | $222.782.903 | 2.584.443 | 5,52% | Aktien |
| Select Equity Group, L.P. | $210.058.453 | 2.436.873 | 5,21% | Aktien |
| FMR LLC | $186.918.931 | 2.168.433 | 4,63% | Aktien |
| AMERICAN CENTURY COMPANIES INC | $156.799.632 | 1.819.021 | 3,89% | Aktien |
| VANGUARD CAPITAL MANAGEMENT LLC | $154.594.097 | 1.793.435 | 3,83% | Aktien |
| STATE STREET CORP | $148.833.179 | 1.726.603 | 3,69% | Aktien |
| GEODE CAPITAL MANAGEMENT, LLC | $91.374.870 | 1.059.837 | 2,27% | Aktien |
| Hood River Capital Management LLC | $75.707.219 | 878.274 | 1,88% | Aktien |
| MORGAN STANLEY | $73.650.897 | 854.417 | 1,83% | Aktien |
| Nuveen, LLC | $64.864.121 | 752.484 | 1,61% | Aktien |
| GOLDMAN SACHS GROUP INC | $60.414.572 | 700.865 | 1,50% | Aktien |
| VICTORY CAPITAL MANAGEMENT INC | $55.774.073 | 647.031 | 1,38% | Aktien |
| FRANKLIN RESOURCES INC | $50.954.973 | 591.125 | 1,26% | Aktien |
| ARROWSTREET CAPITAL, LIMITED PARTNERSHIP | $48.799.544 | 566.120 | 1,21% | Aktien |
| Invesco Ltd. | $48.767.306 | 565.746 | 1,21% | Aktien |
| CITADEL ADVISORS LLC | $46.704.798 | 541.819 | 1,16% | Aktien |
| BROWN ADVISORY INC | $44.711.255 | 518.692 | 1,11% | Aktien |
| NORTHERN TRUST CORP | $44.492.647 | 516.156 | 1,10% | Aktien |
| CHARLES SCHWAB INVESTMENT MANAGEMENT INC | $43.989.756 | 510.322 | 1,09% | Aktien |
| Junto Capital Management LP | $35.946.779 | 417.016 | 0,89% | Aktien |
| JPMORGAN CHASE & CO | $31.456.293 | 360.235 | 0,78% | Aktien |
| SUSQUEHANNA INTERNATIONAL GROUP, LLP | $31.187.160 | 361.800 | 0,77% | Kaufoption |
| Ruffer LLP | $31.022.035 | 360.278 | 0,77% | Aktien |
| BANK OF AMERICA CORP /DE/ | $29.785.160 | 345.535 | 0,74% | Aktien |
| Summit Street Capital Management, LLC | $29.076.639 | 337.316 | 0,72% | Aktien |
| Bank of New York Mellon Corp | $24.832.819 | 288.084 | 0,62% | Aktien |
| BRIDGEWAY CAPITAL MANAGEMENT, LLC | $24.800.947 | 287.714 | 0,61% | Aktien |
| GRACE & WHITE INC /NY | $24.661.018 | 240.995 | 0,61% | Aktien |
| UBS Group AG | $24.262.628 | 281.469 | 0,60% | Aktien |
| PRINCIPAL FINANCIAL GROUP INC | $23.208.229 | 269.237 | 0,58% | Aktien |
| VANGUARD FIDUCIARY TRUST CO | $22.818.261 | 264.713 | 0,57% | Aktien |
| Schonfeld Strategic Advisors LLC | $20.522.323 | 238.078 | 0,51% | Aktien |
| Connor, Clark & Lunn Investment Management Ltd. | $18.244.747 | 211.656 | 0,45% | Aktien |
| Allianz Asset Management GmbH | $18.128.894 | 210.312 | 0,45% | Aktien |
| ROYCE & ASSOCIATES LP | $17.673.155 | 205.025 | 0,44% | Aktien |
| Copeland Capital Management, LLC | $17.632.584 | 172.311 | 0,44% | Aktien |
| Empowered Funds, LLC | $14.656.414 | 170.028 | 0,36% | Aktien |
| Public Sector Pension Investment Board | $14.139.472 | 164.031 | 0,35% | Aktien |
| JANE STREET GROUP, LLC | $13.731.660 | 159.300 | 0,34% | Kaufoption |
| JANE STREET GROUP, LLC | $13.448.062 | 156.010 | 0,33% | Aktien |
| NORDEA INVESTMENT MANAGEMENT AB | $13.116.733 | 156.133 | 0,33% | Aktien |
| SUSQUEHANNA INTERNATIONAL GROUP, LLP | $12.861.040 | 149.200 | 0,32% | Verkaufsoption |
| SEI INVESTMENTS CO | $11.382.812 | 132.051 | 0,28% | Aktien |
| NOMURA HOLDINGS INC | $10.523.727 | 122.085 | 0,26% | Aktien |
| AQR CAPITAL MANAGEMENT LLC | $10.300.025 | 119.490 | 0,26% | Aktien |
| ALGERT GLOBAL LLC | $9.950.583 | 115.436 | 0,25% | Aktien |
| MILLENNIUM MANAGEMENT LLC | $9.001.952 | 104.431 | 0,22% | Aktien |
Aktivisten & 5%+-Eigentümer 4 Beteiligungen
Investoren mit SEC Schedule 13D — wirtschaftliches Eigentum über 5% mit der Absicht, Einfluss auf den Emittenten zu nehmen (aktivistische Beteiligungen, Board-Kampagnen, M&A). Jede Zeile zeigt den zuletzt bekannten Stand der Position dieses Melders.
| Anmelder | Eingereicht | Beteiligung | Status | Zweck | Einreichung |
|---|---|---|---|---|---|
| Select Equity Group, L.P., George S. Loening ×2 Einreichungen | 6. Januar 2026 | 8,70% | Änderung | · | SEC |
| Green Equity Investors VI, L.P. (2), Green Equity Investors Side VI, L.P. (2), LGP Associates VI-A LLC (2), LGP Associates VI-B LLC (2), GEI Capital VI, LLC (2), Green VI Holdings, LLC (2), Leonard Green & Partners, L.P. (2), LGP Management, Inc. (2), Peridot Coinvest Manager LLC (2), Jonathan A. Seiffer (2) ×6 Einreichungen | 22. Mai 2024 | · | Erste Einreichung | · | SEC |
| Abrams Bison Partners, L.P., Abrams Bison Investments, L.L.C., Gavin Abrams ×2 Einreichungen | 1. Juni 2017 | · | Erste Einreichung | Passive Anlage | SEC |
| CORVEX MANAGEMENT LP, KEITH MEISTER ×6 Einreichungen | 6. Dezember 2016 | · | Erste Einreichung | · | SEC |
Purpose is an automated classification of the filer's own stated purpose (SEC Item 4) — not investment advice. "—" means no clear purpose was stated or the text could not be classified.
Unternehmensinsider 64 Insider · 40 Führungskräfte · 27 Direktoren
| Insider | Rolle | Letzte Aktivität | Gehaltene Aktien | Käufe 12m | Verkäufe 12m | Netto 12m |
|---|---|---|---|---|---|---|
| James Kevin Symancyk | Chief Executive Officer | 21. August 2026 A | 149.543 | 0 | 0 | $0 |
| Virginia Drosos | Chief Executive Officer | 16. Oktober 2024 S | 678.820 | 0 | 0 | $0 |
| Mark Light | CEO | 31. Juli 2017 F | 79.445 | 0 | 0 | $0 |
| Michael W Barnes | Chief Executive Officer | 8. Mai 2014 A | 199.092 | 0 | 0 | $0 |
| Michele Santana | CFO | 27. April 2018 F | 29.398 | 0 | 0 | $0 |
| Ronald W Ristau | Chief Financial Officer | 8. Mai 2014 A | 43.420 | 0 | 0 | $0 |
| Kenneth Pratt | UK Chief Financial Officer | 5. April 2013 S | 4.309 | 0 | 0 | $0 |
| Jamie Cygielman | President, Zales and Banter | 31. August 2026 A | 6.436 | 0 | 0 | $0 |
| Kecia Caffie | President Zales and Banter by Piercing Pagoda | 20. Februar 2026 A | 15.402 | 0 | 0 | $0 |
| Jamie Singleton | Group President and Chief Consumer Officer | 1. April 2025 F | 135.569 | 0 | 0 | $0 |
| William Brace | President - KAY Jewelers | 27. März 2024 S | 75.664 | 0 | 0 | $0 |
| Oded Edelman | Chief Digital Innovation Officer and President, Digital Banners | 26. März 2024 S | 16.971 | 0 | 0 | $0 |
| Sebastian Hobbs | President & Chief Cust. Off. | 25. April 2018 F | 11.748 | 0 | 0 | $0 |
| William Montalto | US Chief Operating Officer | 16. Juni 2012 F | 29.500 | 0 | 0 | $0 |
| Stash Ptak | Chief Legal, Compliance and Risk Officer | 16. Oktober 2026 S | 20.428 | 0 | 2 | $-240.000 |
| Julie Yoakum | Führungskraft | 31. August 2026 F | 9.599 | 0 | 0 | $0 |
| Claudia Cividino | Führungskraft | 21. August 2026 A | 17.114 | 0 | 0 | $0 |
| Karen Leslie Cho | Chief People Officer | 21. August 2026 A | 8.487 | 0 | 0 | $0 |
| Raghunandan R Sagi | Führungskraft | 21. August 2026 A | 11.082 | 0 | 0 | $0 |
| Vincent Ciccolini | Chief Accounting Officer | 21. August 2026 A | 45.257 | 0 | 0 | $0 |
| Joan M Hilson | Führungskraft | 21. August 2026 A | 258.950 | 0 | 0 | $0 |
| Rebecca Wooters | Chief Digital Officer | 26. März 2025 F | 70.263 | 0 | 0 | $0 |
| Mary Elizabeth Finn | Chief People Officer | 16. Oktober 2024 S | 38.821 | 0 | 0 | $0 |
| Stephen E. Lovejoy | Chief Supply Chain Officer | 26. März 2024 A | 53.778 | 0 | 0 | $0 |
| Howard A Melnick | Chief Information Officer | 26. März 2024 A | 64.404 | 0 | 0 | $0 |
| Judith Lynn Dennison | Chief Legal & Strategy Officer | 14. August 2020 F | 120.641 | 0 | 0 | $0 |
| Carol A Schumacher | Chief Communications Officer | 25. April 2019 F | 7.040 | 0 | 0 | $0 |
| Steven J. Becker | Chief Human Resources Officer | 27. April 2018 F | 6.897 | 0 | 0 | $0 |
| George Murray | Chief Retail Insights & Strat. | 27. April 2018 F | 15.651 | 0 | 0 | $0 |
| Mark Andrew Jenkins | Chief Gov Off./Corp Secretary | 27. April 2018 F | 2.025 | 0 | 0 | $0 |
| Bryan D Morgan | Chief Operations Officer | 8. Mai 2017 F | 7.661 | 0 | 0 | $0 |
| Uta Werner | Chief Strategy Officer | 21. Juni 2016 P | 1.750 | 0 | 0 | $0 |
| Philip Joseph Brenner | Chief Information Officer | 13. Juni 2016 P | 2.541 | 0 | 0 | $0 |
| Robert Trabucco | Signet EVP, Finance | 26. April 2016 F | 9.597 | 0 | 0 | $0 |
| Daniel Shull | CIO | 27. April 2015 A | 1.164 | 0 | 0 | $0 |
| James Garlish | SVP, Finance Zale Division | 27. April 2015 A | 543 | 0 | 0 | $0 |
| Shaun Carney | UK Finance Director | 27. April 2015 A | 2.534 | 0 | 0 | $0 |
| Michael Povall | UK Chief Admin.Officer | 16. April 2014 S | 3.881 | 0 | 0 | $0 |
| Robert William Anderson | UK CHIEF EXEUTIVE OFFICER | 26. April 2013 A | 17.206 | 0 | 0 | $0 |
| Kevin Ryan | UK Stores Operations Director | 26. April 2013 A | 4.744 | 0 | 0 | $0 |
| Zackery A Hicks | Direktor | 21. August 2026 A | 20.473 | 0 | 0 | $0 |
| Brian A Tilzer | Direktor | 21. August 2026 A | 14.627 | 0 | 1 | $-622.720 |
| Donta L Wilson | Direktor | 21. August 2026 A | 13.586 | 0 | 0 | $0 |
| Eugenia Ulasewicz | Direktor | 21. August 2026 A | 26.823 | 0 | 0 | $0 |
| Mark R. Graf | Direktor | 21. August 2026 A | 33.650 | 0 | 0 | $0 |
| Jeffrey Gennette | Direktor | 21. August 2026 A | 2.341 | 0 | 0 | $0 |
| Helen Mccluskey | Direktor | 21. August 2026 A | 39.397 | 0 | 0 | $0 |
| Sharon Mccollam | Direktor | 21. August 2026 A | 32.746 | 0 | 0 | $0 |
| COCHRAN SANDRA B | Direktor | 21. August 2026 A | 6.178 | 0 | 0 | $0 |
| Andre Branch | Direktor | 26. Juni 2026 A | 10.598 | 0 | 0 | $0 |
| Nancy Reardon-Sayer | Direktor | 22. Mai 2026 A | 30.600 | 0 | 0 | $0 |
| Jonathan A Seiffer | Direktor | 21. Oktober 2024 S | 24.687 | 0 | 0 | $0 |
| Todd H. Stitzer | Direktor | 22. April 2024 S | 41.678 | 0 | 0 | $0 |
| Jonathan D Sokoloff | Direktor | 25. Juni 2020 A | 14.363 | 0 | 0 | $0 |
| Marianne M Parrs | Direktor | 15. Juni 2018 A | 24.299 | 0 | 0 | $0 |
| Thomas G Plaskett | Direktor | 15. Juni 2018 A | 21.179 | 0 | 0 | $0 |
| John Russell Walls | Direktor | 21. März 2018 G | 5.438 | 0 | 0 | $0 |
| Robert Stack | Direktor | 28. Juni 2017 A | 8.264 | 0 | 0 | $0 |
| Dale William Hilpert | Direktor | 17. Juni 2016 A | 16.052 | 0 | 0 | $0 |
| Robert Trimble Blanchard | Direktor | 15. Juni 2012 A | 15.034 | 0 | 0 | $0 |
| George Malcolm Williamson | Direktor | 30. März 2012 P | 744 | 0 | 0 | $0 |
| Terry Lee Burman | Direktor | 14. Januar 2011 M | 1.851 | 0 | 0 | $0 |
| Walker Gordon Boyd | Direktor | 25. Juni 2010 D | 12.277 | 0 | 0 | $0 |
| Edward Hrabak | · | 13. Juni 2016 P | 15.363 | 0 | 0 | $0 |
Insider aus SEC-Einreichungen Form 3/4/5; Netto = nur P/S aus offenen Märkten
ETF-Besitz Gehalten von 75 ETFs
Gewichtung spiegelt nur direkte Aktienbestände (N-PORT) wider; gehebelte oder derivatbasierte Fonds können zusätzliche Swap-Exposure halten, die hier nicht angezeigt wird.
| Fonds | Gewicht | Anteile | Stand | Quelle |
|---|---|---|---|---|
| PSCD · Invesco Exchange-Traded Fund Trust … | 1,97% | 3.957 SH | 23. Oktober 2026 | Täglich |
| XSVM · Invesco Exchange-Traded Fund Trust | 1,18% | 59.381 SH | 23. Oktober 2026 | Täglich |
| XSHQ · Invesco Exchange-Traded Fund Trust … | 1,13% | 28.364 SH | 23. Oktober 2026 | Täglich |
| RETL · Direxion Shares ETF Trust | 1,04% | 3.107 NS | 31. Juli 2026 | N-PORT |
| EWA · iShares, Inc. | 0,68% | 4.511.881 SH | 11. September 2026 | Täglich |
| RWJ · Invesco Exchange-Traded Fund Trust … | 0,49% | 85.405 SH | 23. Oktober 2026 | Täglich |
| EPP · iShares, Inc. | 0,43% | 5.163.917 SH | 11. September 2026 | Täglich |
| VIOV · VANGUARD ADMIRAL FUNDS | 0,37% | 85.021 SH | 19. August 2026 | Täglich |
| DFSV · Dimensional ETF Trust | 0,25% | 217.004 NS | 31. Juli 2026 | N-PORT |
| QVMS · Invesco Exchange-Traded Fund Trust … | 0,24% | 4.922 SH | 23. Oktober 2026 | Täglich |
| VTWV · VANGUARD SCOTTSDALE FUNDS | 0,22% | 34.724 SH | 19. August 2026 | Täglich |
| VIOO · VANGUARD ADMIRAL FUNDS | 0,19% | 140.124 SH | 19. August 2026 | Täglich |
| DFAT · Dimensional ETF Trust | 0,19% | 293.229 NS | 31. Juli 2026 | N-PORT |
| VFMF · VANGUARD WELLINGTON FUND | 0,18% | 15.021 SH | 19. August 2026 | Täglich |
| OMFS · Invesco Exchange-Traded Self-Indexe… | 0,18% | 4.029 SH | 23. Oktober 2026 | Täglich |
| VFVA · VANGUARD WELLINGTON FUND | 0,16% | 15.507 SH | 19. August 2026 | Täglich |
| EFAV · iShares Trust | 0,16% | 4.470.571 SH | 11. September 2026 | Täglich |
| IXJ · iShares Trust | 0,14% | 3.028.070 SH | 11. September 2026 | Täglich |
| IWM · iShares Trust | 0,13% | 1.018.194 SH | 11. September 2026 | Täglich |
| ESGD · iShares Trust | 0,13% | 8.017.567 SH | 11. September 2026 | Täglich |
| VCR · VANGUARD WORLD FUND | 0,12% | 95.952 SH | 19. August 2026 | Täglich |
| RSSL · Global X Funds | 0,12% | 18.999 NS | 31. Juli 2026 | N-PORT |
| IPAC · iShares Trust | 0,10% | 1.492.286 SH | 11. September 2026 | Täglich |
| VTWO · VANGUARD SCOTTSDALE FUNDS | 0,10% | 228.576 SH | 19. August 2026 | Täglich |
| PABD · iShares Trust | 0,10% | 172.786 SH | 11. September 2026 | Täglich |
| EFG · iShares Trust | 0,09% | 7.981.579 SH | 11. September 2026 | Täglich |
| VFQY · VANGUARD WELLINGTON FUND | 0,09% | 5.094 SH | 19. August 2026 | Täglich |
| DMXF · iShares Trust | 0,09% | 443.084 SH | 11. September 2026 | Täglich |
| ESML · iShares Trust | 0,09% | 24.542 SH | 11. September 2026 | Täglich |
| DFAS · Dimensional ETF Trust | 0,08% | 137.201 NS | 31. Juli 2026 | N-PORT |
| VBR · VANGUARD INDEX FUNDS | 0,07% | 577.487 SH | 19. August 2026 | Täglich |
| VPL · VANGUARD INTERNATIONAL EQUITY INDEX… | 0,07% | 5.502.248 SH | 19. August 2026 | Täglich |
| EFA · iShares Trust | 0,04% | 18.512.203 SH | 11. September 2026 | Täglich |
| VXF · VANGUARD INDEX FUNDS | 0,04% | 459.552 SH | 19. August 2026 | Täglich |
| VB · VANGUARD INDEX FUNDS | 0,04% | 909.867 SH | 19. August 2026 | Täglich |
| IEFA · iShares Trust | 0,04% | 39.542.209 SH | 11. September 2026 | Täglich |
| WSML · iShares Trust | 0,04% | 2.528 SH | 11. September 2026 | Täglich |
| IDEV · iShares Trust | 0,03% | 5.958.127 SH | 11. September 2026 | Täglich |
| NUSC · Nushares ETF Trust | 0,03% | 4.498 NS | 31. Juli 2026 | N-PORT |
| DXUV · Dimensional ETF Trust | 0,03% | 1.894 NS | 31. Juli 2026 | N-PORT |
| VEA · VANGUARD TAX-MANAGED FUNDS | 0,03% | 49.825.383 SH | 19. August 2026 | Täglich |
| VSGX · VANGUARD WORLD FUND | 0,03% | 1.014.282 SH | 19. August 2026 | Täglich |
| ACWX · iShares Trust | 0,03% | 1.760.652 SH | 11. September 2026 | Täglich |
| PRF · Invesco Exchange-Traded Fund Trust | 0,02% | 20.149 SH | 23. Oktober 2026 | Täglich |
| IXUS · iShares Trust | 0,02% | 7.220.391 SH | 11. September 2026 | Täglich |
| DFSU · Dimensional ETF Trust | 0,02% | 5.159 NS | 31. Juli 2026 | N-PORT |
| DCOR · Dimensional ETF Trust | 0,02% | 7.490 NS | 31. Juli 2026 | N-PORT |
| DFUV · Dimensional ETF Trust | 0,02% | 34.230 NS | 31. Juli 2026 | N-PORT |
| VXUS · VANGUARD STAR FUNDS | 0,02% | 75.008.554 SH | 19. August 2026 | Täglich |
| VEU · VANGUARD INTERNATIONAL EQUITY INDEX… | 0,02% | 11.912.877 SH | 19. August 2026 | Täglich |
| IMFL · Invesco Exchange-Traded Self-Indexe… | 0,02% | 103.441 SH | 23. Oktober 2026 | Täglich |
| DFAC · Dimensional ETF Trust | 0,02% | 94.896 NS | 31. Juli 2026 | N-PORT |
| URTH · iShares, Inc. | 0,01% | 507.371 SH | 11. September 2026 | Täglich |
| PDN · Invesco Exchange-Traded Fund Trust … | 0,01% | 20.320 SH | 22. Oktober 2026 | Täglich |
| TOK · iShares Trust | 0,01% | 12.718 SH | 11. September 2026 | Täglich |
| CRBN · iShares Trust | 0,01% | 62.076 SH | 11. September 2026 | Täglich |
| VT · VANGUARD INTERNATIONAL EQUITY INDEX… | 0,01% | 4.181.316 SH | 19. August 2026 | Täglich |
| VYM · VANGUARD WHITEHALL FUNDS | 0,01% | 157.200 SH | 19. August 2026 | Täglich |
| ESGV · VANGUARD WORLD FUND | 0,01% | 8.743 SH | 19. August 2026 | Täglich |
| ACWI · iShares Trust | 0,01% | 1.744.206 SH | 11. September 2026 | Täglich |
| DSI · iShares Trust | 0,01% | 5.368 SH | 11. September 2026 | Täglich |
| DFAU · Dimensional ETF Trust | 0,01% | 10.010 NS | 31. Juli 2026 | N-PORT |
| IWV · iShares Trust | 0,01% | 12.078 SH | 11. September 2026 | Täglich |
| ITOT · iShares Trust | 0,01% | 55.696 SH | 11. September 2026 | Täglich |
| DFUS · Dimensional ETF Trust | 0,01% | 12.069 NS | 31. Juli 2026 | N-PORT |
| VTI · VANGUARD INDEX FUNDS | 0,00% | 1.261.577 SH | 19. August 2026 | Täglich |
| VTHR · VANGUARD SCOTTSDALE FUNDS | 0,00% | 3.331 SH | 19. August 2026 | Täglich |
| CBLS · Elevation Series Trust | -1,13% | -6.793 NS | 31. Juli 2026 | N-PORT |
| IJR · iShares Trust | · | 2.445.440 SH | 10. September 2026 | Täglich |
| IJS · iShares Trust | · | 357.589 SH | 8. September 2026 | Täglich |
| IWN · iShares Trust | · | 372.472 SH | 11. September 2026 | Täglich |
| XJR · iShares Trust | · | 5.527 SH | 31. August 2026 | Täglich |
| ISCB · iShares Trust | · | 1.743 SH | 11. September 2026 | Täglich |
| ISCV · iShares Trust | · | 8.724 SH | 11. September 2026 | Täglich |
| SMLF · iShares Trust | · | 97.046 SH | 11. September 2026 | Täglich |
SIG Analysten-Konsens Bullische und bärische Analystenmeinungen, 12-Monats-Kursziel, Aufwärtspotenzial
12-Monats-Kursziel
9 Analysten · 2026-10-26Mittelwert-Ziel $124.33 +8,1%
Neueste Nachrichten Aktuelle Schlagzeilen über dieses Unternehmen
Meine Kennzahlen Ihre persönliche Watchlist — ausgewählte Zeilen aus den vollständigen Fundamentaldaten
Wählen Sie die Kennzahlen, die für Sie wichtig sind — klicken Sie auf das + neben jeder Zeile in den vollständigen Fundamentaldaten oben.
Ihre Auswahl wird gespeichert und begleitet Sie über alle Ticker hinweg.