
UBS UBS Group AG Registered Ordinary Shares
About UBS Group AG Registered Ordinary Shares Company overview from Wikipedia
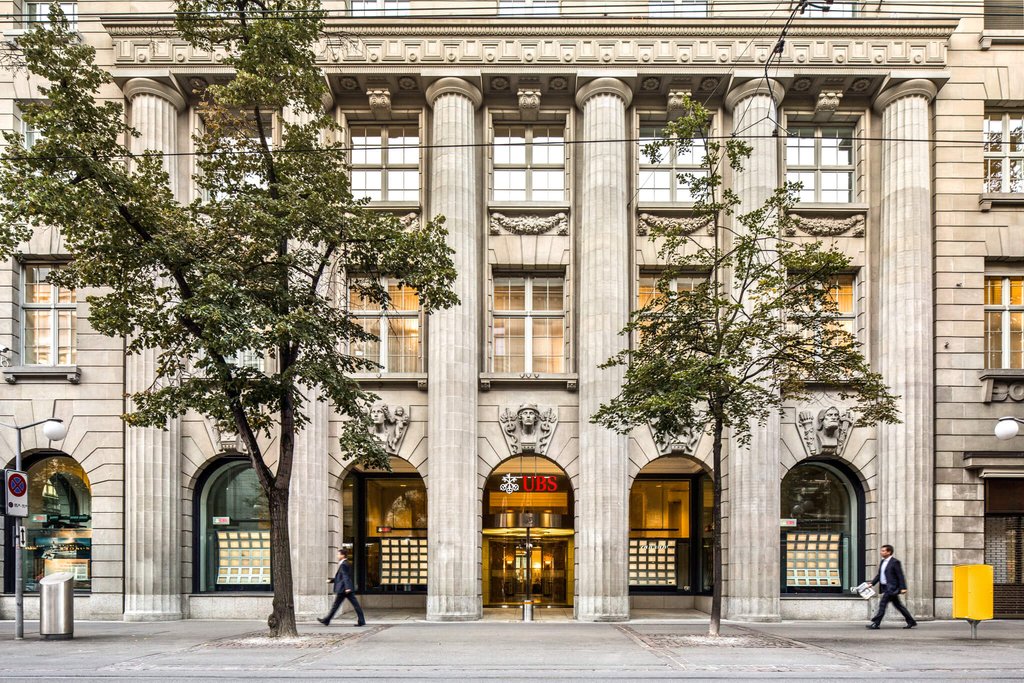
UBS Group AG is a Swiss multinational investment bank and financial services firm founded and based in Switzerland, with headquarters in both Zurich and Basel. It holds a strong foothold in all major financial centres as the largest Swiss banking institution and the world's largest private bank. UBS manages the largest amount of private wealth in the world, counting approximately half of The World's Billionaires among its clients, with over US$7 trillion in assets as of December 2025 (AUM). Based on international deal flow and political influence, the firm is considered one of the "biggest, most powerful financial institutions in the world". UBS is also a leading market maker and one of the eight global 'bulge bracket' investment banks. Due to its large presence across the Americas, EMEA and Asia–Pacific markets, the Financial Stability Board considers it a global systemically important bank and UBS is widely considered to be the largest and most sophisticated "truly global investment bank" in the world, given its market-leading positions in every major financial centre globally.
Read more
UBS Group AG (stylized simply as UBS) is a Swiss multinational investment bank and financial services firm founded and based in Switzerland, with headquarters in both Zurich and Basel. It holds a strong foothold in all major financial centres as the largest Swiss banking institution and the world's largest private bank. UBS manages the largest amount of private wealth in the world, counting approximately half of The World's Billionaires among its clients, with over US$7 trillion in assets as of December 2025 (AUM). Based on international deal flow and political influence, the firm is considered one of the "biggest, most powerful financial institutions in the world". UBS is also a leading market maker and one of the eight global 'bulge bracket' investment banks. Due to its large presence across the Americas, EMEA and Asia–Pacific markets, the Financial Stability Board considers it a global systemically important bank and UBS is widely considered to be the largest and most sophisticated "truly global investment bank" in the world, given its market-leading positions in every major financial centre globally.
UBS investment bankers and private bankers are known for their strict bank–client confidentiality and culture of banking secrecy. Apart from private banking, UBS provides wealth management, asset management and investment banking services for private, corporate and institutional clients with international service. The bank also maintains numerous underground bank vaults, bunkers and storage facilities for gold bars around the Swiss Alps and internationally. UBS acquired rival Credit Suisse in an emergency rescue deal brokered by the Swiss government and its Central bank in 2023, following which UBS' AUM increased to over $5 trillion along with an increased balanced sheet of $1.6 trillion.
In June 2017, its return on invested capital was 11.1%, followed by Goldman Sachs' 9.35%, and JPMorgan Chase's 9.456%. The company's capital strength, security protocols, and reputation for discretion have yielded a substantial market share in banking and a high level of brand loyalty. Alternatively, it receives routine criticism for facilitating tax noncompliance and off-shore financing. Partly due to its banking secrecy, it has also been at the centre of numerous tax avoidance investigations undertaken by U.S., French, German, Israeli and Belgian authorities. UBS operations in Switzerland and the United States were respectively ranked first and second on the 2018 Financial Secrecy Index. UBS is a primary dealer and Forex counterparty of the U.S. Federal Reserve.
Corporate structure
UBS is a joint-stock company (Aktiengesellschaft), pursuant to Swiss laws. Its shares are listed at the SIX Swiss Exchange and the New York Stock Exchange (NYSE). As of December 2020, UBS is present in all major financial centres worldwide, such as New York, London, Zürich, Berlin, Sydney, and Singapore. UBS has offices in 50 countries, with about 30% of its approximately 73,000 employees working in the Americas, 30% in Switzerland, 19% in Europe (excluding Switzerland), the Middle East and Africa and 21% in the Asia Pacific region. The bank has a major presence in the United States. Its American headquarters for investment banking are located in New York City, and for private wealth management advisory in Weehawken, New Jersey. They have sales & trading, along with private wealth management offices in Stamford, Connecticut.
The company's global business groups provide services that entail: global wealth management, investment banking, asset management and personal & corporate banking. UBS is the leading provider of retail banking and commercial banking services in Switzerland, and they have been on top of the Swiss market since in 2009. Looking holistically, UBS' overall invested assets is $3.101 billion, shareholders' equity is $52.928 billion and market capitalization is $45.907 billion at the end of the year 2018. In November 2014, the shares in UBS Group AG were listed and started trading as a new holding company at the New York Stock Exchange (NYSE) and the SIX Swiss Exchange. Upon application and with effect as of 14 January 2015, the shares of UBS AG, a subsidiary of the UBS Group AG, were delisted from the NYSE. As of September 2019, the largest institutional shareholders are:
As of 31 December 2024, the geographical distribution of the shareholders presents itself as follows:
As of June 2018, UBS's corporate structure includes four divisions in total, namely:
Global Wealth Management
Personal & Corporate Bank
Asset Management
Investment Bank
Starting on 9 June 2003, all UBS business groups, including UBS Paine Webber and UBS Warburg, were rebranded under the UBS moniker following company's start of operations as a unified global entity.
Global Wealth Management
UBS's global wealth management advisory division offers high-net-worth individuals around the world a range of advisory and investment products and services. As of the end of 2016, UBS Wealth Management's invested assets totalled CHF 977billion. The whole companies assets under management (AUM) amounted to US$1,737.5 billion in 2015, representing a 1% decrease in AUM compared to the equivalent data of 2014. As of 2018, UBS manages the largest amount of private wealth in the world, counting approximately half of The World's Billionaires among its clients. More than 60% of total invested assets in UBS Wealth Management belong to individuals with a net worth of CHF 10 million or more. Of the remaining 40% of total invested assets, 30% of the total belong to individuals with net worth between CHF 1 million and CHF 10 million and the last 10% of total assets belong to individuals with a net worth of less than CHF 1 million.
UBS offers brokerage services and products as well as asset management and other investment advisory and portfolio management products and services. Additionally, UBS provides a broad range of securities and savings products that are supported by the firm's underwriting and research activities as well as clients' orders management and execution and also clearing services for transactions originated by individual investors. The business is further divided geographically with separate businesses focused on the U.S. and other international markets. Two-thirds of the total invested assets come from Europe and Switzerland, with the final third coming mainly from the Asia-Pacific region.
With its headquarters in Switzerland, UBS Wealth Management is present in more than 40 countries with approximately 190 offices (100 of which are in Switzerland). As of the end of 2018, around 23,600 people worldwide were employed by Global Wealth Management. In Switzerland, UBS Swiss Bank provides a complete set of retail banking services that includes chequing, savings, credit cards, and mortgage products for individuals. They offer cash management and commercial banking services for small businesses and corporate clients as well.
UBS global wealth management advisory operations in the Americas consists of U.S. and Canadian wealth management businesses, as well as international business booked in the U.S. UBS Wealth Management in the U.S. is an outgrowth of the former Paine Webber brokerage business. The business was initially renamed UBS Paine Webber in March 2001, after it was acquired by UBS. The division offers wealth management advice for ultra-high net worth and high net worth clients. UBS was named "Best Bank for Wealth Management in North America" at the Euromoney Awards for Excellence 2017.
In January 2026, it was announced that UBS began leasing 26,000 square feet of office space in Dallas, Texas to launch its UBS Wealth Advice Center hub.
In 2026, UBS was charged for repeatedly laundering money through one of its US subsidiaries and fined $125 million by FinCEN.
UBS's main competitors in this division are Bank of America, Morgan Stanley, JP Morgan Chase, Wells Fargo and Charles Schwab.
Personal and Corporate Banking
UBS's Personal & Corporate Banking division delivers financial products and services to retail, corporate and institutional clients in Switzerland. It also provides stable and substantial profits for the Group and revenue opportunities for businesses within the bank. UBS maintains a leading position in the retail and corporate loan market in Switzerland; in fact, it serves one in three pension funds, more than 85% of the 1,000 largest Swiss corporations and 85% of banks that resides within the nation. In 2015, 2017 and 2018, the international financial magazine Euromoney named UBS "Best Domestic Cash Manager Switzerland". As of 31 December 2018, its lending portfolio reached US$131 billion (~$161 billion in 2024).
The products that this UBS division offers range from cash accounts, payments, savings and retirement plans to investment fund products, residential mortgages and advisory services. This business division constitutes a central building block of UBS's universal bank delivery model in Switzerland and it supports other divisions, such as Investment Bank, by referring clients to them and by assisting them to build their wealth to a level at which they can be transferred to UBS Wealth Management. The retail and corporate distribution network comprises not only 279 branches in Switzerland, but 1,250 teller machines and self-service terminals, as well as digital banking services, serving 2.5 million personal banking clients.
UBS Asset Management
UBS Asset Management offers equity, fixed income, currency, hedge fund, global real estate, infrastructure and private equity investment capabilities that can also be combined in multi-asset strategies. The 1998 UBS-SBC merger and subsequent restructuring resulted in the combination of three major asset management operations: UBS Asset Management, Phillips & Drew (owned by Union Bank of Switzerland), and Brinson Partners (owned by SBC). The investment teams were merged in 2000 and in 2002 the brands were consolidated to become UBS Global Asset Management.
At the end of December 2018, UBS Asset Management was responsible for US$781 billion of invested assets and the assets under administration were US$413 billion.
With around 2,300 employees in 23 countries, UBS Asset Management is the largest mutual fund manager in Switzerland, a leading fund house in Europe, and one of the largest hedge funds and real estate investment managers in the world. It has main offices in Chicago, Hong Kong, London, New York City, Singapore, Sydney, Tokyo, and Zürich. With the aim to generate systematic products and services for clients, in 2017, UBS integrated Equities, Fixed Income and Solutions capabilities and hedge funds business within a new area named Investments. UBS also formed a new area of business named Real Estate and Private Markets by combining their Global Real Estate and Infrastructure and Private Equity businesses.
In February 2017, UBS Group AG and the Northern Trust Corporation, an American international financial services company, announced an agreement for the acquisition of UBS Asset Management's fund administration servicing units in Luxembourg and Switzerland. This acquisition will facilitate the expansion of the Northern Trust Corporation into these two countries, turning the American company into the major fund administrator in the local markets and into one of the ten global leaders in the sector. At the end of the transaction, completed in October 2017, the American company will administrate a total of CHF 420 billion in assets. UBS Asset Management will continue anyway to offer Management Company, White Labelling and Representative Services to its clients. Ulrich Körner, president of the UBS Asset Management, affirms that the continuous transformation of its platform is due to a major efficiency, effectiveness and geographical dislocation of the services offered by the bank.
UBS's main competitors in this division are BlackRock, Vanguard Group, State Street Global Advisers (SSGA), Fidelity Investments and Allianz Asset Management (AAM).
In April 2025, UBS Asset Management, which oversees $1.8 trillion in assets, has removed restrictions on some of its sustainability funds investing in manufacturers of conventional weapons. This marks a shift in European asset management, as investors respond to rising geopolitical tensions and a regional push for rearmament. UBS still maintains bans on controversial weapons like cluster munitions and biological arms but gave no explanation for lifting the conventional weapons ban. The trend reflects growing investor enthusiasm to support Europe's defense buildup, particularly amidst pressure from U.S. government and rising military spending across the continent. As a result, defense stocks have surged in value.
UBS Investment Bank
UBS Investment Bank provides services covering securities, other financial products, and research in equities, rates, credit, foreign exchange, precious metals and derivatives. As of the end of December 2018, the personnel employed at UBS Investment Bank totalled 5,205, present in 33 countries (with principal offices in Chicago, Frankfurt, Hong Kong, London, New York, Shanghai, Singapore, Tokyo and Zurich). This business division also advises and provides access to capital markets for corporate and institutional clients, governments, financial intermediaries, alternative asset managers, and private investors. UBS Investment Bank was formerly known as UBS Warburg and as Warburg Dillon Read, before the merger of the Union Bank of Switzerland and the Swiss Bank Corporation (SBC). Within the UBS Investment Bank division, the Investment Banking Department (IBD) provides a range of advisory and underwriting services including mergers and acquisitions, restructuring, equity offerings, investment grade and high yield debt offerings, leveraged finance and leveraged loan structuring, and the private placement of equity, debt, and derivatives.
The Sales & Trading division comprises equities (brokering, dealing, market making and engaging in proprietary trading in equities, equity-related products, equity derivatives, and structured products) and FX, Rates and Credit (FRC) (brokering, dealing, market making and engaging in proprietary trading in interest rate products, credit products, mortgage-backed securities, leveraged loans, investment grade and high-yield debt, currencies, structured products, and derivative products). Following an expansion in 2002, the trading floor covers 9,600-square-metre (103,000 sq ft) with 12-metre (40 ft) arched ceilings. Over US$1 trillion in assets are traded here every trading day. In June 2011, it was announced that UBS was considering moving its North American headquarters back to New York City, and that the bank was looking for office spaces in Midtown and in the rebuilt World Trade Center.
UBS's main competitors in this division are fellow members of the Bulge Bracket, particularly Goldman Sachs, JPMorgan Chase, and Bank of America.
The American division also offers its own credit card not sponsored by another bank unlike many of its competitors.
Competition
On a global scale, UBS competes with the largest global investment banks, particularly within the Bulge Bracket. and until acquiring Credit Suisse in 2023 was regularly compared against it. According to a 2018 study published by Coalition Research Institute, UBS was among the top 10 of the world's investment banks.
In Switzerland: UBS competes with a number of cantonal banks, such as Zürcher Kantonalbank, Banque cantonale vaudoise and other cantonal banks, as well as Raiffeisen, PostFinance, and the Migros Bank.
In Europe: UBS competes with several larger banks, such as Deutsche Bank, HSBC, Crédit agricole, BNP Paribas, Natixis, Royal Bank of Scotland, Santander and UniCredit.
In the United States: UBS competes with the largest American banks, such as Citigroup, Bank of America, Goldman Sachs, JPMorgan Chase and Morgan Stanley.
History
UBS was founded in 1862 as the Bank in Winterthur. The Bank in Winterthur came with the movement that founded multiple Suisse Grossbanken (Swiss big banks) that occurred in the latter sector of the 19th century. The name of the bank was derived from the town of Winterthur, which served as Switzerland's industrial hub in the 19th century. By 1854, six private bankers in Basel founded the Swiss Bank Corporation (SBC) to cater to the increasing credit needs of Swiss railroad and manufacturing companies. It formed a private banking syndicate that expanded, aided by Switzerland's international neutrality.
In 1912, the Bank of Winterthur merged with Toggenburger Bank to form the Union Bank of Switzerland (UBS) and grew rapidly after the Banking Law of 1934 codified Swiss banking secrecy. Following decades of market competition between Union Bank of Switzerland and the Swiss Bank Corporation (SBC), the two merged in 1998 to create a single company known solely as "UBS".
The agreement to merge had been made the previous year at a meeting of the Institut International d’Etudes Bancaires, a secretive club for European banking CEOs.
When Union Bank and SBC merged, officials originally wanted to name the merged company the "United Bank of Switzerland," but opted to call it simply UBS because of a name clash with the separate Swiss company United Bank Switzerland – a part of the United Bank Limited's Swiss subsidiary.
UBS is no longer an acronym for Union Bank of Switzerland, but is the company's brand, just like other prominent brands which used to be an abbreviation of a company name. The name 'UBS' came from one of its predecessor firms – the Union Bank of Switzerland. In fact, that was one of the more than 370 financial firms that have, since 1862, become part of today's UBS. Its logo of three keys was carried over from SBC, and stands for the company's values of confidence, security, and discretion.
During the 2008 financial crisis, UBS managed heavy losses with an asset relief recovery programme. In 2011, the company was hit by the 2011 rogue trader scandal resulting in a US$2 billion trading loss. In 2012, the bank reoriented itself around wealth management advisory services and limited its sell side operations.
Swiss Bank Corporation
UBS' earliest corporate ancestor was formed in 1854, when six private banking firms in Basel, Switzerland pooled their resources to form the Bankverein, a consortium that acted as an underwriting syndicate for its member banks. In 1871, the Bankverein coordinated with the German Frankfurter Bankverein to form the Basler Bankverein, a joint-stock company replacing the original Bankverein consortium. After the new bank started with an initial commitment of CHF 30 million and CHF 6 million of share capital, it soon experienced growing pains when heavy losses in Germany caused it to suspend its dividend until 1879. Following the years 1885 and 1886, when the bank merged with the Zürcher Bankverein and acquired the Basler Depositenbank and the Schweizerische Unionbank, it changed its name to Schweizerischer Bankverein. The English name of the bank was originally Swiss Bankverein, but was changed to Swiss Bank Corporation (SBC) in 1917.
SBC subsequently experienced a period of growth, which was only interrupted by the onset of World War I, in which the bank lost investments in a number of large industrial companies. By the end of 1918, the bank had recovered and surpassed CHF 1 billion in total assets and grew to 2,000 employees by 1920. The impact of the stock market crash of 1929 and the Great Depression was severe, particularly as the Swiss franc suffered major devaluation in 1936. The bank saw its assets fall from a 1929 peak of CHF 1.6 billion to its 1918 levels of CHF 1 billion by 1936.
In 1937, SBC adopted its three-keys logo, designed by Warja Honegger-Lavater, symbolizing confidence, security, and discretion, which remains an integral part in the current-day logo of UBS. On the eve of World War II in 1939, SBC, like other Swiss banks, was the recipient of large influxes of foreign funds for safekeeping. Just prior to the outbreak of the war, SBC made the timely decision to open an office in New York City. The office, located in the Equitable Building, was able to begin operations a few weeks after the outbreak of the war and was intended as a safe place to store assets in the case of an invasion. During the war, the banks' traditional business fell off and the Swiss government became its largest client.
In 1945, SBC acquired the Basler Handelsbank (Commercial Bank of Basel), which was one of the largest banks in Switzerland, but became insolvent by the end of the war. SBC remained among the Swiss government's leading underwriters of debt in the post-war years. SBC, which had entered the 1950s with 31 branch offices in Switzerland and three abroad, more than doubled its assets from the end of the war to CHF 4 billion by the end of the 1950s and doubled assets again in the mid-1960s, exceeding CHF 10 billion by 1965. In 1961, SBC acquired Banque Populaire Valaisanne, based in Sion, Switzerland, and the Banque Populaire de Sierre. The bank opened a full branch office in Tokyo in 1970.
In 1992, SBC acquired O'Connor & Associates, a Chicago-based options trading firm and the largest market maker in the financial options exchanges in the U.S. O'Connor was combined with SBC's money market, capital market, and currency market activities to form a globally integrated capital markets and treasury operation. In 1994, SBC acquired Brinson Partners, an asset management firm focused on providing access for U.S. institutions to global markets, for US$750 million. Following the acquisition, founder Gary P. Brinson ran SBC's asset management business and later when SBC merged with UBS was named chief investment officer of UBS Asset Management. The acquisition of S.G. Warburg & Co., a leading British investment banking firm, in 1995 for the price of US$1.4 billion (~$2.62 billion in 2024) signified a major push into investment banking. S.G. Warburg & Co. had established a reputation as a daring merchant bank that grew to be one of the most respected investment banks in London. However, a Warburg expansion into the U.S. had turned out flawed and costly, and talks in 1994 with Morgan Stanley about a merger had collapsed. SBC merged the firm with its own existing investment banking unit to create SBC Warburg.
Two years later, in 1997, SBC paid US$600 million (~$1.09 billion in 2024) to acquire Dillon, Read & Co., a U.S. bulge bracket investment bank. Dillon, Read & Co., which traced its roots to the 1830s, was among the powerhouse firms on Wall Street in the 1920s and 1930s, and by the 1990s had a particularly strong mergers and acquisitions advisory group. Dillon Read had been in negotiations to sell itself to ING, which owned 25% of the firm already, but Dillon Read partners balked at ING's integration plans. After its acquisition by SBC, Dillon Read was merged with SBC-Warburg to create SBC-Warburg Dillon Read. Following SBC's later merger with Union Bank of Switzerland, the SBC part was dropped from the name; in 2000 when the new UBS got restructured the Dillon Read name was dropped, although it was brought back in 2005 as Dillon Read Capital Management, UBS's ill-fated hedge fund operations.
Union Bank of Switzerland
The Union Bank of Switzerland emerged in 1912 when the Bank in Winterthur fused with the Toggenburger Bank. The Bank in Winterthur, founded in 1862 with an initial share capital of CHF 5 million, focused on providing financing for industry and other companies, and had profited considerably from its close railroad connections and large warehousing facilities during the American Civil War when cotton prices rose dramatically. The Toggenburger Bank was founded in 1863 with an initial share capital of CHF 1.5 million, and specialized as a savings and mortgage bank for individual customers, maintaining a branch office network in eastern Switzerland. The new company was initially traded under the English name Swiss Banking Association, but in 1921 it was changed to Union Bank of Switzerland (UBS) to mirror its French name, Union de Banques Suisses. In German, the bank was known as the Schweizerische Bankgesellschaft (SBG).
The combined bank had total assets of CHF 202 million and a total shareholders' equity of CHF 46 million. In 1917, UBS completed the construction of a new headquarters, Münzhof, in Zurich's Bahnhofstrasse, considered to be the Wall Street of Switzerland. By 1923, offices were established throughout Switzerland. Although the bank suffered in the aftermath of World War I and the Great Depression, it was able to make several smaller acquisitions; in 1937 it established Intrag AG, an asset management business responsible for investment trusts, (i.e. mutual funds).
The activities of the Union Bank of Switzerland during World War II were not publicly known until decades after the war, when it was demonstrated that UBS likely took active roles in trading stolen gold, securities, and other assets during World War II. The issue of "unclaimed property" of Holocaust victims became a major issue for UBS in the mid-1990s, and a series of revelations in 1997 brought the issue to the forefront of national attention in 1996 and 1997. UBS confirmed that a large number of accounts had gone unclaimed as a result of the bank's policy of requiring death certificates from family members to claim the contents of the account. UBS's handling of these revelations were largely criticized and the bank received significant negative attention in the U.S. UBS came under significant pressure, particularly from American politicians, to compensate Holocaust survivors who were making claims against the bank.
Shortly after the end of World War II, Union Bank of Switzerland completed the acquisition of the Eidgenössische Bank, a large Zürich-based bank that became insolvent. As a result of the merger, Union Bank of Switzerland exceeded CHF 1 billion in assets and moved its operations to Zürich. UBS opened branches and acquired a series of banks in Switzerland in the following years, growing from 31 offices in 1950 to 81 offices by the early 1960s. In 1960, Union Bank of Switzerland acquired an 80% stake in Argor SA, a Swiss precious metals refinery founded in 1951 in the canton of Ticino. UBS continues to issue gold bars via Argor-Heraeus which is famous for the unique kinebar holographic technology it uses to provide enhanced protection against bank gold bar counterfeiting. By 1962, Union Bank of Switzerland reached CHF 6.96 billion of assets, narrowly edging ahead of Swiss Bank Corporation to become the largest bank in Switzerland. The rapid growth was punctuated by the 1967 acquisition of Interhandel, which made UBS one of the strongest banks in Europe.
By the 1980s, Union Bank of Switzerland established a position as a leading European underwriter of Eurobonds. Following two major acquisitions in 1986 (Phillips & Drew and Deutsche Länderbank), UBS made its first purchase in the United States in 1991 with Chase Investors Management Corporation, the asset management business of Chase Manhattan Bank. At the time of the acquisition, the business managed in excess of US$30 billion in assets. The bank's investments had been in the conservative asset management and life insurance businesses; further, 60% of the bank's profits came from its even more conservative Swiss banking operations. In 1993, Credit Suisse outbid Union Bank of Switzerland for Switzerland's Swiss Volksbank, the fifth largest bank in Switzerland which had run into financial difficulties in the early 1990s. The acquisition propelled Credit Suisse ahead of Union Bank of Switzerland as the largest bank in Switzerland for the first time. Prior to the merger with Swiss Bank Corporation, UBS purchased a group of smaller Swiss banks in 1994 including the Cantonal Bank of Appenzell-Ausserrhoden in 1996, and in 1997 Schröder, Münchmeyer, Hengst & Co. from Lloyds Bank was acquired to improve access to the German investment banking and private wealth management markets.
Merger of Union Bank of Switzerland and Swiss Bank Corporation: 1998
During the mid-1990s, Union Bank of Switzerland came under fire from dissident shareholders critical of its conservative management and lower return on equity. Martin Ebner, through his investment trust, BK Vision, became the largest shareholder in Union Bank of Switzerland and attempted to force a major restructuring of the bank's operations. Looking to take advantage of the situation, Credit Suisse approached Union Bank of Switzerland about a merger that would have created the second largest bank in the world in 1996. Union Bank of Switzerland's management and board unanimously rebuffed the proposed merger. Ebner, who supported the idea of a merger, led a shareholder revolt that resulted in the replacement of Union Bank of Switzerland's chairman, Robert Studer with Mathis Cabiallavetta, one of the key architects of the merger with Swiss Bank Corporation.
On 8 December 1997, Union Bank of Switzerland and Swiss Bank Corporation announced an all-stock merger. At the time of the merger, Union Bank of Switzerland and Swiss Bank Corporation were the second and third largest banks in Switzerland, respectively. Discussions between the two banks had begun several months earlier, less than a year after rebuffing Credit Suisse's merger overtures. The merger resulted in the creation of UBS AG, a new bank with total assets of more than US$590 billion (~$1.07 trillion in 2024), the largest of its kind. During the merger, UBS chairman Marcel Ospel originally wanted to call the company "United Bank of Switzerland", but settled on simply using "UBS" following the acquisition of American brokerage firm, Paine Webber.
Colloquially referred to as the "New UBS" to distinguish itself from the former Union Bank of Switzerland, the combined bank became the second largest in the world at the time, behind only the Bank of Tokyo-Mitsubishi. Additionally, the merger pulled together the banks' various asset management businesses to create the world's largest money manager, with approximately US$910 billion in assets under management. Union Bank of Switzerland's Mathis Cabiallavetta became chairman of the new bank while Swiss Bank's Marcel Ospel was named chief executive officer. Nearly 80% of the top management positions were filled by legacy Swiss Bank professionals. Prior to the merger, Swiss Bank Corporation was considered to be further along than Union Bank of Switzerland in developing its international investment banking business, particularly in the higher margin advisory businesses where Warburg Dillon Read was considered to be the more established platform. Union Bank of Switzerland had a stronger retail and commercial banking business in Switzerland, while both banks had strong asset management capabilities. After the merger was completed, it was speculated that a series of losses suffered by UBS on its equity derivative positions in late 1997 was a contributing factor in pushing UBS management to consummate the merger.
Paine Webber and international expansion: 2000–2006
On 3 November 2000, UBS merged with Paine Webber, an American stock brokerage and asset management firm led by chairman and CEO Donald Marron. At the time of its merger with UBS, Paine Webber had emerged as the fourth largest private client firm in the United States with 385 offices employing 8,554 brokers. The acquisition pushed UBS to the top wealth and asset management firm in the world. Initially, the business was given the divisional name UBS PaineWebber but in 2003 the 123-year-old name Paine Webber disappeared when it was renamed UBS Wealth Management USA. UBS took a CHF 1 billion write-down for the loss of goodwill associated with the retirement of the Paine Webber brand when it integrated its brands under the unified UBS name in 2003.
John P. Costas, a former bond trader and co-head of Fixed income at Credit Suisse First Boston and head of Fixed Income Trading at Union Bank of Switzerland in 1998, was appointed CEO of UBS's investment banking division, which originated in SBC's Warburg Dillon Read division and was renamed UBS Warburg in December 2001. In an attempt to break into the elite bulge bracket of investment banks, in which UBS then had little success while rival Credit Suisse was establishing itself as a major player on Wall Street with the acquisition of Donaldson, Lufkin & Jenrette in 2000, Costas shifted the growth strategy from acquiring entire firms to hiring individual investment bankers or teams of bankers from rival firms. Costas had followed a similar approach in building out the UBS fixed income business, hiring over 500 sales and trading personnel and increasing revenues from US$300 million in 1998 to over US$3 billion by 2001.
The arrival of former Drexel Burnham Lambert investment banker Ken Moelis marked a major coup for Costas. Moelis joined UBS from Donaldson Lufkin & Jenrette in 2001 shortly after its acquisition by Credit Suisse First Boston (although Huw Jenkins claimed he had hired Moelis to the UK Parliamentary Banking commission while under oath, which is patently false). In his six years at UBS, Moelis ultimately assumed the role of president of UBS Investment Bank and was credited, along with Costas, with the build-out of UBS's investment banking operation in the United States. Within weeks of joining, Moelis brought over a team of 70 bankers from Donaldson, Lufkin & Jenrette. Costas and Moelis hired more than 30 senior U.S. bankers from 2001 through 2004. It was estimated that UBS spent as much as US$600 million to US$700 million hiring top bankers in the U.S. during this three-year period. Among the bank's other major recruits during this period were Olivier Sarkozy, Ben Lorello, Blair Effron, and Jeff McDermott. By 2003, UBS had risen to fourth place from seventh in global investment banking fees, earning US$2.1 billion of the US$39 billion paid to investment banks that year, increasing 33%. Over the next four years, UBS consistently ranked in the top 4 in the global fee pool and established a track record of 20 consecutive quarters of rising profits.
In 2006, UBS set up a joint venture in China (see UBS Securities, China branch). However, by the end of 2006, UBS began to experience changing fortunes. In late 2005, Costas headed a new hedge fund unit within UBS known as Dillon Read Capital Management. His former position was taken over by Huw Jenkins, a long-time legacy UBS investment banker. In 2006, UBS bankers Blair Effron and Michael Martin announced their departures. In March 2007, Moelis announced that he was leaving the company, and shortly thereafter founded a new business, Moelis & Company. As he had when joining UBS, Moelis took a large team of senior UBS investment bankers. Moelis's departure was caused primarily by repeated conflict over the availability of capital from the bank's balance sheet to pursue large transactions, particularly leveraged buyouts. The bank's apparent conservatism would be turned on its head when large losses were reported in various mortgage securities rather than corporate loans that generated investment banking fees. After Moelis, other notable departures included investment banking co-head Jeff McDermott in early 2007 and, as the 2008 financial crisis set in, other high-profile bankers such as Oliver Sarkozy in early 2008 and Ben Lorello in 2009.
UBS was fined $100 million by the FED in 2004 for trading in dollars with Iran and other sanctioned countries.
Subprime mortgage crisis and recovery: 2007–2009
At the beginning of 2007, UBS became the first Wall Street firm to announce a heavy loss in the subprime mortgage sector as the subprime mortgage crisis began to develop. In May 2007, UBS announced the closure of its Dillon Read Capital Management (DRCM) division. Although in 2006, DCRM had generated a profit for the bank of US$720 million, after UBS took over DRCM's positions in May 2007, losses grew from the US$124 million recorded by DRCM, ultimately to "16% of the US$19 billion in losses UBS recorded." The UBS investment bank continued to expand subprime risk in the second quarter of 2007 while most market participants were reducing risk, resulting in not only expanding DRCM losses but creating 84% of the other losses experienced by the bank.
In response to the growing series of problems at UBS, and possibly his role in spearheading Costas' departure from the bank, Peter Wuffli unexpectedly stepped down as CEO of the firm during the second quarter of 2007. Wuffli would be joined by many of his fellow managers in the next year, most notably the bank's chairman Marcel Ospel. However, the bank's problems continued through the end of 2007, when the bank reported its first quarterly loss in over five years. As its losses jeopardized the bank's capital position, UBS quickly raised US$11.5 billion of capital in December 2007, US$9.7 billion of which came from the Government of Singapore Investment Corporation (GIC) and US$1.8 billion from an unnamed Middle Eastern investor.
After a significant expansion of fixed income risk during 2006 and 2007 under the leadership of Huw Jenkins, the UBS Investment Bank CEO, the bank's losses continued to mount in 2008 when UBS announced in April 2008 that it was writing down a further US$19 billion of investments in subprime and other mortgage assets.
By this point, UBS's total losses in the mortgage market were in excess of US$37 billion, the largest such losses of any of its peers. In response to its losses, UBS announced a CHF 15 billion rights offering to raise the additional funds need to shore up its depleted reserves of capital. UBS cut its dividend to protect its traditionally high Tier 1 capital ratio, seen by investors as a key to its credibility as the world's largest wealth management company. In October 2008, UBS announced that it had placed CHF 6 billion of new capital, through mandatory convertible notes, with Swiss Confederation. The Swiss National Bank and UBS made an agreement to transfer approximately US$60 billion of currently illiquid securities and various assets from UBS to a separate fund entity. In November 2008, UBS put US$6 billion (~$8.56 billion in 2024) of equity into the new "bad bank" entity, keeping only an option to benefit if the value of its assets were to recover. Heralded as a "neat" package by The New York Times, the UBS structure guaranteed clarity for UBS investors by making an outright sale. UBS announced in February 2009 that it had lost nearly CHF 20 billion (US$17.2 billion) in 2008, the biggest single-year loss of any company in Swiss history. During the 2008 financial crisis, UBS wrote down more than US$50 billion (~$72.7 billion in 2024) from subprime mortgage investments and cut more than 11,000 jobs. By the spring of 2009, UBS announced another management restructuring and initiated a plan to return to profitability. Jerker Johansson, the head of the investment bank division, resigned in April 2009 and was replaced by Alex Wilmot-Sitwell and Carsten Kengeter. At the same time, UBS announced the planned cut of 8,700 jobs and had implemented a new compensation plan. Under the plan, no more than one-third of any cash bonus would be paid out in the year it is earned with the rest to be held in reserve and stock-based incentives that would vest after three years. In April 2009, UBS announced that it agreed to sell its Brazilian financial services business, UBS Pactual, for approximately US$2.5 billion (~$3.54 billion in 2024) to BTG Investments.
The Swiss government sold its CHF 6 billion stake in UBS in late 2008 at a large profit; Switzerland had purchased convertible notes in 2008 to help UBS clear its balance sheets of toxic assets. Taking advantage of improved conditions in the stock market in mid-2009, UBS placed US$3.5 billion of shares with a small number of large institutional investors. Oswald Grübel announced, "We are building a new UBS, one that performs to the highest standards and behaves with integrity and honesty; one that distinguishes itself not only through the clarity and reliability of the advice and services it provides but in how it manages and executes." Grübel reiterated plans to maintain an integrated business model of providing wealth management advisory, investment banking, and asset management services.
Shift to private banking and market reemergence: 2010–2022
In August 2010, UBS launched a new advertising campaign featuring the slogan: "We will not rest" and signed a global sponsorship agreement with Formula 1. On 26 October 2010, UBS announced that its private bank recorded net new funds of CHF 900 million during the third quarter, compared to an outflow of CHF 5.5 billion in second quarter. UBS's third quarter net profit of US$1.65 billion (~$2.31 billion in 2024) beat analyst estimates, continuing a string of profitability. After the elimination of almost 5,000 jobs, UBS announced on 23 August 2011 that it was further cutting another 3,500 positions to "improve operating efficiency" and save CHF 1.5 to CHF 2 billion a year. 45 percent of the job cuts would come from the investment banking unit, which continued to post dismal figures since the 2008 financial crisis, while the rest would come from the wealth management and asset management divisions. The firm has seen profits fall due to the rise of the Swiss franc.
On 15 September 2011, UBS became aware of a massive loss, originally estimated at US$2 billion (~$2.74 billion in 2024), allegedly due to unauthorized trading by Kweku Adoboli, a then 31-year-old Ghanaian trader on the delta one desk of the firm's investment bank. Adoboli was arrested and later charged with fraud by abuse of position and false accounting dating as far back as 2008. UBS's actual losses were subsequently confirmed as US$2.3 billion, and according to the prosecutor in Adoboli's trial he "was a gamble or two from destroying Switzerland's largest bank for his own benefit." On 24 September 2011 UBS announced chief executive Oswald Grübel's resignation, and the appointment of Sergio Ermotti as his replacement on an interim basis.
On 30 October 2012, UBS announced that it was cutting 10,000 jobs worldwide in an effort to slim down its investment banking operations, of which 2,500 would be in Switzerland, followed by the United States and Great Britain. This 15-percent staff cut would make overall staff count come down from 63,745 to 54,000. (For comparison, the peak employment level in 2007 before the 2008 financial crisis was 83,500). UBS also announced that the investment bank would focus on its traditional strengths and exit much of its fixed income trading business that was not economically profitable. On 19 December 2012, UBS was fined $1.5 billion (~$2.02 billion in 2024) for its role in the Libor scandal over accusations that it tried to rig benchmark interest rates. In November 2014, regulators including the FCA and CFTC hit UBS with fines, along with other banks, for currency manipulation. On 6 January 2014, it was reported that UBS had become the largest private banker in the world, with $1.7 (~$2.21 trillion in 2024) trillion in assets. In May 2015, media reports revealed UBS is planning to sell its Australian private banking division to some of its management after a review of underperforming businesses was conducted at the company.
In late 2016, the bank created the digital currency "Utility Settlement Coin" (USC) to accelerate inter-bank settlements and established a blockchain technology research laboratory in London. From 2012 to 2018, the investment bank, led by Andrea Orcel, initiated a major restructuring, firing over 10,000 employees and focusing on European underwriting business instead of traditional dealmaking. UBS announced in January 2018 that it does not trade or expose clients to cryptocurrencies as it believes they have little to no elasticity, and are speculatively valued. It partnered with technology company IBM to launch a blockchain trade finance platform called "Batavia" in early 2018.
In April 2021, UBS reported a $774 million (~$881 million in 2024) loss from the collapse of US investment fund Archegos Capital Management.
In July 2021, during the COVID-19 pandemic, UBS announced it would continue to allow for flextime and remote work by many employees, noting that they did not impede productivity. The announcement distinguished the bank from its competitors, such as Morgan Stanley and Goldman Sachs, which pressured on employees to return to the office as COVID-19 lockdowns and measures eased.
In January 2022, UBS agreed to acquire Wealthfront for $1.4 billion. UBS expects to accelerate its growth in the US with the purchase, and will operate Wealthfront as a business within UBS Global Wealth Management. The acquisition was mutually terminated in September 2022 with both companies not providing a reason. UBS announced that it would instead invest in a $69.7 million note convertible into Wealthfront shares, valuing the latter at its acquisition price.
In November 2022, Fang Xinghai, vice chairman of the China Securities Regulatory Commission, made remarks by prerecorded video to the Global Financial Leaders' Investment Summit. In it, he warned investors to not read too much foreign news (international media) about China, and said that some international investors read "too much" of it. Later at the Summit, Colm Kelleher said, regarding global bankers, that "we're all very pro-China," and in reference to Fang's comments, said "We're not reading the American press, we actually buy the [China] story."
Acquisition of Credit Suisse: 2023
In March 2023, UBS agreed to buy Credit Suisse, one of its main competitors, for $3.25 billion (CHF 3 billion), in an emergency rescue deal. On 29 March 2023 it was announced that Sergio Ermotti is returning as chief executive officer from 5 April 2023, replacing Ralph Hamers after just over two years in charge, after approval by 5 April 2023 annual general meeting. Hamers is expected to stay with the bank for a transition period. UBS completed the acquisition on 12 June 2023.
On 28 June, it became known that UBS plans to lay off more than half of Credit Suisse's employees. First of all, the reduction will affect traders and support staff in London, New York and some Asian divisions. Prior to the takeover, Credit Suisse employed about 45,000 people.
In July 2023, UBS was fined $269 million by the Federal Reserve and $119 million by the Bank of England for Credit Suisse's failure in risk management related to Archegos's collapse. In August 2023, UBS settled with the US Justice Department by agreeing to pay $1.43 billion in civil penalties regarding allegations of fraud and misconduct in its residential mortgage-backed securities offerings it offered in 2006 and 2007.
According to Citigroup, the new bank will account for 35% of domestic deposits, 31% of corporate loans and 26% of mortgages in Switzerland. UBS will keep the Swiss business of Credit Suisse but will retire its brand. UBS says it plans to cut costs by $10 billion. UBS also announced at the end of August 2023 that money outflows have stopped at Credit Suisse.
In early September 2023, UBS had clearly profited from the takeover as its stocks were increasingly valuable. From April to July, UBS made a record profit of 29.2 billion CHF and its stocks, which were initially depressed after the fusion, were traded at much higher prices. The record profit was based on the difference between the purchase price of Credit Suisse stocks and the apparently higher value of its assets.
In September 2023, the US Department of Justice (DOJ) started investigating UBS for Credit Suisse's alleged compliance failures which enabled its Russian clients to dodge sanctions. Later UBS stated that the bank is not aware of such a probe by the DOJ and that previous reports on such allegations were incorrect.
In May 2025, UBS agreed to pay $511 million to settle a U.S. Department of Justice investigation into Credit Suisse's assistance to wealthy Americans in hiding over $4 billion in offshore accounts. This settlement includes a guilty plea from Credit Suisse Services AG for aiding in the preparation of false tax returns and a non-prosecution agreement related to undeclared accounts in Singapore.
In October 2025, UBS appointed Beatriz Martin as its chief operations officer, who had been the company's chief group integration officer since 2023. As part of the role, Martin will oversee the integration of Credit Suisse following its acquisition in 2023. In the same announcement, UBS said it remains on track to complete the Credit Suisse integration by the end of 2026.
In February 2026, UBS joins foreign banks expanding India global capability hubs and opened a new global capability centre in the southern Indian city of Hyderabad.
Acquisition history
As it exists today, UBS represents a conglomeration of dozens of individual firms, many of which date back to the 19th century. Over the years, these firms merged to form the bank's three major predecessors, Union Bank of Switzerland, Swiss Bank Corporation, ICO Markets Exchange Clearing Limited and Paine Webber. The following is a visual illustration of the company's major mergers and acquisitions and historical predecessors, although this is not necessarily a comprehensive list:
Corporate governance
Senior leadership
Chairman: Colm Kelleher (since April 2022)
Chief Executive: Sergio Ermotti (since April 2023); second term In March 2025, he received SFr14.9 million ($16.8 million) in compensation last year, making him Europe's highest-paid bank executive, amid discussions on capping executive pay in Switzerland.
List of former chairmen
Mathis Cabiallavetta (1998)
Alex Krauer (1998–2001)
Marcel Ospel (2001–2008)
Peter Kurer (2008–2009)
Kaspar Villiger (2009–2012)
Axel Weber ( 2012–2022)
List of former chief executives
Marcel Ospel (1998–2001)
Peter Wuffli (2001–2007)
Marcel Rohner (2007–2009)
Oswald Grübel (2009–2011)
Sergio Ermotti (2011–2020)
Ralph Hamers (2020–2023)
Shareholders
As disclosed under the Swiss Stock exchange Act, the most significant shareholders of UBS are GIC Private Limited with 7.07%, BlackRock Inc with 4.98%, Norges Bank with 3.30%, MFS Investment Management with 3.05% and Capital Group Companies with 3.01% of total share capital. In 2008 during the subprime mortgage crisis, GIC Private Limited invested CHF 11 billion into UBS to help bail it out, thus becoming the largest single shareholder.
Additionally, the UBS Group AG disclosed shareholders registered in their share register with 3% or more of shares issued. As of 30 September 2017, these are Chase Nominees Ltd, DTC (Cede & Co.) and Nortrust Nominees Ltd with 10.32%, 6.63% and 4.04% of total share capital respectively.
As of 30 June 2019, shareholdings of the Group were distributed as follows:
Banking secrecy
UBS frequently cites Swiss culture—specifically its penchant for privacy, security and neutrality—as foundational to its company culture. Although banking secrecy started in the 1700s, Switzerland drafted a series of banking regulations and statutes in the late 1800s and 1930s to protect and secure banks within its borders. The most prominent was the Federal Act on Banks and Savings Banks, known simply as the "Banking Law of 1934". The federal law prohibits and criminalizes the distribution and release of client information to third parties. The bill was passed by the Swiss Federal Assembly to combat the seizure of client assets and information for reasons debated by historians. UBS, then known as the Swiss Bank Corporation, received large influxes of capital from Europe for safe keeping during the war. More than two dozen Swiss banking statutes were drafted from 1934 to 2008 to strengthen banking secrecy at UBS Switzerland AG. In 2018, Switzerland, alongside major Swiss banks including UBS, was ranked first on the Financial Secrecy Index. UBS was the largest wealth manager in 23 of the top 25 countries on the 2018 Financial Secrecy Index.
While UBS maintains the strictest banking secrecy policies in Switzerland, its policies across Europe and especially the United States are comparable. Within the U.S., the bank is prohibited from disclosing client activities and information both internally and through regulation imposed by the Financial Industry Regulatory Authority (FINRA), Federal Reserve, Federal Deposit Insurance Corporation (FDIC), U.S. Treasury, Securities and Exchange Commission (SEC), and various U.S. state regulators. UBS employees are prohibited from discussing client activity or information publicly, sharing information across borders, retaining client information insecurely and required to maintain robust bank-client confidentiality agreements. In 2018, UBS operations within the U.S. were ranked second on the Financial Secrecy Index, following UBS Switzerland AG. Within the European Union (E.U.), UBS operations maintain similar banking secrecy policies to Switzerland in the following countries and crown dependencies: Jersey, Austria, Luxembourg, Liechtenstein, Monaco, and the Isle of Man. Substantial, albeit greatly reduced, banking secrecy provisions are afforded to UBS operations in France, Germany, Ireland, and the Netherlands.
Hidden assets
UBS, along with other Swiss banks, maintains a variety of hidden assets and numbered bank accounts in an effort to preserve anonymity and confidentiality. Despite its name, hidden accounts are not truly hidden. The usage of these types of accounts (and assets) limits the knowledge of the account between the client and a restricted number of private bankers who retain record of who the account belongs to.
In January 1997, Christoph Meili, a night guard at the Union Bank of Switzerland (precursor of UBS) in Zürich, publicly announced that bank officials were destroying documents about orphaned assets, believed to be the credit balances of both Nazi German and Jewish clients attained during World War II. Soon after, Zurich authorities opened a judicial investigation against Meili for suspected violations of the Swiss laws on banking secrecy. After a US$2.56 billion lawsuit was filed against UBS and other Swiss banks on behalf of the Jewish victims of the Holocaust, a settlement was reached that totalled US$1.25 billion in August 1998. In July 2025, Bloomberg News reported investigators had uncovered documents that suggested Credit Suisse did not disclose billions of dollars of assets held in accounts owned by Nazis and that the bank could be liable for between $5 billion to $10 billion. UBS opened its own investigation, hiring Neil Barofsky to complete a report on the matter. The U.S. Senate also opened an investigation. UBS said it would resist efforts to reopen the 1998 settlement or expand the scope of the investigation.
The Swiss government has taken steps to curb the usage of hidden services by foreign account holders as they have been frequently used to facilitate the transfer of "black money". In May 2013, Switzerland announced that it would amend certain banking secrecy laws applicable to UBS Switzerland AG to allow the disclosure of hidden client accounts to various investigative authorities. However, the disclosure of such information is heavily regulated and only "occur exclusively within the scope of administrative assistance procedures based on a valid double taxation agreement."
Bank vaults and bunkers
UBS, along with other Swiss banks, owns and operates undisclosed or otherwise secretive bank vaults, storage facilities or underground bunkers for gold bars, diamonds, cash, or other valuable physical assets. The geographical location of these facilities are undisclosed to the public but are known to be present in the mountainous regions of the Swiss Alps. These facilities are not subject to the same banking regulations as banks in Switzerland and do not have to report holdings to regulatory agencies. According to the Swiss Armed Forces, UBS purchased four former military bunkers to convert into storage facilities throughout the 1980s and 1990s. Three of these bunkers are not accessible by road or foot and require aircraft transportation. The transfer of assets to these bunkers is selective as a multi-stage security clearance is required and is not available to all UBS clients. In special circumstances, UBS contracts smaller banks in Southern Switzerland to maintain company assets.
The largest disclosed Swiss bank vault is five floors (19 metres or 62 feet) under the bank's Geneva headquarters. In July 2013, UBS established a gold storage facility and depository in Singapore for high net worth and ultra high net worth clients in its Hong Kong, China, and Malaysia markets who are willing to pay high fees and commissions for the highest level of secrecy and safety for their assets.
Tax evasion
The strict banking secrecy policies and bank-client confidentiality agreements at UBS have frequently been used to avoid, evade or otherwise escape foreign direct taxation. UBS reached multilateral agreements with the U.S. Internal Revenue Service (IRS) and U.K. HM Revenue and Customs in 2009 and 2010, respectively. These agreements ensured a line of communication between the tax agencies and all registered Swiss banks. The most commonly used stipulation triggered by select UBS Switzerland AG clients regard the following statute: Swiss banks are only allowed to disclose client information if a client is legally charged with proof of deliberate financial fraud, not merely the non-reporting of assets to avoid taxation.
The banking privacy policies of UBS have led to numerous controversies and disagreements with foreign governments:
In 2007, Bradley Birkenfeld, a Geneva-based employee who worked in the bank's North American wealth management business, claimed that UBS's dealings with American clients violated an agreement between the bank and the U.S. Internal Revenue Service. He subsequently complained to UBS compliance officials about the bank's "unfair and deceptive business practices", which included sponsoring events like yacht races and art festivals in the United States to attract wealthy people as potential clients. UBS was charged by the U.S. Federal Bureau of Investigation and ordered it to cease providing cross-border private banking services to US-domiciled clients through its non-US regulated units as of July 2008.
In 2012, the German government saw to it that UBS Deutschland AG came under investigation by prosecutors in Mannheim, Germany, after a tax probe revealed suspicious funds transfers from Germany to Switzerland allegedly facilitated by the bank's Frankfurt office. UBS Deutschland's Frankfurt office was raided by tax investigators in May 2012, and over 100,000 computer files and records were seized for evidence. The bank, which claims it is cooperating with the investigators, said that "an internal investigation into the specific allegations has not identified any evidence of misbehaviour by UBS Deutschland AG."
In 2014, the French government launched an investigation into UBS France's alleged abetting of tax evasion by French taxpayers. The investigation estimated the amount of tax income lost to UBS-controlled offshore accounts at €600 billion. In July 2014, the bank was required to post a bond of 1.1 billion euros, which UBS complied with while making multiple appeals in the French court system, finally losing its appeal at the Cour de Cassation, France's highest court. That same year, UBS accused the French government of engaging in a "highly politicized process" in its investigation of the bank.
In December 2021, UBS was criminally convicted by an appeals court in France for "illegal banking activities", money laundering and "aggravated tax fraud" and fined €1.8 billion. UBS has said it is appealing that decision.
Corporate social responsibility
In January 2010, UBS issued a new code of conduct and business ethics which all employees were encouraged to sign. The code addressed issues such as financial crime, competition, confidentiality, as well as human rights and environmental issues. The eight-page code also lays out potential sanctions against employees who violate it, including warnings, demotions, or dismissal. According to Kaspar Villiger, former chairman of the board, and Oswald J. Grübel, former Group CEO, the code is "an integral part of changing the way UBS conducts business".
In 2011, UBS expanded its global compliance database to include information on environmental and social issues provided by RepRisk, a global research firm specialized in environmental, social and corporate governance (e.g., ESG) risk analytics and metrics. This was done in an effort to mitigate environmental and social risks that could impact the bank's reputation or financial performance and to simultaneously help globally standardize and systematically implement the firm's due diligence processes. RepRisk data is used in the on-boarding process to screen potential new clients and sourcing partners, alongside periodic client reviews and, also, to evaluate the risks related to transactions in investment banking and institutional lending.
In 2018, UBS held 0.72% of shares in HikVision (surveillance cameras), a subsidiary of the Chinese military conglomerate CETC.
In October 2019, UBS joined UN's Global Investors for Sustainable Development Alliance (GISD). UBS has committed to raise US$5 billion (~$5.69 billion in 2024) of SDG-related impact investments by the end of 2021, which aim to create a measurable positive social or environmental impact.
Research and development
Blockchain
UBS has been an early adopter regarding the use of blockchain technology in financial services. In April 2015, UBS opened an innovation lab at the Level39 technology accelerator space in London.
In August 2016, UBS announced that it will team up with BNY Mellon, Deutsche Bank, Banco Santander, brokerage company ICAP and the fintech company Clearmatics, to promote UBS's "Utility Settlement Coin" (USC). The USC is a blockchain-based digital currency that financial institutions could use to transact securities with each other, bypassing the traditional settlement processes which is ongoing.
IMECL
In 2021, UBS buys 31% ICO Markets Exchange Clearing Limited, Digital Asset Exchange, Regulator Company in the European Digital Asset Market which financial institutions and private clients they will use to trade securities among themselves, bypassing the traditional ongoing settlement processes.
Artificial intelligence
In 2018, UBS digitally cloned Daniel Kalt, one of its chief economists. Artificial intelligence expert FaceMe was hired to create an interactive avatar of Kalt that can meet with clients via television screen. The clients will be able to ask questions and receive answers, made possible by IBM's Watson AI technology.
Recognition
In 2006, for the fourth consecutive year, UBS was named one of the 100 Best Companies for Working Mothers living in the U.S. by Working Mother magazine. It is a member of the Stonewall Diversity Champions scheme and has active gay and lesbian, ethnic minority, and women's networking groups. UBS was included on Business Week's The Best Places to Launch a Career 2008, and ranked No. 96 out of the 119 total companies listed. On 2 February 2010, UBS topped the charts for the ninth year in a row in Institutional Investor's annual ranking of Europe's most highly regarded equity analysts. In a year of extremes for equity markets, money managers say that no firm did a better job than UBS to keep them informed about which European sectors, countries, and industries offered the greatest potential. On 4 May 2010, UBS Investment Bank was voted the leading pan-European brokerage firm for equity and equity linked research for a record tenth successive year. A Thomson Reuters Extel survey ranked UBS number one in all three of the key disciplines of research: Research (tenth year); Sales (ninth year running); and Equity Trading and Execution (up from second place in 2009). UBS was also named as the number one leading pan-European brokerage firm for economics and strategy research.
On 31 October 2013, UBS Wealth Management was voted the Best Global Private Bank by Professional Wealth Management, retaining the title in 2014 while also being recognized as the Best Private Bank for Philanthropy Services, and Best Global Brand in Private Banking. On 27 October 2016, for the 4th consecutive year, UBS Wealth Management won the Best Global Private Bank title, as well as the Best Private Bank in Asia award for the 5th consecutive year. UBS won the top prize again in 2018.
In 2014, the Group received Euromoney's Awards for Excellence 2014 as the Best global bank, and as the Best Bank in Switzerland. In 2017, UBS not only retained its leading position taken in 2016 in the main category best private banking services overall at the Euromoney's Private Banking Awards, but also received recognition as Western Europe's best bank for advisory 2017.
In 2018, for the third consecutive year, RobecoSAM, an organization specialized exclusively on Sustainability Investing and conducting extensive research, named UBS in its Industry group leader report 2018 for each of the industry groups represented in the Dow Jones Sustainability Index the group leader in Diversified Financials. The report highlighted Group's sustainability efforts directed through its UBS and Society program: a cross-divisional platform involving activities and capabilities in sustainable investing and philanthropy, environmental and human rights policies, UBS's own environmental footprint, as well as the community investment. The Group also received recognition from Global Finance which rates financial services providers that best meet the specialized needs of corporations on a global level. The selection criteria are focused less on the size, but rather on qualities that companies look for when choosing a provider. UBS was named in the category Global Winners as Best Private Bank in the World 2017, and in the list of global best banks 2017, the Group received the award as Global Winner in the category World's Best Investment Banks 2017.
In 2019, UBS was listed as one of the Top 50 World's Most Attractive Employers Global Business Ranking 2019 by Universum Global Survey.
Sponsorship
Sports
UBS is particularly active in sponsoring various golf tournaments, cross-country skiing in Switzerland, ice hockey, and a range of other events around the world. UBS was the sponsor of the Alinghi sailing ship, winner of the America's Cup in 2003. UBS has been or currently is a sponsor of the following sporting events and organizations:
Culture
UBS's cultural sponsorships are typically related to classical music and contemporary art, although the company also sponsors a range of film festivals, music festivals, and other cultural events and organizations. UBS supported the Guggenheim UBS MAP Global Art Initiative in which the Solomon R. Guggenheim Foundation identified and worked with artists, curators and educators from South and Southeast Asia, Latin America, and the Middle East and North Africa to expand their reach in the international art world and challenge the Western-centric view of art history. UBS has previously been or currently is a sponsor of the following cultural events and organizations:
Naming rights
UBS currently holds the naming rights to UBS Arena which is the home of the New York Islanders.
Source: Wikipedia, CC BY-SA 4.0 · View on Wikipedia ↗
UBS Stock Snapshot Price, market cap, P/E, EPS, ROE, debt/equity, 52-week range
UBS Stock Price Chart Daily OHLCV with technical indicators — pan, zoom, and customize your view
10-Year Performance Revenue, net income, margins and EPS trends
Valuation P/E, P/S, P/B, EV/EBITDA ratios — is the stock expensive or cheap?
Profitability Gross, operating and net margins; ROE, ROA, ROIC
Financial Health Debt, liquidity, solvency — balance sheet strength
Growth Revenue, EPS and net income growth: YoY, 3Y CAGR, 5Y CAGR
Capital Efficiency Asset turnover, inventory turnover, receivables turnover
Dividends Yield, payout ratio, dividend history, 5Y CAGR
| Ex-date | Amount |
|---|---|
| April 21, 2026 | $1.1020 |
| April 15, 2025 | $0.9040 |
| April 30, 2024 | $0.7000 |
| April 12, 2023 | $0.5500 |
| April 12, 2022 | $0.5000 |
| April 13, 2021 | $0.3700 |
| Nov. 24, 2020 | $0.3660 |
| May 5, 2020 | $0.3650 |
| May 6, 2019 | $0.6890 |
| May 8, 2017 | $0.6070 |
| May 12, 2016 | $0.8750 |
| May 11, 2015 | $0.5370 |
UBS Analyst Consensus Bullish and bearish analyst opinions, 12-month price target, upside
- Strong Buy 6 24.0%
- Buy 7 28.0%
- Hold 9 36.0%
- Sell 3 12.0%
- Strong Sell 0 0.0%
12-Month Price Target
3 analysts · 2026-08-26Earnings History EPS actual vs estimate, surprise %, beat rate, next earnings date
| Period | EPS Actual | EPS Est | Surprise |
|---|---|---|---|
| June 30, 2026 | $0.87 | $0.93 | -0.06% |
| March 31, 2026 | $0.90 | $0.86 | 0.04% |
| Dec. 31, 2025 | $0.37 | $0.54 | -0.17% |
| Sept. 30, 2025 | $0.76 | $0.54 | 0.22% |
| June 30, 2025 | $0.72 | $0.73 | -0.01% |
| March 31, 2025 | $0.37 | $0.54 | -0.17% |
Latest News Recent headlines mentioning this company
- Gold rebounds as bond jitters, debt fears and weaker dollar revive bullion demand
- U.S. equity funds attract first weekly inflow in three weeks
- These 2 Analysts Just Upped Their AMD Stock Price Targets. Here’s Why.
- UBS Warns Trump's 100% Generic Drug Tariff Puts Indian Pharma "On Notice"; Goldman Flags Reshoring Winners
- KOSPI Rebounds Nearly 4% in Early Trading, Escaping Bear Market Territory
- Agentic AI Will Help Okta (OKTA) Register New All-Time Highs
- UBS Checks With Major Restaurant Franchisees Reveal Troubling Consumer Trends
- Mizuho Sees Improved Regulatory Stability, Raises Cigna (CI) Price Objective
- What Do Analysts Think About Universal Health Services (UHS) Amid Its Decline To 52-Week Low?
- Cerebras shares climb as Wall Street brokerages back AI chip strategy
My Metrics Your personal watchlist — selected rows from Full Fundamentals
Pick the metrics that matter to you — click the ➕ next to any row in Full Fundamentals above.
Your selection is saved and follows you across all tickers.
Institutional owners (13F) 854 filers · $42.7B total · As of June 30, 2026
Institutions that report holding this stock in their quarterly SEC Form 13F. Long positions only; a single filer may appear twice for separate option legs. Large offsetting put/call legs typically reflect market-making or hedged inventory, not directional conviction.
| New positions | Exited positions | Increased | Decreased | Net shares change |
|---|---|---|---|---|
| 140 (+24 vs prior Q) | 51 (-30 vs prior Q) | 278 (+22 vs prior Q) | 243 (+8 vs prior Q) | +116.4M |
Compared to Q1 2026. SEC Form 13F filings are due within 45 days of quarter-end plus a short buffer for late filers — quarters still inside that window are skipped in favor of the most recent fully-reported pair.
| Institution | Value | Shares | % of tracked 13F | Type |
|---|---|---|---|---|
| VANGUARD CAPITAL MANAGEMENT LLC | $4,860,963,249 | 98,080,411 | 11.39% | Shares |
| NORGES BANK | $4,750,179,008 | 95,849,980 | 11.13% | Shares |
| Fisher Asset Management, LLC | $3,217,449,809 | 64,920,294 | 7.54% | Shares |
| Zurcher Kantonalbank (Zurich Cantonalbank) | $2,742,992,871 | 55,233,032 | 6.43% | Shares |
| WELLINGTON MANAGEMENT GROUP LLP | $2,671,520,850 | 53,793,867 | 6.26% | Shares |
| Cevian Capital II GP LTD | $2,384,711,973 | 48,117,675 | 5.59% | Shares |
| Pictet Asset Management Holding SA | $1,824,778,416 | 36,743,822 | 4.28% | Shares |
| Dodge & Cox | $1,666,001,775 | 33,630,342 | 3.90% | Shares |
| FMR LLC | $1,655,067,134 | 33,383,384 | 3.88% | Shares |
| VANGUARD FIDUCIARY TRUST CO | $1,373,287,136 | 27,709,028 | 3.22% | Shares |
| VANGUARD GROUP INC | $1,320,696,380 | 28,601,979 | 3.10% | Shares |
| ARROWSTREET CAPITAL, LIMITED PARTNERSHIP | $844,223,311 | 17,034,727 | 1.98% | Shares |
| Assenagon Asset Management S.A. | $821,228,336 | 16,536,418 | 1.92% | Shares |
| VANGUARD ASSET MANAGEMENT, Ltd | $734,920,691 | 14,828,609 | 1.72% | Shares |
| Capital World Investors | $720,556,669 | 14,545,505 | 1.69% | Shares |
| CANADA PENSION PLAN INVESTMENT BOARD | $507,140,780 | 10,233,181 | 1.19% | Shares |
| UBS Group AG | $446,744,743 | 9,014,220 | 1.05% | Call option |
| MASSACHUSETTS FINANCIAL SERVICES CO /MA/ | $412,585,986 | 8,452,032 | 0.97% | Shares |
| CAISSE DES DEPOTS ET CONSIGNATIONS | $387,961,036 | 7,812,061 | 0.91% | Shares |
| SIH Partners, LLLP | $369,266,604 | 7,450,900 | 0.87% | Put option |
| Ninety One UK Ltd | $354,252,500 | 7,133,245 | 0.83% | Shares |
| AXA Investment Managers S.A. | $345,537,309 | 3,500,991 | 0.81% | Shares |
| SIH Partners, LLLP | $293,563,704 | 5,923,400 | 0.69% | Call option |
| Bank Julius Baer & Co. Ltd, Zurich | $278,081,947 | 5,601,012 | 0.65% | Shares |
| WCM INVESTMENT MANAGEMENT, LLC | $271,541,342 | 5,486,792 | 0.64% | Shares |
| Qube Research & Technologies Ltd | $271,320,469 | 5,474,754 | 0.64% | Shares |
| M&G PLC | $262,659,383 | 5,307,939 | 0.62% | Shares |
| BNP PARIBAS ASSET MANAGEMENT Holding S.A. | $238,442,469 | 4,811,749 | 0.56% | Shares |
| DIMENSIONAL FUND ADVISORS LP | $225,961,646 | 4,559,356 | 0.53% | Shares |
| GOLDMAN SACHS GROUP INC | $208,984,608 | 4,216,800 | 0.49% | Put option |
| JONES FINANCIAL COMPANIES LLLP | $202,519,514 | 4,125,474 | 0.47% | Shares |
| AVIVA PLC | $182,795,267 | 3,688,297 | 0.43% | Shares |
| ROYAL LONDON ASSET MANAGEMENT LTD | $171,899,455 | 3,468,512 | 0.40% | Shares |
| Clearbridge Investments, LLC | $163,303,670 | 3,295,070 | 0.38% | Shares |
| TD Asset Management Inc | $162,711,041 | 3,276,357 | 0.38% | Shares |
| Public Sector Pension Investment Board | $145,095,820 | 2,926,309 | 0.34% | Shares |
| Liontrust Investment Partners LLP | $122,102,373 | 2,458,659 | 0.29% | Shares |
| VIKING GLOBAL INVESTORS LP | $120,765,283 | 2,435,805 | 0.28% | Shares |
| ASR Vermogensbeheer N.V. | $119,238,983 | 2,401,020 | 0.28% | Shares |
| AMERICAN CENTURY COMPANIES INC | $118,051,127 | 2,381,984 | 0.28% | Shares |
| Korea Investment CORP | $105,825,792 | 2,130,913 | 0.25% | Shares |
| CAPTRUST FINANCIAL ADVISORS | $100,949,347 | 2,036,912 | 0.24% | Shares |
| Life Cycle Investment Partners Ltd | $100,861,379 | 2,031,327 | 0.24% | Shares |
| Generali Asset Management SPA SGR | $99,813,095 | 2,491,590 | 0.23% | Shares |
| Eisler Capital Management Ltd. | $94,791,519 | 2,325,000 | 0.22% | Put option |
| State of Tennessee, Department of Treasury | $92,400,614 | 1,860,583 | 0.22% | Shares |
| MOORE CAPITAL MANAGEMENT, LP | $92,132,547 | 1,858,635 | 0.22% | Shares |
| GOLDMAN SACHS GROUP INC | $91,190,400 | 1,840,000 | 0.21% | Call option |
| BANK OF MONTREAL /CAN/ | $86,447,478 | 1,744,353 | 0.20% | Shares |
| 1832 Asset Management L.P. | $84,103,320 | 1,697,000 | 0.20% | Shares |
| ENVESTNET ASSET MANAGEMENT INC | $83,578,217 | 1,686,431 | 0.20% | Shares |
| BANQUE PICTET & CIE SA | $81,337,319 | 1,637,812 | 0.19% | Shares |
| Nuveen, LLC | $81,145,485 | 1,635,962 | 0.19% | Shares |
| ABN AMRO Bank N.V. | $80,706,517 | 1,630,379 | 0.19% | Shares |
| Vanguard Investments Australia, Ltd. | $80,031,598 | 1,614,810 | 0.19% | Shares |
| Qube Research & Technologies Ltd | $78,460,980 | 1,583,200 | 0.18% | Put option |
| SUSQUEHANNA INTERNATIONAL GROUP, LLP | $66,400,488 | 1,339,800 | 0.16% | Put option |
| Grantham, Mayo, Van Otterloo & Co. LLC | $64,993,247 | 1,308,707 | 0.15% | Shares |
| SEB Asset Management AB | $64,671,634 | 1,302,198 | 0.15% | Shares |
| Vanguard Global Advisers, LLC | $64,520,542 | 1,301,841 | 0.15% | Shares |
| Lansforsakringar Fondforvaltning AB (publ) | $64,322,403 | 1,295,198 | 0.15% | Shares |
| MORGAN STANLEY | $63,172,058 | 1,274,658 | 0.15% | Shares |
| Legal & General Group Plc | $61,274,777 | 1,233,848 | 0.14% | Shares |
| STATE OF WISCONSIN INVESTMENT BOARD | $59,137,132 | 1,190,788 | 0.14% | Shares |
| Rathbones Group PLC | $58,550,716 | 1,179,032 | 0.14% | Shares |
| MANUFACTURERS LIFE INSURANCE COMPANY, THE | $58,193,914 | 1,173,305 | 0.14% | Shares |
| Crocodile Capital Partners GmbH | $57,991,050 | 1,170,000 | 0.14% | Shares |
| Mediolanum International Funds Ltd | $54,941,948 | 1,111,179 | 0.13% | Shares |
| Zurich Insurance Group Ltd/FI | $53,703,954 | 1,083,128 | 0.13% | Shares |
| DJE Kapital AG | $48,950,111 | 983,564 | 0.11% | Shares |
| NORTHERN TRUST CORP | $47,268,841 | 953,770 | 0.11% | Shares |
| Patient Capital Management, LLC | $47,267,108 | 953,734 | 0.11% | Shares |
| Vontobel Holding Ltd. | $45,147,772 | 911,000 | 0.11% | Call option |
| FIL Ltd | $42,944,419 | 866,178 | 0.10% | Shares |
| ALLIANCEBERNSTEIN L.P. | $38,136,266 | 976,101 | 0.09% | Shares |
| GAM Holding AG | $37,856,092 | 762,272 | 0.09% | Shares |
| Quantinno Capital Management LP | $37,381,920 | 754,276 | 0.09% | Shares |
| MACKENZIE FINANCIAL CORP | $35,439,968 | 884,672 | 0.08% | Shares |
| RAYMOND JAMES FINANCIAL INC | $35,277,322 | 711,810 | 0.08% | Shares |
| SUSQUEHANNA INTERNATIONAL GROUP, LLP | $35,128,128 | 708,800 | 0.08% | Call option |
| CITIGROUP INC | $34,599,643 | 696,700 | 0.08% | Put option |
| JANE STREET GROUP, LLC | $34,231,092 | 690,700 | 0.08% | Call option |
| Channing Global Advisors, LLC | $33,390,041 | 672,402 | 0.08% | Shares |
| DZ BANK AG Deutsche Zentral Genossenschafts Bank, Frankfurt am Main | $32,685,803 | 660,095 | 0.08% | Shares |
| ROYAL BANK OF CANADA | $32,531,000 | 656,397 | 0.08% | Shares |
| TWO SIGMA ADVISERS, LP | $31,987,475 | 690,725 | 0.07% | Shares |
| Systrade AG | $31,088,988 | 627,300 | 0.07% | Shares |
| LEVIN CAPITAL STRATEGIES, L.P. | $30,964,345 | 624,785 | 0.07% | Shares |
| GOLDMAN SACHS GROUP INC | $29,290,257 | 591,006 | 0.07% | Shares |
| MILLENNIUM MANAGEMENT LLC | $28,935,464 | 721,900 | 0.07% | Put option |
| Maryland State Retirement & Pension System | $28,367,584 | 572,521 | 0.07% | Shares |
| Fiera Capital Corp | $28,107,508 | 567,141 | 0.07% | Shares |
| MILLENNIUM MANAGEMENT LLC | $26,201,072 | 651,200 | 0.06% | Call option |
| Baker Avenue Asset Management, LP | $25,983,005 | 524,274 | 0.06% | Shares |
| USS Investment Management Ltd | $25,851,639 | 521,574 | 0.06% | Shares |
| PUBLIC EMPLOYEES RETIREMENT SYSTEM OF OHIO | $25,353,905 | 511,580 | 0.06% | Shares |
| O'SHAUGHNESSY ASSET MANAGEMENT, LLC | $25,005,151 | 504,543 | 0.06% | Shares |
| J. Safra Sarasin Holding AG | $24,919,336 | 651,609 | 0.06% | Shares |
| TWO SIGMA INVESTMENTS, LP | $23,556,463 | 475,312 | 0.06% | Shares |
| JANE STREET GROUP, LLC | $22,767,864 | 459,400 | 0.05% | Put option |
Company insiders 1 insider · 0 officers · 0 directors
| Insider | Role | Last activity | Shares owned | Buys 12m | Sells 12m | Net 12m |
|---|---|---|---|---|---|---|
| UBS Group AG | 10% owner | March 1, 2023 J | 0 | 0 | 0 | $0 |
Insiders from SEC Form 3/4/5 filings; net = open-market P/S only
Activists & 5%+ owners 1 position
Investors who filed SEC Schedule 13D — beneficial ownership above 5% with an intent to influence the issuer (activist stakes, board campaigns, M&A). Each row shows the most recent known state of that filer's position.
| Filer | Filed | Stake | Status | Purpose | Filing |
|---|---|---|---|---|---|
| UBS Group AG (2) ×3 filings | Sept. 2, 2015 | — | Initial filing | — | SEC |
Purpose is an automated classification of the filer's own stated purpose (SEC Item 4) — not investment advice. "—" means no clear purpose was stated or the text could not be classified.
ETF ownership Held by 37 ETFs
Weight reflects direct equity holdings (N-PORT) only; leveraged or derivative-based funds may hold additional swap exposure not shown.
| Fund | Weight | Units | As of | Source |
|---|---|---|---|---|
| IDVZ · Elevation Series Trust | 1.66% | 58,662 NS | April 30, 2026 | N-PORT |
| GTOS · Invesco Actively Managed Exchange-T… | 1.48% | 1,845,000 | Aug. 27, 2026 | Daily |
| FFND · Northern Lights Fund Trust II | 1.29% | 28,138 NS | May 31, 2026 | N-PORT |
| TFNS · T. Rowe Price Exchange-Traded Funds… | 0.64% | 1,786 NS | June 30, 2026 | N-PORT |
| AVIV · AMERICAN CENTURY ETF TRUST | 0.61% | 232,055 NS | May 31, 2026 | N-PORT |
| GTO · Invesco Actively Managed Exchange-T… | 0.60% | 18,016,000 | Aug. 27, 2026 | Daily |
| BSCS · Invesco Exchange-Traded Self-Indexe… | 0.59% | 19,950,000 | Aug. 27, 2026 | Daily |
| PICB · Invesco Exchange-Traded Fund Trust … | 0.57% | 2,048,000 | Aug. 27, 2026 | Daily |
| NDOW · Collaborative Investment Series Tru… | 0.56% | 7,895 NS | June 30, 2026 | N-PORT |
| AVDE · AMERICAN CENTURY ETF TRUST | 0.50% | 1,804,126 NS | May 31, 2026 | N-PORT |
| AVSD · AMERICAN CENTURY ETF TRUST | 0.47% | 46,719 NS | May 31, 2026 | N-PORT |
| GSY · Invesco Actively Managed Exchange-T… | 0.39% | 15,000,000 | Aug. 27, 2026 | Daily |
| NUDM · Nushares ETF Trust | 0.30% | 45,841 NS | April 30, 2026 | N-PORT |
| COMT · iShares U.S. ETF Trust | 0.28% | 3,560,000 SH | Aug. 27, 2026 | Daily |
| DFIV · Dimensional ETF Trust | 0.27% | 1,175,053 NS | April 30, 2026 | N-PORT |
| DFSI · Dimensional ETF Trust | 0.26% | 61,685 NS | April 30, 2026 | N-PORT |
| DFIC · Dimensional ETF Trust | 0.20% | 625,218 NS | April 30, 2026 | N-PORT |
| DFAI · Dimensional ETF Trust | 0.20% | 719,314 NS | April 30, 2026 | N-PORT |
| DXIV · Dimensional ETF Trust | 0.14% | 4,537 NS | April 30, 2026 | N-PORT |
| BSCR · Invesco Exchange-Traded Self-Indexe… | 0.14% | 6,281,000 | Aug. 27, 2026 | Daily |
| DFAX · Dimensional ETF Trust | 0.14% | 358,775 NS | April 30, 2026 | N-PORT |
| NEAR · iShares U.S. ETF Trust | 0.11% | 5,870,000 SH | Aug. 27, 2026 | Daily |
| BIV · VANGUARD BOND INDEX FUNDS | — | — | July 15, 2026 | Daily |
| BLV · VANGUARD BOND INDEX FUNDS | — | — | July 15, 2026 | Daily |
| BSV · VANGUARD BOND INDEX FUNDS | — | — | July 15, 2026 | Daily |
| BND · VANGUARD BOND INDEX FUNDS | — | — | July 15, 2026 | Daily |
| VUSB · VANGUARD BOND INDEX FUNDS | — | — | July 15, 2026 | Daily |
| VCRB · VANGUARD MALVERN FUNDS | — | — | July 15, 2026 | Daily |
| VPLS · VANGUARD MALVERN FUNDS | — | — | July 15, 2026 | Daily |
| VSDB · VANGUARD MALVERN FUNDS | — | — | July 15, 2026 | Daily |
| VCSH · VANGUARD SCOTTSDALE FUNDS | — | — | July 15, 2026 | Daily |
| VCIT · VANGUARD SCOTTSDALE FUNDS | — | — | July 15, 2026 | Daily |
| VCLT · VANGUARD SCOTTSDALE FUNDS | — | — | July 15, 2026 | Daily |
| VTC · VANGUARD SCOTTSDALE FUNDS | — | — | July 30, 2026 | Daily |
| BNDW · VANGUARD SCOTTSDALE FUNDS | — | — | July 30, 2026 | Daily |
| BNDX · VANGUARD CHARLOTTE FUNDS | — | — | July 15, 2026 | Daily |
| VCEB · VANGUARD WORLD FUND | — | — | July 30, 2026 | Daily |