
WW WW International, Inc. - Common Stock
NASDAQ · Diversified Consumer Services · SEC EDGAR에서 보기 ↗ 종가 10월 2, 2026 10-K/10-Q 8월 5, 2026WW 주식 스냅샷 가격, 시가총액, P/E, EPS, ROE, 부채/자본, 52주 범위
WW 주가 차트 기술 지표가 포함된 일일 OHLCV — 팬, 확대/축소 및 보기 사용자 정의
막대 세분성은 선택한 기간에 따라 조정됩니다. 막대의 시가/고가/저가/종가를 보려면 차트에 마우스를 올리세요.
WW International, Inc. - Common Stock 정보 위키백과 회사 개요
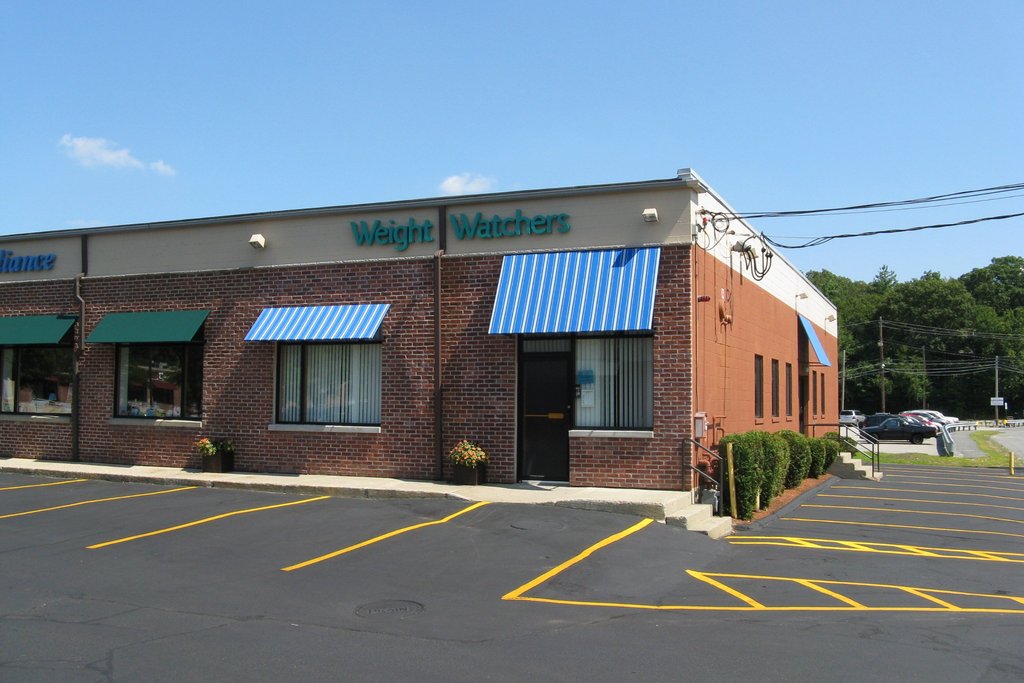
WW International, Inc., formerly Weight Watchers International, Inc., is a global company headquartered in the U.S. that offers weight loss and maintenance, fitness, and mindset services such as the Weight Watchers comprehensive diet program. Founded in 1963 by Queens, New York City homemaker Jean Nidetch, WW's program has three options as of 2019: online via its mobile app and website, coaching online or by phone, or in-person meetings.
In 2018, the company rebranded to "WW" to reflect "its development from focusing on weight loss to overall health and wellness."
Company history
Inception
Weight Watchers was conceived by Jean Nidetch, a housewife and mother living in Queens, New York City, who had been overweight most of her life and had tried pills, hypnosis, and numerous fad diets, all of which only led to regained weight. In 1961, at the age of 38, she weighed 214 pounds and an acquaintance mistook her for being pregnant. She entered a free 10-week weight-loss program sponsored by the New York City Board of Health's obesity clinic. The program was called the "Prudent Diet" and had been developed in the 1950s by Dr. Norman Jolliffe, head of the board's Bureau of Nutrition. The plan included the dictums "No skipping meals. Fish five times a week. Two pieces of bread and two glasses of skim milk a day. More fruits and vegetables." and eating liver once a week. It prohibited alcohol, sweets, and fatty foods, included a list of allowed foods and the quantities allowed, and encouraged weighing portions.
Although Nidetch lost 20 pounds on the ten-week program, she did not like the way the clinic's leader imparted information at the weekly meetings. Discussion was discouraged; in addition, Nidetch's motivation was threatened by her urge to binge on Mallomar cookies. She therefore began a weekly support group in her apartment, initially inviting six overweight friends, which within two months grew to 40 women each week. She introduced the "Prudent Diet", a single page from the New York City Board of Health, to her fellow weight-loss seekers, and the group provided empathy, rapport, mutual understanding, support, and sharing of stories and ideas. The meetings also included a weekly weigh-in, and Nidetch developed a rewards system including prizes for weight-loss milestones. In October 1962, Nidetch achieved her target weight of 142 pounds, and maintained the weight loss; according to her she never exceeded 150 pounds thereafter.
As interest grew, Nidetch coached groups in other neighborhoods. One group was at the home of Al and Felice Lippert, and after the Lipperts successfully lost weight, Al, who was a businessman in the garment industry, talked Nidetch into making a business out of her endeavor.
Launch, IPO, and sale to Heinz
Nidetch and the Lipperts launched Weight Watchers Inc. in Queens in 1963 with Nidetch as president and evangelist. They rented public meeting venues and charged participants $2 per weekly meeting; the first official meeting, in May 1963, attracted 400 attendees. Nidetch led groups and trained others to lead groups as well.
Al Lippert, in charge of the business end of the company, franchised it in 1964, using a razor/razorblade model of an inexpensive franchise fee offered to graduates from the company's programs who had kept the weight off, with 10% of gross earnings as royalties to the parent company. By 1967, the company was international, with 102 franchises in the United States, Canada, Puerto Rico, Great Britain, and Israel.
Felice Lippert was in charge of recipe development, nutrition, and food research; the first Weight Watchers cookbook, published in 1966, sold more than 1.5 million copies. By January 1968, the company had more than one million members worldwide, and, with the help of Matty Simmons' and Leonard Mogel's Twenty First Century Communications, Inc., Weight Watchers Magazine was launched, publishing 300,000 copies of its first issue.
By 1968, the company had 91 franchises in 43 states, and to expand further overseas Al Lippert took the company public as Weight Watchers International Inc.; the initial 225,000 shares, offered at $11.25 a share, began trading enthusiastically, rising to over $30 by the end of the first day. Lippert also initiated lines of Weight Watchers prepared food, spas, camps for overweight kids, and weight-loss products such as scales and travel kits.
Nidetch, with her slim, well-dressed image, charisma, and flair for motivational speaking, remained the public face of the company. In 1970 she published The Memoir of a Successful Loser: The Story of Weight Watchers, which documented the original Weight Watchers plan. In 1973 she resigned as president of the company to devote herself to public relations – traveling, being interviewed, and speaking to large audiences about the program's success.
In the mid-1970s, the company moved away from simply dieting and more toward "eating management", developing tailored options to meet the varying needs of its members, including a specialized food plan for the management of weight-loss plateaus, and a maintenance plan.
In 1975, the publication of Weight Watchers magazine was taken over by Family Media (the publishers of Family Health magazine).
By the late 1970s, the company and its operations and divisions had grown too large and complex for Lippert to manage, and it was sold, along with its food licensees, to the H. J. Heinz Company in 1978 for $72 million. Lippert remained chairman and signed on to remain CEO for a few years, and Nidetch remained in her role as consultant. In the late 1980s, the company's three divisions – support-group meetings division, food line, and publications and media – were still increasingly profitable year-over-year.
Private-equity acquisition and second IPO
In 1990, with competition from Jenny Craig, Slim-Fast, Healthy Choice, and Nutrisystem, earnings began to decline. The Heinz parent company competed by introducing newly developed Weight Watchers "Smart Ones" frozen meals. In 1997, to replace its previous system of counting and weighing food, Weight Watchers introduced the POINTS system, an algorithmic formula which quantifies a food portion for the purposes of healthy weight loss based on carbohydrates, fat, and fiber content.
In 1999, Heinz, while retaining the rights to the Weight Watchers name for use in certain
food categories, sold the company to the private equity firm Artal Luxembourg, for $735 million in a leveraged buyout led by the Invus Group, which manages Artal and which is run by Raymond Debbane. Artal put up $224 million and Weight Watchers financed the rest of the buyout with debt. Debbane became chairman of Weight Watchers. In 2001 Debbane organized an initial public offering for Weight Watchers and took it public again. As of 2018, Artal remains the company's largest shareholder.
In 2000, the new owners reacquired the license to publish Weight Watchers Magazine from Time Inc., where Heinz had offloaded it in 1996 and where it had performed poorly; circulation recovered quickly, and the magazine was redesigned in 2003.
In 2001, the company launched WeightWatchers.com. In 2007, it launched Weight Watchers Online for Men. Competitor Nutrisystem, Inc. also had a men's line.
In late 2010 Weight Watchers overhauled its POINTS system and replaced it with PointsPlus (ProPoints outside the U.S.); under the new system, fruits and non-starchy vegetables were zero points, and processed foods had higher points than they did before.
From 2012 to 2015, although it had its own app and e-tools since 2009, the company faced stiff competition from free smartphone fitness apps, many of which included a social-media group-support system, and from wearable fitness monitors such as Fitbit.
2014–2018
In April of 2014, Tech Crunch leaked Weight Watchers was in talks to acquire virtual fitness training startup Wello. Weight Watchers confirmed the acquisition the following month, which spurred a series of acquisitions in the digital therapeutics space. One year later, in April and May of 2015, Weight Watchers also acquired 5 minute fitness app Hot 5 and the online community and "selfie startup" Weilos. Features of Weilos would later be relaunched as Weight Watcher's Connect product, an online community in-app and on the web.
In October 2015, Oprah Winfrey partnered with Weight Watchers. Winfrey bought a 10% stake in the company, became its spokesperson, joined its board of directors, and lost weight on the program, plus she helped launch a new holistic lifestyle and fitness program called "Beyond the Scale". The late-2015 Oprah effect did not prevent a subsequent downward trend in 2016, largely attributed to challenges from Nutrisystem and the proliferation of free apps and websites aimed at helping people manage their weight, but linked also by some, to a faulty initial tech rollout of the new program's app. CEO James Chambers resigned on September 30, 2016. He was replaced as CEO in July 2017 by Mindy Grossman, who had played a role in growing digital sales revenue for HSN.
In December 2017, the company introduced WW Freestyle (called WW Flex outside the U.S.), which allows people to carry over unused "SmartPoints" through the week, and lists more than 200 zero-points foods, including various lean proteins, that do not need to be tracked. In February 2018 CEO Grossman announced a new direction and purpose for the company: to move beyond mere dieting to being a "partner in health and wellness" and inspiring healthy habits for real life. Subscriptions to Weight Watchers rebounded significantly by mid 2018, credited to Winfrey's influence and to Grossman's tri-fold efforts of revamping the program, improving tech offerings, and giving the company a more broad-based appeal.
In August 2018, the company acquired Kurbo, Inc, rebranding the free mobile app directed at children and teenagers as Kurbo by WW.
In September 2018, the company re-branded itself WW International, Inc., as it shifted its focus more broadly to overall health and wellness, including fitness. It adopted a new tagline, "Wellness that Works". The company stopped requiring users to have a weight loss goal in order to join and renamed its in-person meetings to Wellness Workshops. WW's app was relaunched with features to track other health-related goals. Its FitPoints system has been marketed as allowing individuals to choose activities which have the biggest impact on their health. At that time the company also began a partnership with the meditation app Headspace to offer customized mindfulness content for members.
As part of the rebrand, WW introduced a new program, WellnessWins, that rewarded members for behaviors that encourage healthier habits, which were redeemable for products, services, and experiences. The company also announced Connect, a digital community, which would include micro-community Groups.
Decline and bankruptcy
On April 9, 2025, it was reported that WW was preparing to file for Chapter 11 bankruptcy protection within the coming months, blaming financial challenges and increased competition from weight loss drugs such as Ozempic. The company planned to eliminate most of its debt and sell itself to creditors.
On May 6, 2025, WW filed for Chapter 11 bankruptcy in Delaware, with plans to eliminate most of its $1.5 billion debt in an effort to put itself in a better financial position. The company expected to emerge from bankruptcy within no more than 40 days, or around June 15, 2025, with operations expected to be running normally throughout the procedure. WW was delisted from Nasdaq on May 16, and commenced trading over-the-counter. In early July 2025, WW emerged from bankruptcy and was relisted on the NASDAQ.
Business model
Weight Watchers' business model is one of a subscription-based program of support, plus a variety of purchasable products, media, services, and technologies. Its brand identity has been framed around Weight Watchers being a community, and its website is intrinsic to its effectiveness. Particularly in the 21st century, the company has increasingly marketed itself as a health and wellness brand rather than a weight-loss brand, and its dietary plans emphasize fruits, vegetables, lean proteins, and foods high in whole grains and low in trans fats. Also in the 21st century, the company has increasingly tried to effectively and competitively balance its digital and offline offerings. As of 2019, the program offered weight-loss support via the app and website, in-person workshops and personal coaching.
Products and services
Weight Watchers' primary sources of income are subscriptions to the program.
The company provides a weight-management program (myWW+) and a food plan (SmartPoints); customers can participate in the program via in-person group meetings and/or digitally, and are provided with individualized information, support, and coaching.
It also receives income from Weight Watchers–branded services and products, which include publications such as Weight Watchers magazines, Weight Watchers cookbooks, and food guides and restaurant guides with points values. It sells its own bars and snacks, and licenses the Weight Watchers trademark to a variety of prepared foods, beverages, and other products and services.
Weight-loss plans and formats
The original Weight Watchers dietary plan in the 1960s was roughly based on the "Prudent Diet", developed by Dr. Norman Jolliffe at the New York City Board of Health. It was based around lean meat, fish, skim milk, and fruits and vegetables, and it banned alcohol, sweets, and fatty foods. It had lists of allowed and prohibited foods, and was more structured than subsequent versions of the Weight Watchers program. It recommended weighing food portions, and prohibited skipping meals or counting calories.
The company has regularly changed and updated its diet plans and formats, to reflect current nutritional and obesity science and to accommodate consumer awareness and demand.
In 1979 Weight Watchers introduced PepStep (or Personal Exercise Plan), a walking or stair-climbing exercise program to benefit members' weight loss, developed by a doctor specializing in exercise and cardiac rehabilitation. With this additional element Weight Watchers became one of the first weight-loss companies, along with the Pritikin program, to promote the importance of regular exercise.
By 1980, the company expanded its dietary plan to allow for substitutions and more flexibility. It introduced three routines: a "full choice" plan with the most options; a "limited choice" plan with fewer options and less leeway; and a "no choice" plan with no substitutions and no options, which was the most calorie-restrictive and was to be followed for no more than two weeks.
In 1984 the company added Quick Start, which was a more spartan, temporary eating plan designed to produce faster, motivation-boosting weight loss in the first few weeks of the program. It was the company's first exchange-based diet, where foods within categories could be exchanged for each other. This was expanded in 1986 to Quick Start Plus, with higher-fat options and Personal Choice options.
In 1984 Weight Watchers also launched its At Work program, held for groups of 15 or more in office places, for people who were otherwise unable to attend community meetings. The meetings are held either before work, during the lunch break, or after work, and the fees are usually subsidized by the employer.
In 1988, Weight Watchers launched the Quick Success program, a plan that was easier and more flexible, particularly for working women. It also allowed for a lacto-ovo-vegetarian diet, and increased the minimum daily vegetable intake from two to three.
In 1997 Weight Watchers completely replaced its exchange-based diets with the POINTS system (also originally called 1-2-3 Success), a proprietary algorithmic formula which quantifies a food portion for the purposes of healthy weight loss based on carbohydrates, fat, and fiber content.
In 2000 the company rolled out Winning Points, a more personalized version of the POINTS system, which encompassed self-observation, behavior modification, and fitness and activity, and which did not have any food exclusions.
In 2004, Weight Watchers launched the Turn Around program, which gave people two plans to choose from, and aimed to teach participants how to eat normal food, in sensible portions, and to increase their exercise. The Flex Plan option allowed dieters to eat anything they wanted as long as they stayed within their points allowance; activity points could be earned by exercise. The Core Plan option (later known as "Simply Filling") dispensed with points entirely and included a list of foods that could be eaten "until satisfied", and a list of foods to be avoided.
In December 2008, Weight Watchers eliminated the Core Plan and introduced the Momentum Plan, designed to help members understand how consuming certain filling foods helped them to eat less and prevent overeating.
In late 2010 Weight Watchers overhauled its POINTS system and replaced it with PointsPlus (ProPoints outside the U.S.); under the new system, fruits and non-starchy vegetables are zero points, and processed foods have higher points than they did before.
In December 2012 the company rolled out Weight Watchers 360, which did not change its PointsPlus plan but added behavioral modification and support, mindfulness, control of and planning for one's eating environment, and new apps, and also added an optional wearable fitness monitor to purchase called ActiveLink.
In September 2014, Weight Watchers began syncing its apps with wearable fitness monitors such as Fitbit and Jawbone, so that the activity of members who own those devices is instantly uploaded and tracked and converted to points.
In December 2014, Weight Watchers launched two new services: Personal Coaching and 24/7 Expert Chat. Personal Coaching provides individuals with a Weight Watchers-certified coach who helps them develop an individualized weight management plan and is available via phone, text, and email for subsequent consultations. 24/7 Expert Chat allows members all-hours access to Weight Watchers-certified coaches who can offer instant advice when users encounter weight-loss or dieting crises.
In December 2015 the company rolled out a new holistic lifestyle and fitness program called "Beyond the Scale". The program uses SmartPoints, an updating of the points system which takes into consideration the nutritional value of a food, and helps steer people away from junk foods, sugar, and saturated fat. That same month, the company launched Connect, a social-media platform via its app where members receive support from other members.
In December 2017, Weight Watchers introduced WW Freestyle (called WW Flex outside the U.S.), which allows people to carry over unused points through the week, and lists more than 200 zero-points foods, including various lean proteins, that do not need to be tracked.
In November 2021, WW introduced a new program called PersonalPoints which now uses AI to adjust your points and zero-point food list based on individual preferences. In addition, extra points can now be earned for drinking at least 60 fl oz of water daily and for every cup of non-starchy vegetables.
Reception
As of July 2018, Weight Watchers was the most widely used commercial diet in the world. In addition to the U.S., as of 2018 it had operations in countries including Canada, the UK, Germany, Switzerland, France, Belgium, the Netherlands, Sweden, Australia, New Zealand, and Brazil. Its main long-term competitors in the commercial weight-loss company genre are Jenny Craig and Nutrisystem. Weight Watchers has been included in U.S. News & World Report's rankings for 40 most popular diets and has also been listed as No.1 for weight loss and best commercial diets.
For Weight Watchers customers who choose to attend meetings, in addition to supplying information and lifestyle tips, meetings operate as support groups that provide empathy, rapport, and mutual understanding, as well as positive reinforcement.
Some therapists have said that focusing on counting calories or points, as promoted by WW, can lead to a disordered relationship with food and hunger. Previously the company's prepared foods had been criticized as containing preservatives and other additives; as of late 2018 Weight Watchers has removed all artificial sweeteners, flavors, colors, and preservatives from products carrying the company's name, and dropped or reformulated most of the food products it once produced.
In August 2019, WW released Kurbo by WW, a weight management and health app directed at children and teenagers. It has been criticized by some experts on nutrition and eating disorders for encouraging dieting in children as young as 8. Christy Harrison, a registered dietician, wrote in the New York Times, "programs like this are fertile ground for disordered eating" and that efforts to lose weight "are especially troubling when imposed on children who aren't in a position to make their own choices and who haven't had the opportunity to develop a peaceful relationship with food and their bodies." However, an article in the journal Childhood Obesity concluded that it could be "part of the piece of the puzzle to improving health in youth", despite the authors' concerns with the marketing of the app emphasizing weight loss. An uncontrolled three-month study of the app used by children between 8 and 17 said that it was "highly effective" based on an average reduction in zBMI of 0.26, and a survey of weight management apps published in JMIR mHealth and uHealth noted that of their list, only Kurbo involved health care professionals in its development.
As a result of the release of Kurbo by WW, WW's corporate headquarters in New York City were protested on September 13, 2019, and as of September 2019 a change.org petition asking Weight Watchers to "remove your weight loss app for kids" had over 110,000 signatures.
Leadership and spokespersons
Corporate governance
Weight Watchers' founder Jean Nidetch was the company's President from 1963–1973.
Al Lippert was CEO of Weight Watchers from 1963–1981. From 1978–1999, Weight Watchers was a subsidiary of Heinz. Charles M. Berger was CEO of Weight Watchers from 1982–1994, having previously been its President. Since 1999, the CEOs of Weight Watchers have been: Linda Huett 2000–2006; David Kirchhoff 2007–2013; Jim Chambers 2013–2016; and Mindy Grossman 2017–2022.
Grossman also serves as President and on the board of directors. Since 1999, the chairman of the company has been Raymond Debbane, co-founder and CEO of The Invus Group.
In 2015, Oprah Winfrey purchased a 10 percent ownership stake in WW International and served as a member of the board of directors. In February 2024, she announced that she was leaving WW and would be donating her shares of stock to the National Museum of African American History and Culture.
Spokespersons
Founder Jean Nidetch was the company's public face and spokesperson from its launch in 1963 through 1983. Subsequent spokespersons have included: Lynn Redgrave (1983–1992), Kathleen Sullivan (1994–1995), Sarah, Duchess of York (1997–2007), Greg Grunberg (2007), Tamela Mann (2008–present), Jenny McCarthy (2009), Jennifer Hudson (2010–2014), Charles Barkley (2011–2014), Jessica Simpson (2012–2014), Ana Gasteyer (2013), Oprah Winfrey (2015–2024), DJ Khaled (2018–present), Kate Hudson (2018–present), Kevin Smith (2018–present), and James Corden (2021–2023).
출처: 위키백과 (영어), CC BY-SA 4.0 · 위키백과에서 보기 ↗
10년 성과 매출, 순이익, 마진 및 EPS 추세
가치 평가 P/E, P/S, P/B, EV/EBITDA 비율 — 주식이 비싼가요, 싼가요?
| 지표 | 5년 추세 | WW | 5년 평균 | 동종업계 중앙값 | 결론 |
|---|---|---|---|---|---|
| P/E | 3.9 | · | 11.6 | 저평가 |
동종 기업 중앙값은 지표별로 표준화된 기준으로 계산되며, 이 주식에 표시된 TTM/MRQ 기준과 항상 일치하지 않을 수 있습니다.
수익성 총, 영업 및 순이익률; ROE, ROA, ROIC
이 비율 그룹을 계산하기에 기본 데이터가 아직 충분하지 않습니다.
재무 건전성 부채, 유동성, 지급능력 — 대차대조표 건전성
| 지표 | 5년 추세 | WW | 5년 평균 | 동종업계 중앙값 | 결론 |
|---|---|---|---|---|---|
| 부채 / 자기자본 비율 (MRQ) | 1.55년 평균 ≈-0.9 | ≈-0.9 | 0.9 | 높은 부채 | |
| 유동비율 (MRQ) | 1.45년 평균 ≈1.1 | ≈1.1 | 1.4 | 동일 | |
| Quick Ratio (당좌 비율) | 1.45년 평균 ≈0.9 | ≈0.9 | 0.5 | 강한 유동성 | |
| 장기 부채 / 자기 자본 (MRQ) | 1.55년 평균 ≈-0.9 | ≈-0.9 | 0.9 | 높은 부채 |
성장 매출, EPS 및 순이익 성장률: YoY, 3년 CAGR, 5년 CAGR
| 지표 | 5년 추세 | WW | 5년 평균 | 동종업계 중앙값 | 결론 |
|---|---|---|---|---|---|
| Revenue YoY (매출 YoY) | -11.7%5년 평균 ≈-13.4% | ≈-13.4% | · | · | |
| Revenue CAGR 3Y (매출 CAGR 3년) | -13.4% | · | · | · |
자본 효율성 자산 회전율, 재고 회전율, 매출채권 회전율
| 지표 | 5년 추세 | WW | 5년 평균 | 동종업계 중앙값 | 결론 |
|---|---|---|---|---|---|
| Revenue / Employee (연간 매출액 ÷ 직원 수(yfinance 보고 인원수). 파생 — 저장된 SEC-XBRL 개념이 아님.) | ≈$224.5K | · | · | · |
가치 · ≈ 5년 평균 · 산업 중앙값 · 중앙값 대비 평가
실적 기록 EPS 실제 vs 예상, 서프라이즈 %, 달성률, 다음 실적 발표일
| 기간 | 보고서 | EPS Actual | EPS 예상 | 서프라이즈 |
|---|---|---|---|---|
| 2026년 6월 30일 | 8월 10, 2026 | $1.41 | $0.24 | 482.4% |
| 2026년 3월 31일 | $-5.20 | $-2.52 | -106.3% | |
| 2025년 12월 31일 | $-0.44 | $-1.24 | 64.6% | |
| 2025년 9월 30일 | $-0.44 | $0.06 | -853.4% | |
| 2025년 3월 31일 | $-0.47 | $-0.31 | -52.1% | |
| 2024년 12월 31일 | $0.32 | $0.01 | 3006.8% |
전체 기본 지표 연도별 모든 지표 — 손익계산서, 대차대조표, 현금흐름
손익계산서
| 지표 | 추세 | 2025 | 2024 | 2023 | 2022 | 2021 | 2020 | 2019 | 2018 | 2017 | 2016 | 2015 |
|---|---|---|---|---|---|---|---|---|---|---|---|---|
| Revenue | · | $786M | $890M | $1.04B | $1.21B | $1.38B | $1.41B | $1.51B | $1.31B | $1.16B | $1.16B | |
| Cost of Revenue | · | $253M | $360M | $418M | $484M | $600M | $627M | $648M | $614M | $579M | $112M | |
| Gross Profit | · | $533M | $529M | $621M | $727M | $778M | $787M | $866M | $693M | $586M | $574M | |
| SG&A Expense | · | $176M | $218M | $264M | $269M | $297M | $255M | $251M | $211M | $190M | $205M | |
| Operating Income | · | $-236M | $22M | $-284M | $197M | $216M | $288M | $389M | $267M | $201M | $168M | |
| Interest Expense | · | $111M | $109M | $81M | $88M | $123M | $135M | $142M | $113M | · | · | |
| Other Non-op | · | $1.0K | $-72.0K | $-2M | $-1M | $-349.0K | $-2M | $-3M | $-472.0K | $-2M | $-2M | |
| Pretax Income | · | $-345M | $-74M | $-367M | $77M | $93M | $151M | $244M | $145M | $84M | $56M | |
| Income Tax | · | $526.0K | $39M | $-110M | $10M | $17M | $32M | $20M | $-18M | $17M | $23M | |
| Net Income | · | $-346M | $-112M | $-257M | $67M | $75M | $120M | $224M | $164M | $68M | $33M | |
| EPS (Basic) | · | $-4.34 | $-1.46 | $-3.65 | $0.96 | $1.11 | $1.78 | $3.38 | $2.54 | $1.06 | $0.56 | |
| EPS (Diluted) | · | $-4.34 | $-1.46 | $-3.65 | $0.95 | $1.07 | $1.72 | $3.19 | $2.40 | $1.03 | $0.56 | |
| Shares (Basic) | · | 79,578,000 | 76,677,000 | 70,321,000 | 69,640,000 | 67,849,000 | 67,188,000 | 66,280,000 | 64,329,000 | 63,742,000 | 58,369,000 | |
| Shares (Diluted) | · | 79,578,000 | 76,677,000 | 70,321,000 | 70,744,000 | 70,020,000 | 69,550,000 | 70,115,000 | 68,248,000 | 65,897,000 | 58,966,000 | |
| EBITDA | · | $-236M | $80M | $-234M | $251M | $276M | $342M | $442M | $324M | $260M | $187M |
대차대조표
| 지표 | 추세 | 2025 | 2024 | 2023 | 2022 | 2021 | 2020 | 2019 | 2018 | 2017 | 2016 | 2015 |
|---|---|---|---|---|---|---|---|---|---|---|---|---|
| Cash & Equivalents | $160M | $53M | $109M | $178M | $154M | $166M | $183M | $237M | $83M | $109M | $242M | |
| Receivables | $16M | $14M | $15M | $24M | $29M | $35M | $31M | $27M | $24M | $28M | $29M | |
| Inventory | · | · | $68.0K | $21M | $31M | $39M | $27M | $26M | $32M | $33M | $28M | |
| Prepaid Expense | $13M | $16M | $20M | $31M | $27M | $24M | $31M | $35M | $27M | $31M | $37M | |
| Current Assets | $214M | $103M | $179M | $281M | $271M | $299M | $295M | $366M | $209M | $235M | $351M | |
| PP&E (Net) | $8M | $16M | $20M | $28M | $37M | $52M | $54M | $52M | $48M | $50M | $58M | |
| PP&E (Gross) | $23M | $65M | $73M | $122M | $144M | $178M | $167M | $156M | $142M | $133M | $202M | |
| Accum. Depreciation | $15M | $50M | $54M | $94M | $106M | $126M | $113M | $103M | $94M | $83M | $144M | |
| Goodwill | $200M | $240M | $243M | $156M | $157M | $156M | $158M | $153M | $156M | $166M | $159M | |
| Intangibles | $491M | $116M | · | · | · | · | · | · | · | $59M | $66M | |
| Other Non-current Assets | $15M | $18M | $18M | $15M | $16M | $16M | $12M | $19M | $20M | $13M | $12M | |
| Total Assets | $947M | $550M | $982M | $1.03B | $1.43B | $1.48B | $1.50B | $1.41B | $1.25B | $1.27B | $1.39B | |
| Accounts Payable | $9M | $18M | $19M | $19M | $22M | $23M | $29M | $27M | $24M | $41M | $38M | |
| Current Liabilities | $127M | $173M | $205M | $197M | $229M | $340M | $394M | $341M | $343M | $292M | $503M | |
| Capital Leases | $2M | $44M | $53M | $68M | $78M | $102M | $128M | $0 | · | · | · | |
| Deferred Tax | $34M | $15M | $42M | $25M | $158M | $174M | $175M | $190M | $144M | $175M | $157M | |
| Other Non-current Liabilities | $771.0K | $2M | $16M | $2M | $2M | $5M | $2M | $18M | $30M | $25M | $24M | |
| Total Liabilities | $629M | $1.66B | $1.74B | $1.71B | $1.89B | $2.03B | $2.18B | $2.22B | $2.26B | $2.47B | $2.68B | |
| Long-term Debt | · | $1.43B | $1.43B | $1.42B | $1.42B | $1.49B | $1.61B | $1.78B | $1.86B | $2.02B | $2.23B | |
| Total Debt | $465M | $1.43B | $1.43B | $1.42B | $1.42B | $1.49B | $1.58B | $1.75B | $1.82B | $2.00B | $2.23B | |
| Common Stock | $379M | $0 | $0 | $0 | $0 | $0 | $0 | $0 | $0 | $0 | $0 | |
| Retained Earnings | $-62M | $1.94B | $2.31B | $2.42B | $2.68B | $2.62B | $2.50B | $2.38B | $2.20B | $2.06B | $1.99B | |
| Treasury Stock | · | $3.02B | $3.06B | $3.10B | $3.12B | $3.14B | $3.16B | $3.18B | $3.21B | $3.24B | $3.25B | |
| AOCI | $1M | $-26M | $-11M | $-5M | $-19M | $-25M | $-27M | $-16M | $-10M | $-27M | $-37M | |
| Stockholders' Equity | $318M | $-1.11B | $-761M | $-686M | $-453M | $-548M | $-686M | $-809M | $-1.02B | $-1.21B | $-1.29B | |
| Liabilities + Equity | $947M | $550M | $982M | $1.03B | $1.43B | $1.48B | $1.50B | $1.41B | $1.25B | $1.27B | $1.39B |
현금 흐름
| 지표 | 추세 | 2025 | 2024 | 2023 | 2022 | 2021 | 2020 | 2019 | 2018 | 2017 | 2016 | 2015 |
|---|---|---|---|---|---|---|---|---|---|---|---|---|
| D&A | · | $38M | $57M | $49M | $55M | $60M | $54M | $53M | $57M | $59M | $60M | |
| Stock-based Comp | · | $8M | $15M | $13M | $21M | $55M | $20M | $20M | $15M | $7M | $25M | |
| Deferred Tax | · | $-27M | $20M | $-146M | $-16M | $-1M | $-9M | $-14M | $-48M | $11M | $12M | |
| Amort. of Intangibles | · | $34M | $42M | $34M | $32M | $30M | $29M | $29M | $36M | $36M | $35M | |
| Restructuring | · | · | · | · | · | $33M | $83.0K | · | · | $146.0K | $8M | |
| Other Non-cash | · | · | $26M | $417M | $30M | $-52M | $-3M | $13M | $35M | $-25M | $-33M | |
| Operating Cash Flow | · | $-17M | $7M | $77M | $157M | $136M | $182M | $296M | $222M | $119M | $55M | |
| CapEx | · | $718.0K | $2M | $2M | $2M | $21M | $17M | $19M | $14M | $6M | $4M | |
| Investing Cash Flow | · | $-16M | $-75M | $-43M | $-53M | $-66M | $-53M | $-64M | $-41M | $-38M | · | |
| Debt Issued | · | · | · | · | $1.50B | · | $0 | $0 | $1.84B | $0 | $0 | |
| Net Debt Issued | · | · | · | · | $-64M | $-96M | $-177M | $-58M | $-179M | $-165M | $-158M | |
| Stock Issued | · | · | · | · | · | · | · | · | $0 | $0 | $41M | |
| Net Stock Activity | · | · | · | · | · | · | · | · | $0 | $0 | $41M | |
| Dividends Paid | · | · | · | · | · | · | · | $0 | $0 | $11.0K | $42.0K | |
| Financing Cash Flow | · | $-17M | $-3M | $-5M | $-112M | $-96M | $-183M | $-74M | $-211M | $-212M | · | |
| Net Change in Cash | · | $-53M | $-69M | $25M | $-12M | $-17M | $-54M | $154M | $-26M | $-133M | $-60M | |
| Taxes Paid | · | $11M | $31M | $26M | $41M | $25M | $34M | $12M | $27M | $26M | $26M | |
| Free Cash Flow | · | $-18M | $4M | $75M | $155M | $114M | $165M | $277M | $209M | $113M | $51M | |
| Levered FCF | · | $-127M | $-142M | $19M | $78M | $14M | $58M | · | · | · | · |
수익성
| 지표 | 추세 | 2025 | 2024 | 2023 | 2022 | 2021 | 2020 | 2019 | 2018 | 2017 | 2016 | 2015 |
|---|---|---|---|---|---|---|---|---|---|---|---|---|
| Gross Margin | · | 67.8% | 59.5% | 59.8% | 59.9% | 56.4% | 55.7% | 57.2% | 53.0% | 50.3% | 49.3% | |
| Operating Margin | · | -30.1% | 2.5% | -27.2% | 16.2% | 15.7% | 20.4% | 25.7% | 20.4% | 17.2% | 14.4% | |
| Net Margin | · | -44.0% | -12.6% | -24.1% | 5.5% | 5.5% | 8.5% | 14.8% | 12.5% | 5.8% | 2.8% | |
| Pretax Margin | · | -43.9% | -8.3% | -35.1% | 6.3% | 6.7% | 10.7% | 16.1% | 11.1% | 7.2% | 4.8% | |
| EBITDA Margin | · | -30.1% | 9.0% | -22.5% | 20.7% | 20.0% | 24.2% | 29.2% | 24.8% | 22.3% | 16.0% | |
| ROA | · | -45.1% | -11.2% | -20.5% | 4.6% | 5.0% | 8.2% | 16.8% | 13.0% | 5.1% | 2.2% | |
| ROE | · | 30.8% | 15.6% | 37.5% | -14.1% | -12.2% | -16.0% | -24.5% | -14.7% | -5.4% | -2.5% | |
| ROIC | · | -74.8% | 5.1% | -26.3% | 17.8% | 18.7% | 25.6% | 38.0% | 37.3% | 20.3% | 10.5% |
유동성 및 지급능력
| 지표 | 추세 | 2025 | 2024 | 2023 | 2022 | 2021 | 2020 | 2019 | 2018 | 2017 | 2016 | 2015 |
|---|---|---|---|---|---|---|---|---|---|---|---|---|
| Current Ratio | 1.7 | 0.6 | 0.9 | 1.4 | 1.2 | 0.9 | 0.7 | 1.1 | 0.6 | 0.8 | 0.7 | |
| Quick Ratio | 1.4 | 0.4 | 0.6 | 1.0 | 0.8 | 0.6 | 0.5 | 0.8 | 0.3 | 0.5 | 0.5 | |
| Debt / Equity | 1.5 | -1.3 | -1.9 | -2.1 | -3.1 | -2.7 | -2.3 | -2.2 | -1.8 | -1.7 | -1.7 | |
| LT Debt / Equity | 1.5 | -1.3 | -1.9 | -2.1 | -3.1 | -2.6 | -2.2 | -2.1 | -1.7 | -1.6 | -1.6 | |
| Interest Coverage | · | -2.2 | 0.2 | -3.5 | 2.2 | 1.8 | 2.1 | · | · | · | · |
효율성
| 지표 | 추세 | 2025 | 2024 | 2023 | 2022 | 2021 | 2020 | 2019 | 2018 | 2017 | 2016 | 2015 |
|---|---|---|---|---|---|---|---|---|---|---|---|---|
| Asset Turnover | · | 1.0 | 0.9 | 0.8 | 0.8 | 0.9 | 1.0 | 1.1 | 1.0 | 0.9 | 0.8 | |
| Inventory Turnover | · | · | 35.0 | 16.4 | 13.9 | 18.0 | 23.6 | 22.5 | 4.0 | 3.7 | 3.7 | |
| Receivables Turnover | · | 53.5 | 45.4 | 38.8 | 38.0 | 42.4 | 48.9 | 59.2 | 50.8 | 41.0 | 38.0 |
주당
| 지표 | 추세 | 2025 | 2024 | 2023 | 2022 | 2021 | 2020 | 2019 | 2018 | 2017 | 2016 | 2015 |
|---|---|---|---|---|---|---|---|---|---|---|---|---|
| Revenue / Share | · | $9.88 | $11.60 | $14.80 | $17.14 | $19.68 | $20.32 | $21.59 | $19.15 | $17.68 | $19.75 | |
| Cash Flow / Share | · | $-0.21 | $0.09 | $1.09 | $2.22 | $1.94 | $2.62 | $4.22 | $3.26 | $1.81 | $0.93 | |
| Dividend / Share | · | · | · | · | · | · | · | · | · | · | $0.00 | |
| EPS (TTM) | $7.42 | $-4.34 | $-1.46 | $-3.65 | $0.95 | $1.07 | $1.72 | $3.19 | $2.40 | $1.03 | $0.56 |
성장률
| 지표 | 추세 | 2025 | 2024 | 2023 | 2022 | 2021 | 2020 | 2019 | 2018 | 2017 | 2016 | 2015 |
|---|---|---|---|---|---|---|---|---|---|---|---|---|
| Revenue YoY | · | -11.7% | -14.4% | -14.1% | -12.1% | · | · | · | · | · | · | |
| Revenue CAGR 3Y | · | -13.4% | -13.6% | · | · | · | · | · | · | · | · | |
| EPS YoY | · | · | · | · | -11.2% | · | · | · | · | · | · | |
| Net Income YoY | · | · | · | · | -10.6% | · | · | · | · | · | · |
가치 평가 (TTM)
| 지표 | 추세 | 2025 | 2024 | 2023 | 2022 | 2021 | 2020 | 2019 | 2018 | 2017 | 2016 | 2015 |
|---|---|---|---|---|---|---|---|---|---|---|---|---|
| Revenue TTM | $729M | $786M | $890M | $1.04B | $1.21B | $1.38B | $1.41B | $1.51B | $1.31B | $1.16B | $1.16B | |
| Net Income TTM | $1.01B | $-346M | $-112M | $-257M | $67M | $75M | $120M | $224M | $164M | $68M | $33M | |
| P/E | 3.9 | · | · | · | · | · | · | · | · | · | · | |
| Earnings Yield | 25.4% | · | · | · | · | · | · | · | · | · | · | |
| Payout Ratio | · | · | · | · | · | · | · | 0.00% | 0.00% | 0.02% | 0.13% | |
| Annual Payout | · | · | · | · | · | · | · | $0 | $0 | $11.0K | $42.0K |
손익계산서
| 지표 | 추세 | Q2 2026 | Q1 2026 | Q3 2025 | Q4 2024 | Q3 2024 | Q2 2024 | Q1 2024 | Q4 2023 | Q3 2023 | Q2 2023 | Q4 2022 |
|---|---|---|---|---|---|---|---|---|---|---|---|---|
| Revenue | $162M | $168M | $172M | $184M | $193M | $202M | $207M | $206M | $215M | $242M | $141M | |
| Cost of Revenue | $48M | $50M | $48M | $56M | $63M | $65M | $69M | $81M | $73M | $122M | $56M | |
| Gross Profit | $114M | $119M | $124M | $129M | $129M | $137M | $138M | $125M | $142M | $120M | $85M | |
| SG&A Expense | $50M | $48M | $60M | $12M | $57M | $37M | $59M | $29M | $63M | $60M | $55M | |
| Operating Income | $9M | $-30M | $8M | $36M | $-39M | $36M | $-269M | $-6M | $31M | $-29M | $-309M | |
| Interest Expense | $12M | $12M | $12M | $29M | $29M | $29M | $25M | $37M | $25M | $23M | $14M | |
| Other Non-op | $421.0K | $737.0K | $-342.0K | $4M | $-6M | $78.0K | $2M | $-108.0K | $-815.0K | $330.0K | $29.0K | |
| Pretax Income | $3M | $-41M | $-4M | $13M | $-74M | $7M | $-292M | $-31M | $5M | $-51M | $-323M | |
| Income Tax | $-11M | $11M | $53M | $-12M | $-27M | $-16M | $55M | $58M | $-38M | $68M | $-97M | |
| Net Income | $14M | $-52M | $-58M | $25M | $-46M | $23M | $-348M | $-88M | $44M | $-119M | $-226M | |
| EPS (Basic) | $1.41 | $-5.20 | $-5.76 | $0.34 | $-0.58 | $0.29 | $-4.39 | $-1.14 | $0.55 | $-1.68 | $-3.20 | |
| EPS (Diluted) | $1.41 | $-5.20 | $-5.76 | $0.34 | $-0.58 | $0.29 | $-4.39 | $-1.14 | $0.54 | $-1.68 | $-3.20 | |
| Shares (Basic) | 9,999,000 | 9,996,000 | 9,987,000 | · | 79,732,000 | 79,483,000 | 79,208,000 | · | 78,979,000 | 70,596,000 | · | |
| Shares (Diluted) | 10,001,000 | 9,996,000 | 9,987,000 | · | 79,732,000 | 79,825,000 | 79,208,000 | · | 80,638,000 | 70,596,000 | · | |
| EBITDA | $9M | $-30M | $8M | · | $-39M | $36M | · | · | $47M | $-15M | · |
대차대조표
| 지표 | 추세 | Q2 2026 | Q1 2026 | Q3 2025 | Q4 2024 | Q3 2024 | Q2 2024 | Q1 2024 | Q4 2023 | Q3 2023 | Q2 2023 | Q4 2022 |
|---|---|---|---|---|---|---|---|---|---|---|---|---|
| Cash & Equivalents | $101M | $121M | $170M | $53M | $57M | $43M | $67M | · | $107M | $141M | · | |
| Receivables | $16M | $17M | $15M | $14M | $13M | $13M | $13M | · | $19M | $31M | · | |
| Inventory | · | · | · | · | · | · | · | · | $10M | $11M | · | |
| Prepaid Expense | $14M | $16M | $17M | $16M | $17M | $17M | $20M | · | $28M | $37M | · | |
| Current Assets | $147M | $168M | $219M | $103M | $101M | $88M | $117M | · | $219M | $235M | · | |
| PP&E (Net) | $7M | $7M | $9M | $16M | $17M | $18M | $19M | · | $23M | $26M | · | |
| PP&E (Gross) | · | · | · | $65M | · | · | · | · | · | · | · | |
| Accum. Depreciation | · | · | · | $50M | · | · | · | · | · | · | · | |
| Goodwill | $200M | $200M | $200M | $240M | $243M | $242M | $242M | $243M | $245M | $156M | $156M | |
| Intangibles | $453M | $472M | $508M | $116M | · | · | · | · | · | · | · | |
| Other Non-current Assets | $15M | $15M | $13M | $18M | $18M | $19M | $19M | · | $17M | $14M | · | |
| Total Assets | $840M | $881M | $969M | $550M | $562M | $614M | $654M | · | $1.03B | $974M | · | |
| Accounts Payable | $23M | $17M | $11M | $18M | $17M | $25M | $23M | · | $20M | $22M | · | |
| Current Liabilities | $106M | $141M | $133M | $173M | $189M | $200M | $249M | · | $194M | $267M | · | |
| Capital Leases | $1M | $2M | $2M | $44M | $47M | $49M | $51M | · | $57M | $64M | · | |
| Deferred Tax | $30M | $34M | $44M | $15M | $23M | $22M | $23M | · | $16M | $20M | · | |
| Other Non-current Liabilities | $540.0K | $498.0K | $648.0K | $2M | $2M | $2M | $16M | · | $15M | $2M | · | |
| Total Liabilities | $562M | $616M | $646M | $1.66B | $1.69B | $1.70B | $1.77B | · | $1.71B | $1.78B | · | |
| Long-term Debt | · | $465M | · | · | $1.43B | $1.43B | $1.43B | · | $1.43B | $1.42B | · | |
| Total Debt | $424M | $465M | $465M | · | $1.43B | $1.43B | · | · | $1.43B | · | · | |
| Common Stock | $380M | $379M | $379M | · | $0 | $0 | $0 | · | $0 | $0 | · | |
| Retained Earnings | $-100M | $-114M | $-56M | $1.94B | $1.93B | $1.97B | $1.97B | · | $2.41B | $2.30B | · | |
| Treasury Stock | · | · | · | $3.02B | $3.04B | $3.04B | $3.06B | · | $3.07B | $3.09B | · | |
| AOCI | $-1M | $360.0K | $718.0K | $-26M | $-15M | $-17M | $-17M | · | $-12M | $-8M | · | |
| Stockholders' Equity | $279M | $266M | $323M | $-1.11B | $-1.13B | $-1.09B | $-1.11B | $-761M | $-675M | $-802M | $-686M | |
| Liabilities + Equity | $840M | $881M | $969M | $550M | $562M | $614M | $654M | · | $1.03B | $974M | · | |
| Shares Outstanding | · | · | 9,987,000 | · | · | · | · | · | · | · | · |
현금 흐름
| 지표 | 추세 | Q2 2026 | Q1 2026 | Q3 2025 | Q4 2024 | Q3 2024 | Q2 2024 | Q1 2024 | Q4 2023 | Q3 2023 | Q2 2023 | Q4 2022 |
|---|---|---|---|---|---|---|---|---|---|---|---|---|
| D&A | · | $26M | $27M | $9M | $9M | $10M | $10M | $13M | $16M | $13M | $10M | |
| Stock-based Comp | · | $391.0K | · | $705.0K | $2M | $3M | $2M | $2M | $3M | $3M | $3M | |
| Deferred Tax | · | $-312.0K | $1M | $-11M | $-957.0K | $3M | $-18M | $27M | $-2M | $-3M | $-38M | |
| Amort. of Intangibles | $25M | $25M | $25M | $8M | $8M | $8M | $9M | $10M | $14M | $9M | $9M | |
| Restructuring | · | · | · | · | · | · | · | $24M | $6M | $23M | $17M | |
| Other Non-cash | · | · | · | · | · | · | · | · | · | $79M | · | |
| Operating Cash Flow | · | $-34M | $8M | $5M | $17M | $-2M | $-36M | $8M | $26M | $-27M | $-4M | |
| CapEx | · | · | $6.0K | $120.0K | $-132.0K | $254.0K | $476.0K | $342.0K | $397.0K | $990.0K | $309.0K | |
| Investing Cash Flow | · | $-6M | $-5M | $-3M | $-3M | $-5M | $-5M | $-8M | $-9M | $-10M | $-9M | |
| Financing Cash Flow | · | · | · | $-208.0K | $-3.0K | $-17M | $-616.0K | $-821.0K | $413.0K | $-724.0K | $-3M | |
| Net Change in Cash | · | $-40M | $4M | $-661.0K | $14M | $-24M | $-43M | $2M | $16M | $-37M | $-10M | |
| Free Cash Flow | · | · | $8M | · | · | · | · | · | · | $-28M | · | |
| Levered FCF | · | · | $-151M | · | · | · | · | · | · | $-81M | · |
수익성
| 지표 | 추세 | Q2 2026 | Q1 2026 | Q3 2025 | Q4 2024 | Q3 2024 | Q2 2024 | Q1 2024 | Q4 2023 | Q3 2023 | Q2 2023 | Q4 2022 |
|---|---|---|---|---|---|---|---|---|---|---|---|---|
| Gross Margin | 70.3% | 70.5% | 72.1% | · | 67.1% | 67.9% | · | · | 66.0% | 49.4% | · | |
| Operating Margin | 5.8% | -18.1% | 4.7% | · | -20.2% | 17.8% | · | · | 14.2% | -11.8% | · | |
| Net Margin | 8.7% | -30.9% | -33.4% | · | -23.9% | 11.5% | · | · | 20.3% | -49.1% | · | |
| Pretax Margin | 1.8% | -24.5% | -2.5% | · | -38.1% | 3.7% | · | · | 2.5% | -21.1% | · | |
| EBITDA Margin | 5.8% | -18.1% | 4.7% | · | -20.2% | 17.8% | · | · | 21.8% | -6.3% | · | |
| ROA | 1.5% | -6.6% | -7.5% | · | -5.8% | 2.9% | · | · | 4.1% | · | · | |
| ROE | 4.3% | 11.3% | 14.3% | · | 5.1% | -2.6% | · | · | -6.6% | · | · | |
| ROIC | 6.5% | -5.3% | 13.5% | · | -8.2% | 33.0% | · | · | 33.8% | · | · |
유동성 및 지급능력
| 지표 | 추세 | Q2 2026 | Q1 2026 | Q3 2025 | Q4 2024 | Q3 2024 | Q2 2024 | Q1 2024 | Q4 2023 | Q3 2023 | Q2 2023 | Q4 2022 |
|---|---|---|---|---|---|---|---|---|---|---|---|---|
| Current Ratio | 1.4 | 1.2 | 1.6 | · | 0.5 | 0.4 | · | · | 1.1 | · | · | |
| Quick Ratio | 1.1 | 1.0 | 1.4 | · | 0.4 | 0.3 | · | · | 0.7 | · | · | |
| Debt / Equity | 1.5 | 1.8 | 1.4 | · | -1.3 | -1.3 | · | · | -2.1 | · | · | |
| LT Debt / Equity | 1.5 | 1.7 | 1.4 | · | -1.3 | -1.3 | · | · | -2.1 | · | · | |
| Interest Coverage | 0.8 | -2.5 | 0.7 | · | -1.4 | 1.3 | · | · | 1.2 | -1.3 | · |
효율성
| 지표 | 추세 | Q2 2026 | Q1 2026 | Q3 2025 | Q4 2024 | Q3 2024 | Q2 2024 | Q1 2024 | Q4 2023 | Q3 2023 | Q2 2023 | Q4 2022 |
|---|---|---|---|---|---|---|---|---|---|---|---|---|
| Asset Turnover | 0.2 | 0.2 | 0.2 | · | 0.2 | 0.3 | · | · | 0.2 | · | · | |
| Inventory Turnover | · | · | · | · | · | · | · | · | 4.0 | · | · | |
| Receivables Turnover | 11.7 | 11.0 | 12.5 | · | 12.1 | 10.3 | · | · | 9.1 | · | · |
주당
| 지표 | 추세 | Q2 2026 | Q1 2026 | Q3 2025 | Q4 2024 | Q3 2024 | Q2 2024 | Q1 2024 | Q4 2023 | Q3 2023 | Q2 2023 | Q4 2022 |
|---|---|---|---|---|---|---|---|---|---|---|---|---|
| Book Value / Share | · | · | $32.34 | · | · | · | · | · | · | · | · | |
| Revenue / Share | $16.23 | $16.83 | $17.23 | · | $2.42 | $2.53 | · | · | $2.66 | $3.43 | · | |
| Cash Flow / Share | · | $-3.36 | $0.84 | · | · | · | · | · | · | $-0.38 | · | |
| Cash / Share | · | · | $17.04 | · | · | · | · | · | · | · | · | |
| EPS (TTM) | · | · | $8.34 | · | $-5.82 | $-4.70 | $-4.31 | · | $-3.69 | $-7.91 | · |
가치 평가 (TTM)
| 지표 | 추세 | Q2 2026 | Q1 2026 | Q3 2025 | Q4 2024 | Q3 2024 | Q2 2024 | Q1 2024 | Q4 2023 | Q3 2023 | Q2 2023 | Q4 2022 |
|---|---|---|---|---|---|---|---|---|---|---|---|---|
| Revenue TTM | · | · | $720M | · | $807M | $829M | $854M | · | $824M | $902M | · | |
| Net Income TTM | · | · | $1.09B | · | $-459M | $-369M | $-341M | · | $-250M | $-557M | · | |
| Market Cap | · | · | $273M | · | · | · | · | · | · | · | · | |
| Enterprise Value | · | · | $569M | · | · | · | · | · | · | · | · | |
| P/E | · | · | 3.3 | · | · | · | · | · | · | · | · | |
| P/S | · | · | 0.4 | · | · | · | · | · | · | · | · | |
| P/B | · | · | 0.8 | · | · | · | · | · | · | · | · | |
| P / Cash Flow | · | · | 32.5 | · | · | · | · | · | · | · | · | |
| EV / Revenue | · | · | 0.8 | · | · | · | · | · | · | · | · | |
| Earnings Yield | · | · | 30.5% | · | · | · | · | · | · | · | · |
최신 기간은 왼쪽에 · null 값은 ·로 표시
재무제표 손익계산서, 대차대조표, 현금흐름 — 연간, 지난 5년
| 지표 | 2025-12-31 | 2025-06-24 | 2024-12-28 | 2023-12-30 | 2022-12-31 |
|---|---|---|---|---|---|
| 매출 | · | · | $786M | $890M | $1.04B |
| 매출 총이익률 % | · | · | 67.8% | 59.5% | 59.8% |
| 영업이익률 % | · | · | -30.1% | 2.5% | -27.2% |
| 순이익 | · | · | $-346M | $-112M | $-257M |
| 희석 EPS | · | · | $-4.34 | $-1.46 | $-3.65 |
| 지표 | 2025-12-31 | 2025-06-24 | 2024-12-28 | 2023-12-30 | 2022-12-31 |
|---|---|---|---|---|---|
| 부채 / 자기자본 비율 | 1.5 | · | -1.3 | -1.9 | -2.1 |
| 유동비율 | 1.7 | · | 0.6 | 0.9 | 1.4 |
| 당좌 비율 | 1.4 | · | 0.4 | 0.6 | 1.0 |
| 지표 | 2025-12-31 | 2025-06-24 | 2024-12-28 | 2023-12-30 | 2022-12-31 |
|---|---|---|---|---|---|
| 잉여현금흐름 | · | · | $-18M | $4M | $75M |
기관 투자자 (13F) 85개의 제출자 · $120.3M 전체 · 기준일 2026년 6월 30일
분기별 SEC 양식 13F에서 이 주식을 보유하고 있다고 보고하는 기관. 롱 포지션만 해당하며, 단일 제출자는 별도의 옵션 레그에 대해 두 번 나타날 수 있습니다. 대규모 상쇄 풋/콜 포지션은 일반적으로 방향성에 대한 확신보다는 시장 조성 또는 헤지된 재고를 반영합니다.
| 신규 포지션 | 청산 포지션 | 증가함 | 감소 | 순주식 변동 |
|---|---|---|---|---|
| 11 (-4 이전 분기 대비) | 14 (-10 이전 분기 대비) | 26 (+4 이전 분기 대비) | 19 (-3 이전 분기 대비) | +534K |
Q1 2026 대비 비교. SEC 양식 13F 제출은 분기 말로부터 45일 이내에 마감되며, 지연 제출자를 위한 짧은 유예 기간이 추가됩니다. 해당 기간 내에 있는 분기는 가장 최근에 완전히 보고된 쌍을 선호하여 건너뜁니다.
| 기관 | 가치 | 주식 | % 추적된 13F 중 | 유형 |
|---|---|---|---|---|
| ARISTEIA CAPITAL, L.L.C. | $11,276,127 | 705,640 | 9.38% | 주식 |
| UBS Group AG | $9,066,318 | 567,354 | 7.54% | 주식 |
| MILLENNIUM MANAGEMENT LLC | $8,973,473 | 561,544 | 7.46% | 주식 |
| CARRONADE CAPITAL MANAGEMENT, LP | $7,472,000 | 467,583 | 6.21% | 주식 |
| Fund 1 Investments, LLC | $6,751,023 | 422,467 | 5.61% | 주식 |
| VANGUARD CAPITAL MANAGEMENT LLC | $6,726,861 | 420,955 | 5.59% | 주식 |
| INVESCO SENIOR SECURED MANAGEMENT INC /ADV | $4,989,344 | 170,751 | 4.15% | 주식 |
| BlackRock, Inc. | $4,980,150 | 311,649 | 4.14% | 주식 |
| Contrarius Group Holdings Ltd | $4,908,545 | 307,168 | 4.08% | 주식 |
| PRELUDE CAPITAL MANAGEMENT, LLC | $4,710,009 | 294,744 | 3.92% | 주식 |
| VANGUARD GROUP INC | $4,703,936 | 161,011 | 3.91% | 주식 |
| Western Asset Management Company, LLC | $3,939,539 | 143,989 | 3.28% | 주식 |
| 683 Capital Management, LLC | $3,867,432 | 242,017 | 3.22% | 주식 |
| AEGON USA Investment Management, LLC | $3,677,238 | 230,115 | 3.06% | 주식 |
| JPMORGAN CHASE & CO | $3,209,693 | 195,713 | 2.67% | 주식 |
| Quinn Opportunity Partners LLC | $2,733,091 | 171,032 | 2.27% | 주식 |
| SUSQUEHANNA INTERNATIONAL GROUP, LLP | $2,645,105 | 165,526 | 2.20% | 주식 |
| LANDSCAPE CAPITAL MANAGEMENT, L.L.C. | $2,534,507 | 158,605 | 2.11% | 주식 |
| GUGGENHEIM CAPITAL LLC | $2,460,600 | 153,980 | 2.05% | 주식 |
| WOLVERINE TRADING, LLC | $2,186,252 | 80,200 | 1.82% | 콜 옵션 |
| GEODE CAPITAL MANAGEMENT, LLC | $2,011,720 | 125,823 | 1.67% | 주식 |
| Blue Owl Capital Holdings LP | $1,348,696 | 84,399 | 1.12% | 주식 |
| CHARLES SCHWAB INVESTMENT MANAGEMENT INC | $1,305,726 | 81,710 | 1.09% | 주식 |
| FourWorld Capital Management LLC | $1,246,440 | 78,000 | 1.04% | 주식 |
| VANGUARD FIDUCIARY TRUST CO | $989,050 | 61,893 | 0.82% | 주식 |
| SUSQUEHANNA INTERNATIONAL GROUP, LLP | $984,368 | 61,600 | 0.82% | 콜 옵션 |
| Mount Lucas Management LP | $958,800 | 60,000 | 0.80% | 주식 |
| STATE STREET CORP | $816,530 | 51,097 | 0.68% | 주식 |
| Susquehanna Portfolio Strategies, LLC | $755,790 | 47,296 | 0.63% | 주식 |
| CITADEL ADVISORS LLC | $703,120 | 44,000 | 0.58% | 콜 옵션 |
| MORGAN STANLEY | $662,131 | 41,435 | 0.55% | 주식 |
| Shay Capital LLC | $577,054 | 36,111 | 0.48% | 주식 |
| Balyasny Asset Management L.P. | $502,363 | 31,437 | 0.42% | 주식 |
| Beach Point Capital Management LP | $497,809 | 31,152 | 0.41% | 주식 |
| BRIDGEWAY CAPITAL MANAGEMENT, LLC | $471,666 | 29,516 | 0.39% | 주식 |
| CONTRARIAN CAPITAL MANAGEMENT, L.L.C. | $448,894 | 28,091 | 0.37% | 주식 |
| NORTHERN TRUST CORP | $369,474 | 23,121 | 0.31% | 주식 |
| AMERIPRISE FINANCIAL INC | $363,449 | 22,744 | 0.30% | 주식 |
| ADAR1 Capital Management, LLC | $340,374 | 21,300 | 0.28% | 주식 |
| SIMPLEX TRADING, LLC | $340,326 | 21,297 | 0.28% | 주식 |
| GROUP ONE TRADING LLC | $328,037 | 20,528 | 0.27% | 주식 |
| Invesco Ltd. | $304,691 | 19,067 | 0.25% | 주식 |
| SUSQUEHANNA INTERNATIONAL GROUP, LLP | $298,826 | 18,700 | 0.25% | 풋 옵션 |
| Bank of New York Mellon Corp | $278,664 | 17,438 | 0.23% | 주식 |
| WOLVERINE TRADING, LLC | $234,436 | 8,600 | 0.19% | 풋 옵션 |
| MacKay Shields LLC | $229,649 | 14,371 | 0.19% | 주식 |
| EXCHANGE TRADED CONCEPTS, LLC | $228,067 | 14,272 | 0.19% | 주식 |
| IMC-Chicago, LLC | $170,091 | 10,644 | 0.14% | 주식 |
| CITADEL ADVISORS LLC | $166,192 | 10,400 | 0.14% | 풋 옵션 |
| CVC Management Holdings II Ltd. | $162,101 | 10,144 | 0.13% | 주식 |
행동주의자 및 5% 이상 소유자 6 보유
SEC 서류 13D를 제출한 투자자 — 발행인에 영향을 미치려는 의도로 5% 이상의 실질 소유권(행동주의 지분, 이사회 캠페인, M&A). 각 행은 해당 제출자의 포지션에 대한 가장 최근에 알려진 상태를 보여줍니다.
| 제출자 | 제출됨 | 지분 | 상태 | 목적 | 제출 |
|---|---|---|---|---|---|
| Galloway Capital Partners, LLC, Galloway Capital, LP, GALLOWAY BRUCE ×4 제출 서류 | 2026년 5월 13일 | 8.42% | 최초 제출 | 수동적 투자 | SEC |
| Artal Luxembourg S.A. (2), Artal International S.C.A. (2), Artal International Management S.A. (2), Artal Group S.A. (2), Westend S.A. (2), Stichting Administratiekantoor Westend (2), Mr. Amaury Wittouck (2) ×5 제출 서류 | 2023년 5월 11일 | · | 최초 제출 | · | SEC |
| Oprah Winfrey ×4 제출 서류 | 2020년 5월 8일 | · | 최초 제출 | · | SEC |
| Westend S.A. (2), Stichting Administratiekantoor Westend (2), Mr. Pascal Minne (2), Artal International Management S.A. (2) | 2014년 8월 15일 | · | 최초 제출 | · | SEC |
| Westend S.A., Stichting Administratiekantoor Westend, Mr. Pascal Minne, Artal Holdings Sp. z o.o., Succursale de Luxembourg, Artal International Management S.A. ×9 제출 서류 | 2013년 12월 19일 | · | 최초 제출 | · | SEC |
| 미공개 보고자 | 2006년 3월 15일 | · | 최초 제출 | · | SEC |
Purpose is an automated classification of the filer's own stated purpose (SEC Item 4) — not investment advice. "—" means no clear purpose was stated or the text could not be classified.
회사 내부자 70 명의 내부자 · 34 임원 · 23 이사
| 내부자 | 역할 | 마지막 활동 | 보유 주식 수 | 매수 12개월 | 매도 12개월 | 순매수/매도 12개월 |
|---|---|---|---|---|---|---|
| Tara Comonte | President and CEO | 2025년 12월 18일 A | 4,304 | 0 | 0 | $0 |
| James R Chambers | President and CEO | 2016년 5월 16일 A | 98,847 | 0 | 0 | $0 |
| David Kirchhoff | CEO | 2013년 5월 15일 A | 44,672 | 0 | 0 | $0 |
| Linda Huett | President & CEO | 2005년 8월 16일 G | 92,208 | 0 | 0 | $0 |
| Felicia Dellafortuna | CFO & Member, IOCE | 2026년 5월 22일 P | 1,500 | 1 | 0 | $19,020 |
| Heather Stark | Chief Financial Officer | 2024년 11월 15일 M | 44,282 | 0 | 0 | $0 |
| Amy K O'Keefe | Chief Financial Officer | 2022년 11월 15일 A | 11,293 | 0 | 0 | $0 |
| Ann Sardini | CFO | 2012년 3월 22일 D | 623 | 0 | 0 | $0 |
| Stacey Mowbray | President, North America | 2019년 2월 25일 A | 15,606 | 0 | 0 | $0 |
| Jeanine Lemmens | President, UK | 2016년 4월 1일 M | 6,343 | 0 | 0 | $0 |
| Lesya Lysyj | President, North America | 2014년 11월 25일 M | 368 | 0 | 0 | $0 |
| Bruce Rosengarten | President, Asia Pacific | 2013년 5월 15일 A | 923 | 0 | 0 | $0 |
| Michael Basone | President, WW.com & CTO | 2013년 5월 7일 M | 0 | 0 | 0 | $0 |
| Melanie Stubbing | President, Europe | 2013년 3월 26일 M | 8,203 | 0 | 0 | $0 |
| Steven Mccormick | President, N. America | 2009년 11월 3일 M | 580 | 0 | 0 | $0 |
| Nicholas P Hotchkin | Chief Operating Officer | 2022년 4월 15일 M | 191,578 | 0 | 0 | $0 |
| Richard Mcsorley | COO NACO | 2004년 2월 27일 M | 61,020 | 0 | 0 | $0 |
| Jonathan Volkmann | Chief Ops Off. & Member, IOCE | 2026년 5월 21일 P | 3,196 | 1 | 0 | $15,120 |
| Debra Cotter | Chief Legal Off. & Secretary | 2026년 4월 15일 A | · | 0 | 0 | $0 |
| Nina Ann George | Chief Marketing & CS Officer | 2025년 12월 18일 A | · | 0 | 0 | $0 |
| Helene Causse | Chief Technology Officer | 2025년 12월 18일 A | · | 0 | 0 | $0 |
| Nicole Haag | Corp Controller Prin Acct Off | 2025년 12월 18일 A | 0 | 0 | 0 | $0 |
| Michael Amsel | Chief Marketing Officer | 2025년 6월 24일 M | 3,428 | 0 | 0 | $0 |
| Jacqueline Cooke | Chief Legal Admin. Off. & Sec. | 2025년 6월 24일 M | 295 | 0 | 0 | $0 |
| Donna Boyer | Chief Product Officer | 2024년 5월 15일 A | · | 0 | 0 | $0 |
| Pierre-Olivier Latour | Chief Technology Officer | 2024년 5월 15일 M | 14,620 | 0 | 0 | $0 |
| Amanda Tolleson | Chief Marketing Officer | 2024년 5월 15일 M | 12,579 | 0 | 0 | $0 |
| Michael F Colosi | General Counsel and Secretary | 2023년 12월 1일 S | 0 | 0 | 0 | $0 |
| Michael Lysaght | Chief Technology Officer | 2023년 5월 16일 M | 84,338 | 0 | 0 | $0 |
| Amy Kossover | Chief Accounting Officer | 2023년 5월 16일 M | 26,423 | 0 | 0 | $0 |
| Gail B Tifford | Chief Brand Officer | 2021년 5월 15일 M | 15,061 | 0 | 0 | $0 |
| Jeffrey Fiarman | EVP, General Counsel & Secy | 2013년 3월 26일 M | 12,511 | 0 | 0 | $0 |
| Robert Hollweg | General Counsel & Secretary | 2005년 8월 31일 G | 86,384 | 0 | 0 | $0 |
| Scott Penn | VP Australasia | 2004년 12월 20일 S | 0 | 0 | 0 | $0 |
| Nikolaj H Sjoqvist | 이사 | 2026년 8월 18일 P | 19,620 | 2 | 0 | $195,632 |
| Fallon Julia O'Connor-Brooks | 이사 | 2026년 1월 2일 A | · | 0 | 0 | $0 |
| Michael B Mason | 이사 | 2026년 1월 2일 A | 2,385 | 0 | 0 | $0 |
| Julie Bornstein | 이사 | 2026년 1월 2일 A | 2,918 | 0 | 0 | $0 |
| William H Shrank | 이사 | 2025년 6월 24일 M | 225 | 0 | 0 | $0 |
| Tracey D Brown | 이사 | 2025년 6월 24일 A | 329 | 0 | 0 | $0 |
| Steven Altschuler | 이사 | 2025년 6월 24일 M | 735 | 0 | 0 | $0 |
| Thilo Semmelbauer | 이사 | 2025년 6월 24일 M | 815 | 0 | 0 | $0 |
| Denis F Kelly | 이사 | 2025년 6월 24일 M | 67 | 0 | 0 | $0 |
| Julie J. Rice | 이사 | 2024년 12월 30일 A | 50,899 | 0 | 0 | $0 |
| Jennifer Dulski | 이사 | 2023년 8월 4일 M | 24,874 | 0 | 0 | $0 |
| Christopher J Sobecki | 이사 | 2023년 5월 31일 M | 109,954 | 0 | 0 | $0 |
| Cynthia Elkins | 이사 | 2019년 1월 2일 A | 20,426 | 0 | 0 | $0 |
| Amouyal Philippe | 이사 | 2019년 1월 2일 A | 47,484 | 0 | 0 | $0 |
| Sacha Lainovic | 이사 | 2018년 7월 2일 A | 114,894 | 0 | 0 | $0 |
| Marsha Johnson Evans | 이사 | 2015년 1월 5일 A | 25,619 | 0 | 0 | $0 |
| John F Bard | 이사 | 2013년 9월 30일 A | 14,146 | 0 | 0 | $0 |
| Sam K Reed | 이사 | 2007년 12월 15일 A | 3,184 | 0 | 0 | $0 |
| Sam Reed | 이사 | 2006년 4월 3일 A | 11,457 | 0 | 0 | $0 |
| Artal Holdings Sp. z o.o., Succursale de Luxembourg | 10% 소유주 | 2013년 12월 17일 J | 0 | 0 | 0 | $0 |
| WESTEND SA | 10% 소유주 | 2007년 2월 2일 S | 43,247,893 | 0 | 0 | $0 |
| Luxembourg S A Artal | 10% 소유주 | 2003년 8월 11일 J | 59,772,567 | 0 | 0 | $0 |
| Heather Thiltgen | · | 2026년 8월 10일 A | · | 0 | 0 | $0 |
| Carney Hawks | · | 2026년 8월 10일 A | 51,442 | 3 | 0 | $843,676 |
| Lisa A Gavales | · | 2026년 8월 10일 A | · | 0 | 0 | $0 |
| Sue Gove | · | 2026년 8월 10일 A | · | 0 | 0 | $0 |
| Eugene I Davis | · | 2026년 8월 10일 A | 21,648 | 4 | 0 | $295,882 |
| Sima Sistani | · | 2024년 9월 27일 M | 307,181 | 0 | 0 | $0 |
| WINFREY OPRAH | · | 2024년 5월 9일 A | 5,280 | 0 | 0 | $0 |
| Jonas Fajgenbaum | · | 2023년 5월 9일 A | 98,637 | 0 | 0 | $0 |
| Raymond Debbane | · | 2023년 5월 9일 A | 134,387 | 0 | 0 | $0 |
| Mindy F Grossman | · | 2022년 3월 18일 M | 311,396 | 0 | 0 | $0 |
| Corinne Pollier-Bousquet | · | 2020년 11월 15일 M | 25,891 | 0 | 0 | $0 |
| David A Burwick | · | 2012년 11월 15일 A | 0 | 0 | 0 | $0 |
| Kimberly Roy Tofalli | · | 2012년 7월 2일 A | 8,523 | 0 | 0 | $0 |
| Kevin Eberly | · | 2008년 8월 9일 C | 4,185 | 0 | 0 | $0 |
SEC 양식 3/4/5 제출 서류 기준 내부자; 순매수/매도는 공개 시장 거래만 해당
ETF 보유 현황 7 ETF 보유
가중치는 직접적인 주식 보유(N-PORT)만 반영합니다. 레버리지 또는 파생 상품 기반 펀드는 표시되지 않은 추가 스왑 노출을 보유할 수 있습니다.
| 펀드 | 비중 | 단위 | 기준일 | 출처 |
|---|---|---|---|---|
| IWC · iShares Trust | 0.04% | 34,996 SH | 2026년 9월 10일 | 일간 |
| PRFZ · Invesco Exchange-Traded Fund Trust | 0.02% | 27,165 SH | 2026년 10월 1일 | 일간 |
| DFSV · Dimensional ETF Trust | 0.00% | 9,230 NS | 2026년 7월 31일 | N-PORT |
| DFAS · Dimensional ETF Trust | 0.00% | 2,860 NS | 2026년 7월 31일 | N-PORT |
| VXF · VANGUARD INDEX FUNDS | 0.00% | 113,564 SH | 2026년 8월 19일 | 일간 |
| VTI · VANGUARD INDEX FUNDS | 0.00% | 302,000 SH | 2026년 8월 19일 | 일간 |
| DFAT · Dimensional ETF Trust | 0.00% | 48 NS | 2026년 7월 31일 | N-PORT |
WW 분석가 합의 강세 및 약세 애널리스트 의견, 12개월 목표 주가, 상승 여력
12개월 목표 주가
3 명의 애널리스트 · 2026-09-20평균 목표 $28.33 +92.2%
동종 기업 비교(GICS 하위 산업) 주요 지표 대 섹터 동종 기업
회계연도 기준, 각 회사의 마지막 회계연도 말 종가 기준 가격입니다.
| 티커 | 시가총액 | P/E | 매출 YoY | 순이익률 | ROE | 매출 총이익률 |
|---|---|---|---|---|---|---|
| WW | · | 3.9 | -11.7% | · | · | · |
| DRVN | $2.44B | 17.4 | 6.3% | 7.5% | 18.7% | · |
| MATW | · | -30.7 | -16.6% | -1.6% | -5.5% | 33.9% |
| CSV | $666M | 13.0 | 3.3% | 12.3% | 21.0% | 35.1% |
| RGS | $70M | 11.6 | 6.8% | 3.1% | 3.6% | · |
| BODI | · | -25.3 | -39.9% | -1.1% | -11.1% | 73.0% |
| XWEL | · | -0.1 | -13.8% | · | · | · |
| SCI | $10.89B | 20.5 | 2.9% | 12.6% | 32.7% | 26.5% |
최신 뉴스 이 회사 관련 최근 헤드라인
나의 지표 나만의 관심 목록 — 전체 기본 재무제표에서 선택한 항목
중요한 지표를 선택하세요. 상단의 전체 기본 정보에서 원하는 행 옆의 +를 클릭하세요.
선택 항목이 저장되어 모든 티커에서 유지됩니다.