
CUZ Cousins Properties Incorporated Common Stock
NYSE · Real Estate · Auf SEC EDGAR ansehen ↗ 10-K/10-Q Jul 30, 2026CUZ Aktien-Snapshot Kurs, Marktkapitalisierung, P/E, EPS, ROE, Schulden/Eigenkapital, 52-Wochen-Spanne
CUZ Aktienkurs-Chart Täglich OHLCV mit technischen Indikatoren — Schwenken, Zoom und Ansicht anpassen
Die Balkengranularität passt sich der ausgewählten Periode an – bewegen Sie den Mauszeiger über das Diagramm, um Eröffnungs-/Höchst-/Tiefst-/Schlusskurse für einen Balken anzuzeigen.
| Ex-Datum | Split | Typ |
|---|---|---|
| 17. Juni 2019 | 1-for-4 | Umgekehrt |
| 7. Oktober 2016 | 1417-for-1000 | Vorwärts |
| 3. Oktober 2000 | 3-for-2 | Vorwärts |
| 29. Mai 1987 | 3-for-2 | Vorwärts |
| 28. Mai 1986 | 3-for-2 | Vorwärts |
| 19. Juni 1984 | 5-for-4 | Vorwärts |
| 21. Juni 1983 | 5-for-4 | Vorwärts |
| 30. März 1981 | 5-for-4 | Vorwärts |
| 27. Mai 1980 | 5-for-4 | Vorwärts |
Über Cousins Properties Incorporated Common Stock Unternehmensübersicht von Wikipedia
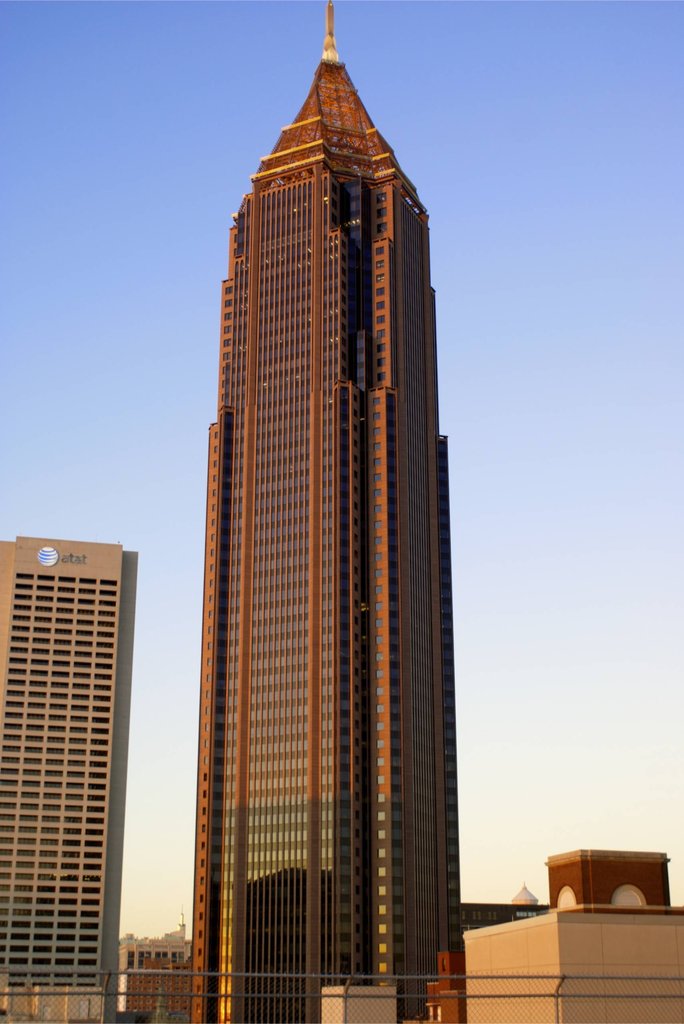
Cousins Properties Incorporated is an American publicly traded real estate investment trust (REIT) that invests in office buildings in Atlanta, Charlotte, Austin, Phoenix, Tampa, and Chapel Hill, North Carolina. The company has developed notable properties including CNN Center, Omni Coliseum, 191 Peachtree Tower, and Emory Point in Atlanta.
As of December 31, 2024, the company owned wholly or through joint ventures 42 properties comprising 20.6 million square feet of office space and 467,000 square feet of other space.
## History
The company was founded in 1958 by Tom Cousins.
In 1962, the company became a public company via an initial public offering.
In 1965, the company built an office building in downtown Atlanta.
In the 1970s, the company expanded into regional malls, real estate finance, and insurance but pared back after the economy softened.
In 1987, Tom Cousins formed the Cousins Foundation and funded it with stock in the company.
In 2002, Thomas Cousins retired from his position as CEO, but remained chairman of the board of directors until the end of 2006, at which time he retired. R. Dary Stone also stepped down from the president and COO positions in 2002.
In 2004, the company partnered with Jim Wilson and Associates, Inc. to develop The Avenue at Carriage Crossing.
In 2016, the company acquired Parkway Properties and spun off its Houston assets into Parkway, Inc.
Quelle: Wikipedia (Englisch), CC BY-SA 4.0 · Auf Wikipedia ansehen ↗
10-Jahres-Performance Umsatz-, Nettoergebnis-, Margen- und EPS-Trends
Bewertung P/E-, P/S-, P/B-, EV/EBITDA-Verhältnisse — ist die Aktie teuer oder günstig?
| Kennzahl | 5-Jahres-Trend | CUZ | 5-Jahres-Durchschnitt | Peer-Median | Fazit |
|---|---|---|---|---|---|
| P/E (TTM) | 721.75-Jahres-Durchschnitt ≈59.6 | ≈59.6 | 35.7 | Überbewertet | |
| P/S (TTM) | 4.65-Jahres-Durchschnitt ≈5.6 | ≈5.6 | 3.8 | Überbewertet | |
| K/B (MRQ) | 1.15-Jahres-Durchschnitt ≈1.0 | ≈1.0 | 1.1 | Fairer Wert | |
| Price / FCF (Kurs / FCF) | 35.9 | · | · | · | |
| Price / Cash Flow (Kurs / Cashflow) | 12.15-Jahres-Durchschnitt ≈12.0 | ≈12.0 | 7.9 | Überbewertet | |
| Price / Tangible Book (Kurs / Materieller Buchwert) | 1.05-Jahres-Durchschnitt ≈1.0 | ≈1.0 | · | · |
Der Median der Vergleichsgruppe wird pro Kennzahl standardisiert berechnet und stimmt möglicherweise nicht immer mit der für diese Aktie angezeigten TTM/MRQ-Basis überein.
Rentabilität Brutto-, Betriebs- und Nettomargen; ROE, ROA, ROIC
| Kennzahl | 5-Jahres-Trend | CUZ | 5-Jahres-Durchschnitt | Peer-Median | Fazit |
|---|---|---|---|---|---|
| Betriebsgewinnmarge (TTM) | 68.0%5-Jahres-Durchschnitt ≈66.3% | ≈66.3% | · | · | |
| EBITDA-Marge (TTM) | 109.1%5-Jahres-Durchschnitt ≈106.5% | ≈106.5% | 33.2% | Spitzenklasse | |
| Nettogewinnmarge (TTM) | 0.62%5-Jahres-Durchschnitt ≈15.7% | ≈15.7% | 7.3% | Spitzenklasse | |
| ROA (TTM) | 0.07%5-Jahres-Durchschnitt ≈1.6% | ≈1.6% | 0.76% | Unterdurchschnittlich | |
| ROE (TTM) | 0.14%5-Jahres-Durchschnitt ≈2.7% | ≈2.7% | 3.1% | Schwach |
Finanzielle Gesundheit Verschuldung, Liquidität, Solvenz — Bilanzstärke
| Kennzahl | 5-Jahres-Trend | CUZ | 5-Jahres-Durchschnitt | Peer-Median | Fazit |
|---|---|---|---|---|---|
| Interest Coverage (Zinsdeckungsgrad) | 4.25-Jahres-Durchschnitt ≈5.6 | ≈5.6 | · | · |
Wachstum Umsatz-, EPS- und Nettoergebniswachstum: YoY, 3-Jahres-CAGR, 5-Jahres-CAGR
| Kennzahl | 5-Jahres-Trend | CUZ | 5-Jahres-Durchschnitt | Peer-Median | Fazit |
|---|---|---|---|---|---|
| Revenue YoY (Umsatz YoY) | 16.0%5-Jahres-Durchschnitt ≈6.2% | ≈6.2% | · | · | |
| Revenue CAGR 3Y (Umsatz CAGR 3J) | 9.2%5-Jahres-Durchschnitt ≈5.4% | ≈5.4% | · | · | |
| Revenue CAGR 5Y (Umsatz CAGR 5J) | 6.1% | · | · | · | |
| EPS YoY (EPS VjV) | -20.0%5-Jahres-Durchschnitt ≈-27.9% | ≈-27.9% | · | · | |
| Net Income YoY (Nettogewinn YoY) | -11.9%5-Jahres-Durchschnitt ≈-25.9% | ≈-25.9% | · | · | |
| EPS CAGR 3Y (EPS CAGR 3J) | -40.0%5-Jahres-Durchschnitt ≈-38.5% | ≈-38.5% | · | · | |
| EPS CAGR 5Y (EPS CAGR 5J) | -31.6% | · | · | · | |
| Net Income CAGR 3Y (Nettoergebnis CAGR 3J) | -37.6%5-Jahres-Durchschnitt ≈-37.4% | ≈-37.4% | · | · | |
| Net Income CAGR 5Y (Nettoergebnis CAGR 5J) | -29.8% | · | · | · |
Kapitaleffizienz Umsatz pro Vermögenswert, Lagerumschlag, Forderungsumschlag
| Kennzahl | 5-Jahres-Trend | CUZ | 5-Jahres-Durchschnitt | Peer-Median | Fazit |
|---|---|---|---|---|---|
| Asset Turnover (Umsatz / Vermögenswerte) | 0.15-Jahres-Durchschnitt ≈0.1 | ≈0.1 | 0.1 | Im Einklang | |
| Revenue / Employee (Umsatz / Mitarbeiter) | ≈$2.8M | · | · | · |
Wert · ≈ 5-Jahres-Durchschnitt · Branchenmedian · Urteil relativ zum Median
Dividenden Rendite, Ausschüttungsquote, Dividendenhistorie, 5-Jahres-CAGR
| Ex-Datum | Betrag | Währung | Rendite |
|---|---|---|---|
| Okt 5, 2026 | $0,32 | USD | ≈4.7% |
| Jul 6, 2026 | $0,32 | USD | ≈4.2% |
| Apr 7, 2026 | $0,32 | USD | ≈5.8% |
| Jan 5, 2026 | $0,32 | USD | ≈5.0% |
| Okt 3, 2025 | $0,32 | USD | ≈4.4% |
| Jul 7, 2025 | $0,32 | USD | ≈4.4% |
| Apr 3, 2025 | $0,32 | USD | ≈4.7% |
| Jan 3, 2025 | $0,32 | USD | ≈4.2% |
| Okt 3, 2024 | $0,32 | USD | ≈4.4% |
| Jul 3, 2024 | $0,32 | USD | ≈5.6% |
| Apr 3, 2024 | $0,32 | USD | ≈5.6% |
| Jan 3, 2024 | $0,32 | USD | ≈5.4% |
| Okt 3, 2023 | $0,32 | USD | ≈6.8% |
| Jul 5, 2023 | $0,32 | USD | ≈5.6% |
| Apr 4, 2023 | $0,32 | USD | ≈6.2% |
| Jan 3, 2023 | $0,32 | USD | ≈5.2% |
| Okt 4, 2022 | $0,32 | USD | ≈5.3% |
| Jul 5, 2022 | $0,32 | USD | ≈4.3% |
| Apr 4, 2022 | $0,32 | USD | ≈3.2% |
| Jan 4, 2022 | $0,31 | USD | ≈3.0% |
Ergebnisverlauf EPS Ist vs. Schätzung, Überraschung %, Beat-Rate, nächstes Ergebnisdatum
| Zeitraum | Bericht | EPS Actual | EPS est. | Überraschung |
|---|---|---|---|---|
| 30. Juni 2026 | Jul 29, 2026 | $0.10 | $0.07 | 41.4% |
| 31. März 2026 | $0.07 | $0.06 | 15.5% | |
| 31. Dezember 2025 | $0.07 | $0.06 | 7.3% | |
| 30. September 2025 | $0.05 | $0.07 | -25.7% | |
| 30. Juni 2025 | $0.09 | $0.07 | 27.3% | |
| 31. März 2025 | $0.12 | $0.13 | -6.2% |
Vollständige Fundamentaldaten Alle Kennzahlen nach Jahr — Gewinn- und Verlustrechnung, Bilanz, Cashflow
Gewinn- und Verlustrechnung
| Kennzahl | Trend | 2025 | 2024 | 2023 | 2022 | 2021 | 2020 | 2019 | 2018 | 2017 | 2016 | 2015 | 2014 |
|---|---|---|---|---|---|---|---|---|---|---|---|---|---|
| Revenue | $994M | $857M | $803M | $762M | $755M | $740M | $658M | $475M | $466M | $259M | $204M | $178M | |
| Cost of Revenue | $314M | $281M | $266M | $258M | $259M | $251M | $222M | $165M | $164M | $97M | · | · | |
| Operating Expenses | $944M | $807M | $722M | $659M | $649M | $646M | $628M | $412M | $429M | $281M | $199M | $188M | |
| Operating Income | $673M | $570M | $531M | $502M | $494M | $486M | $432M | $326M | $313M | $260M | $241M | $216M | |
| Interest Expense | $159M | $122M | $105M | $73M | $67M | $61M | $54M | $39M | $34M | $27M | $23M | $21M | |
| Pretax Income | · | · | · | · | · | · | · | $63M | $40M | $-27M | $6M | $-11M | |
| Income Tax | · | · | · | · | · | · | · | · | · | $0 | $0 | $-20.0K | |
| Net Income | $41M | $46M | $83M | $167M | $279M | $237M | $153M | $81M | $220M | $80M | $126M | $52M | |
| EPS (Basic) | $0.24 | $0.30 | $0.55 | $1.11 | $1.87 | $1.60 | $1.17 | $0.75 | $2.08 | $0.31 | $0.58 | $0.22 | |
| EPS (Diluted) | $0.24 | $0.30 | $0.55 | $1.11 | $1.87 | $1.60 | $1.17 | $0.75 | $2.08 | $0.31 | $0.58 | $0.22 | |
| Shares (Basic) | 167,919,000 | 153,413,000 | 151,714,000 | 150,113,000 | 148,666,000 | 148,277,000 | 128,060,000 | 105,076,000 | 103,902,000 | 253,895,000 | 215,827,000 | 204,216,000 | |
| Shares (Diluted) | 168,716,000 | 154,015,000 | 152,040,000 | 150,419,000 | 148,891,000 | 148,636,000 | 129,831,000 | 106,868,000 | 105,824,000 | 256,023,000 | 215,979,000 | 204,460,000 | |
| EBITDA | $1.09B | $935M | $846M | $798M | $782M | $775M | $689M | $507M | $510M | $358M | $377M | $140M |
Bilanz
| Kennzahl | Trend | 2025 | 2024 | 2023 | 2022 | 2021 | 2020 | 2019 | 2018 | 2017 | 2016 | 2015 | 2014 |
|---|---|---|---|---|---|---|---|---|---|---|---|---|---|
| Cash & Equivalents | $6M | $7M | $6M | $5M | $9M | $4M | $16M | $3M | $149M | $36M | $2M | $0 | |
| Prepaid Expense | $7M | $4M | $9M | $6M | $7M | $6M | $6M | $5M | $4M | $8M | $4M | $3M | |
| Goodwill | $2M | $2M | $2M | $2M | $2M | $2M | $2M | $2M | $2M | $2M | $4M | $4M | |
| Total Assets | $8.89B | $8.80B | $7.63B | $7.54B | $7.31B | $7.11B | $7.15B | $4.15B | $4.20B | $4.17B | $2.60B | $2.67B | |
| Total Liabilities | $4.19B | $3.93B | $3.09B | $2.89B | $2.71B | $2.61B | $2.72B | $1.33B | $1.38B | $1.66B | $912M | $994M | |
| Long-term Debt | $3.34B | $3.10B | $2.46B | $2.33B | $2.24B | $2.16B | $2.22B | $1.06B | $1.09B | $1.38B | $719M | $792M | |
| Common Stock | $168M | $168M | $154M | $154M | $151M | $151M | $149M | $108M | $430M | $404M | $220M | $220M | |
| Treasury Stock | · | $0 | $146M | $147M | $148M | $148M | $148M | $148M | $148M | $148M | $135M | $87M | |
| AOCI | $0 | $-105.0K | $2M | $2M | $0 | · | · | · | · | · | · | · | |
| Stockholders' Equity | $4.68B | $4.85B | $4.52B | $4.63B | $4.57B | $4.47B | $4.36B | $2.77B | $2.77B | $2.46B | $1.68B | $1.67B | |
| Liabilities + Equity | $8.89B | $8.80B | $7.63B | $7.54B | $7.31B | $7.11B | $7.15B | $4.15B | $4.20B | $4.17B | $2.60B | $2.67B | |
| Shares Outstanding | 167,981,990 | 167,660,480 | 151,799,215 | 151,457,190 | 148,688,036 | 151,149,289 | 149,347,382 | · | · | · | · | · |
Cashflow
| Kennzahl | Trend | 2025 | 2024 | 2023 | 2022 | 2021 | 2020 | 2019 | 2018 | 2017 | 2016 | 2015 | 2014 |
|---|---|---|---|---|---|---|---|---|---|---|---|---|---|
| D&A | $415M | $365M | $315M | $296M | $288M | $289M | $257M | $181M | $197M | $98M | $72M | $62M | |
| Stock-based Comp | · | · | · | · | · | · | · | · | · | · | $72.0K | $-550.0K | |
| Deferred Tax | · | · | · | · | · | · | · | · | · | · | $0 | $0 | |
| Amort. of Intangibles | $11M | $13M | $16M | $21M | $33M | $43M | $46M | $27M | $42M | $24M | $24M | $33M | |
| Other Non-cash | $-54M | $-11M | $-29M | $-97M | $-178M | $-176M | $-107M | $-33M | $-205M | $-66M | $-109M | $-50M | |
| Operating Cash Flow | $402M | $400M | $368M | $365M | $389M | $351M | $303M | $229M | $212M | $118M | $154M | $142M | |
| CapEx | $267M | $253M | $280M | $342M | · | · | · | · | · | · | · | · | |
| Investing Cash Flow | $-426M | $-1.31B | $-296M | $-334M | $-191M | $-132M | $-357M | $-284M | $112M | $466M | $35M | $-462M | |
| Stock Issued | $46.0K | $0 | $0 | $103M | $0 | $0 | · | · | $213M | · | · | $322M | |
| Stock Repurchased | · | · | · | · | · | · | · | $0 | $0 | $14M | $48M | $0 | |
| Net Stock Activity | $46.0K | $468M | $0 | $103M | · | · | · | $0 | $213M | $-14M | $-48M | $322M | |
| Dividends Paid | $216M | $195M | $194M | $192M | $183M | $176M | $143M | $107M | $99M | $51M | $69M | $62M | |
| Financing Cash Flow | $22M | $906M | $-72M | $-36M | $-194M | $-230M | $69M | $-148M | $-169M | $-539M | $-188M | $318M | |
| Net Change in Cash | $-2M | $1M | $902.0K | $-5M | $4M | $-11M | $15M | $-203M | $154M | $45M | $1M | $-975.0K | |
| Taxes Paid | · | $0 | $0 | $38.0K | $155.0K | $343.0K | $0 | $0 | $0 | $0 | $2.0K | $4.0K | |
| Free Cash Flow | $135M | $148M | · | · | · | · | · | · | · | · | · | · |
Rentabilität
| Kennzahl | Trend | 2025 | 2024 | 2023 | 2022 | 2021 | 2020 | 2019 | 2018 | 2017 | 2016 | 2015 | 2014 |
|---|---|---|---|---|---|---|---|---|---|---|---|---|---|
| Operating Margin | 67.8% | 66.6% | 66.1% | 65.9% | 65.4% | 65.6% | 65.7% | 68.6% | 67.2% | 100.4% | 63.2% | · | |
| Net Margin | 4.1% | 5.4% | 10.3% | 21.9% | 37.0% | 32.2% | 23.2% | 17.0% | 47.2% | 30.5% | 32.9% | 14.4% | |
| Pretax Margin | · | · | · | · | · | · | · | 13.3% | 8.5% | -10.3% | 9.8% | 2.2% | |
| EBITDA Margin | 109.5% | 109.2% | 105.4% | 104.7% | 103.5% | 104.6% | 104.8% | 106.8% | 109.4% | 138.2% | 98.7% | 38.8% | |
| ROA | 0.46% | 0.56% | 1.1% | 2.2% | 3.9% | 3.3% | 2.7% | 1.9% | 5.2% | 2.3% | · | 2.1% | |
| ROE | 0.85% | 0.98% | 1.8% | 3.6% | 6.2% | 5.4% | 4.3% | 2.9% | 8.4% | 3.8% | · | 3.1% | |
| ROIC | · | · | · | · | · | · | · | · | · | 10.6% | · | · |
Liquidität & Solvenz
| Kennzahl | Trend | 2025 | 2024 | 2023 | 2022 | 2021 | 2020 | 2019 | 2018 | 2017 | 2016 | 2015 | 2014 |
|---|---|---|---|---|---|---|---|---|---|---|---|---|---|
| Interest Coverage | 4.2 | 4.7 | 5.0 | 6.9 | 7.4 | 8.0 | 8.0 | 8.3 | 9.3 | 9.8 | 7.9 | · |
Effizienz
| Kennzahl | Trend | 2025 | 2024 | 2023 | 2022 | 2021 | 2020 | 2019 | 2018 | 2017 | 2016 | 2015 | 2014 |
|---|---|---|---|---|---|---|---|---|---|---|---|---|---|
| Asset Turnover | 0.1 | 0.1 | 0.1 | 0.1 | 0.1 | 0.1 | 0.1 | 0.1 | 0.1 | 0.1 | · | 0.1 |
Pro Aktie
| Kennzahl | Trend | 2025 | 2024 | 2023 | 2022 | 2021 | 2020 | 2019 | 2018 | 2017 | 2016 | 2015 | 2014 |
|---|---|---|---|---|---|---|---|---|---|---|---|---|---|
| Book Value / Share | $27.86 | $28.91 | $29.80 | $30.54 | $30.19 | $29.55 | · | · | · | · | · | · | |
| Revenue / Share | $5.89 | $5.56 | $5.28 | $5.07 | $5.07 | $4.98 | $5.06 | $1.11 | $1.10 | $1.01 | $1.77 | $1.77 | |
| Cash Flow / Share | $2.38 | $2.60 | $2.42 | $2.43 | $2.62 | $2.36 | $2.34 | $0.54 | $0.50 | $0.43 | $0.70 | $0.70 | |
| Cash / Share | $0.03 | $0.04 | $0.04 | $0.03 | $0.06 | $0.03 | · | · | · | · | · | · | |
| Dividend / Share | $1.28 | $1.28 | $1.28 | $1.28 | $1.24 | $1.20 | $1.16 | $1.04 | $1.20 | $0.24 | $0.32 | $0.30 | |
| Dividend Paid / Share | $1.28 | $1.28 | $1.28 | $1.28 | $1.24 | $1.20 | $1.16 | $1.04 | $1.20 | $0.24 | $0.32 | $0.30 | |
| EPS (TTM) | $0.24 | $0.30 | $0.55 | $1.11 | $1.87 | $1.60 | $1.17 | $0.75 | $2.08 | $0.31 | $0.58 | $0.22 |
Wachstumsraten
| Kennzahl | Trend | 2025 | 2024 | 2023 | 2022 | 2021 | 2020 | 2019 | 2018 | 2017 | 2016 | 2015 | 2014 |
|---|---|---|---|---|---|---|---|---|---|---|---|---|---|
| Revenue YoY | 16.0% | 6.7% | 5.3% | 0.96% | 2.0% | · | · | · | · | · | · | · | |
| Revenue CAGR 3Y | 9.2% | 4.3% | 2.7% | · | · | · | · | · | · | · | · | · | |
| Revenue CAGR 5Y | 6.1% | · | · | · | · | · | · | · | · | · | · | · | |
| EPS YoY | -20.0% | -45.5% | -50.4% | -40.6% | 16.9% | · | · | · | · | · | · | · | |
| EPS CAGR 3Y | -40.0% | -45.7% | -29.9% | · | · | · | · | · | · | · | · | · | |
| EPS CAGR 5Y | -31.6% | · | · | · | · | · | · | · | · | · | · | · | |
| Net Income YoY | -11.9% | -44.6% | -50.3% | -40.1% | 17.4% | · | · | · | · | · | · | · | |
| Net Income CAGR 3Y | -37.6% | -45.1% | -29.5% | · | · | · | · | · | · | · | · | · | |
| Net Income CAGR 5Y | -29.8% | · | · | · | · | · | · | · | · | · | · | · | |
| Dividends Paid CAGR 5Y | 4.1% | · | · | · | · | · | · | · | · | · | · | · |
Bewertung (TTM)
| Kennzahl | Trend | 2025 | 2024 | 2023 | 2022 | 2021 | 2020 | 2019 | 2018 | 2017 | 2016 | 2015 | 2014 |
|---|---|---|---|---|---|---|---|---|---|---|---|---|---|
| Revenue TTM | $994M | $857M | $803M | $762M | $755M | $740M | $658M | $475M | $466M | $259M | $204M | $178M | |
| Net Income TTM | $41M | $46M | $83M | $167M | $279M | $237M | $153M | $81M | $220M | $80M | $126M | $52M | |
| Market Cap | $4.33B | $5.14B | $3.70B | $3.83B | $6.09B | $5.06B | · | · | · | · | · | · | |
| P/E | 107.4 | 102.1 | 44.3 | 22.8 | 21.5 | 20.9 | 35.2 | 42.1 | 17.8 | 109.8 | 45.9 | 146.5 | |
| P/S | 4.4 | 6.0 | 4.6 | 5.0 | 8.1 | 6.8 | · | · | · | · | · | · | |
| P/B | 0.9 | 1.1 | 0.8 | 0.8 | 1.3 | 1.1 | · | · | · | · | · | · | |
| P / Tangible Book | 0.9 | 1.1 | 0.8 | 0.8 | 1.3 | 1.1 | · | · | · | · | · | · | |
| P / Cash Flow | 10.8 | 12.8 | 10.0 | 10.5 | 15.6 | 14.4 | · | · | · | · | · | · | |
| P / FCF | 32.1 | 34.8 | · | · | · | · | · | · | · | · | · | · | |
| Dividend Yield | 5.0% | 3.8% | 5.3% | 5.0% | 3.0% | 3.5% | · | · | · | · | · | · | |
| Earnings Yield | 0.93% | 0.98% | 2.3% | 4.4% | 4.6% | 4.8% | 2.8% | 2.4% | 5.6% | 0.91% | 2.2% | 0.68% | |
| Payout Ratio | 532.8% | 425.2% | 234.3% | 115.3% | 65.5% | 74.0% | 93.6% | 132.7% | 45.1% | 63.9% | 55.1% | 118.4% | |
| Annual Payout | $216M | $195M | $194M | $192M | $183M | $176M | $143M | $107M | $99M | $51M | $69M | $62M |
Gewinn- und Verlustrechnung
| Kennzahl | Trend | Q2 2026 | Q1 2026 | Q4 2025 | Q3 2025 | Q2 2025 | Q1 2025 | Q4 2024 | Q3 2024 | Q2 2024 | Q1 2024 | Q4 2023 | Q3 2023 | Q2 2023 | Q1 2023 | Q4 2022 | Q3 2022 |
|---|---|---|---|---|---|---|---|---|---|---|---|---|---|---|---|---|---|
| Revenue | $269M | $263M | $255M | $248M | $240M | $250M | $225M | $209M | $213M | $209M | $197M | $199M | $204M | $203M | $195M | $195M | |
| Cost of Revenue | $85M | $83M | $83M | $80M | $74M | $77M | $73M | $66M | $71M | $71M | $63M | $65M | $67M | $71M | $65M | $67M | |
| Operating Expenses | $249M | $285M | $256M | $237M | $224M | $227M | $210M | $196M | $205M | $196M | $178M | $180M | $182M | $181M | $171M | $171M | |
| Operating Income | $182M | $180M | $172M | $169M | $167M | $165M | $148M | $142M | $141M | $139M | $134M | $135M | $132M | $130M | $130M | $129M | |
| Interest Expense | $47M | $45M | $42M | $41M | $39M | $37M | $33M | $31M | $30M | $29M | $27M | $27M | $26M | $25M | $22M | $18M | |
| Net Income | $26M | $-25M | $-3M | $9M | $14M | $21M | $14M | $11M | $8M | $13M | $19M | $19M | $23M | $22M | $24M | $81M | |
| EPS (Basic) | $0.16 | $-0.15 | $-0.02 | $0.05 | $0.09 | $0.12 | $0.09 | $0.07 | $0.05 | $0.09 | $0.12 | $0.13 | $0.15 | $0.15 | $0.16 | $0.53 | |
| EPS (Diluted) | $0.16 | $-0.15 | $-0.02 | $0.05 | $0.09 | $0.12 | $0.09 | $0.07 | $0.05 | $0.09 | $0.12 | $0.13 | $0.15 | $0.15 | $0.16 | $0.53 | |
| Shares (Basic) | 164,561,000 | 166,399,000 | · | 167,967,000 | 167,930,000 | 167,809,000 | · | 152,140,000 | 152,095,000 | 151,945,000 | · | 151,774,000 | 151,721,000 | 151,579,000 | · | 151,435,000 | |
| Shares (Diluted) | 165,292,000 | 166,399,000 | · | 168,738,000 | 168,765,000 | 168,593,000 | · | 152,812,000 | 152,614,000 | 152,385,000 | · | 152,048,000 | 152,126,000 | 151,880,000 | · | 151,695,000 | |
| EBITDA | $287M | $288M | · | $274M | $268M | $267M | · | $232M | $237M | $225M | · | $214M | $212M | $206M | · | $209M |
Bilanz
| Kennzahl | Trend | Q2 2026 | Q1 2026 | Q4 2025 | Q3 2025 | Q2 2025 | Q1 2025 | Q4 2024 | Q3 2024 | Q2 2024 | Q1 2024 | Q4 2023 | Q3 2023 | Q2 2023 | Q1 2023 | Q4 2022 | Q3 2022 |
|---|---|---|---|---|---|---|---|---|---|---|---|---|---|---|---|---|---|
| Cash & Equivalents | $7M | $6M | $6M | $5M | $417M | $5M | $7M | $76M | $6M | $5M | · | $7M | $8M | $4M | · | $6M | |
| Prepaid Expense | $11M | $12M | $7M | $8M | $11M | $12M | $4M | $9M | $14M | $15M | · | $14M | $17M | $12M | · | $8M | |
| Goodwill | $2M | $2M | $2M | $2M | $2M | $2M | $2M | $2M | $2M | $2M | · | $2M | $2M | $2M | · | $2M | |
| Total Assets | $9.04B | $9.09B | $8.89B | $8.90B | $9.05B | $8.66B | $8.80B | $7.77B | $7.70B | $7.68B | · | $7.59B | $7.60B | $7.58B | · | $7.50B | |
| Total Liabilities | $4.55B | $4.55B | $4.19B | $4.14B | $4.25B | $3.83B | $3.93B | $3.33B | $3.22B | $3.17B | · | $3.01B | $2.99B | $2.96B | · | $2.83B | |
| Long-term Debt | $3.73B | $3.77B | $3.34B | $3.31B | $3.48B | $3.02B | $3.10B | $2.66B | $2.59B | $2.56B | · | $2.42B | $2.42B | $2.45B | · | $2.30B | |
| Common Stock | $165M | $165M | $168M | $168M | $168M | $168M | $168M | $152M | $152M | $152M | · | $154M | $154M | $154M | · | $154M | |
| Treasury Stock | · | · | · | · | · | · | · | $0 | $0 | $0 | · | $147M | $147M | $147M | · | $148M | |
| AOCI | · | · | $0 | $0 | $0 | $0 | $-105.0K | $-102.0K | $3M | $3M | · | $6M | $6M | $537.0K | · | $-652.0K | |
| Stockholders' Equity | $4.48B | $4.51B | $4.68B | $4.73B | $4.78B | $4.81B | $4.85B | $4.42B | $4.45B | $4.49B | · | $4.55B | $4.58B | $4.60B | · | $4.65B | |
| Liabilities + Equity | $9.04B | $9.09B | $8.89B | $8.90B | $9.05B | $8.66B | $8.80B | $7.77B | $7.70B | $7.68B | · | $7.59B | $7.60B | $7.58B | · | $7.50B | |
| Shares Outstanding | 164,602,058 | 164,541,670 | 167,981,990 | 167,965,499 | · | · | 167,660,480 | 152,140,188 | 152,140,188 | 152,071,718 | · | 151,773,774 | 151,774,468 | 151,693,864 | · | 154,019,214 |
Cashflow
| Kennzahl | Trend | Q2 2026 | Q1 2026 | Q4 2025 | Q3 2025 | Q2 2025 | Q1 2025 | Q4 2024 | Q3 2024 | Q2 2024 | Q1 2024 | Q4 2023 | Q3 2023 | Q2 2023 | Q1 2023 | Q4 2022 | Q3 2022 |
|---|---|---|---|---|---|---|---|---|---|---|---|---|---|---|---|---|---|
| D&A | $105M | $108M | $107M | $105M | $101M | $102M | $94M | $90M | $95M | $86M | $79M | $79M | $80M | $76M | $76M | $79M | |
| Amort. of Intangibles | · | · | · | · | · | · | · | · | · | · | · | · | · | $4M | $4M | $6M | |
| Other Non-cash | · | $-43M | · | · | · | $-78M | · | · | · | $-71M | · | · | · | $-71M | · | · | |
| Operating Cash Flow | $157M | $40M | $114M | $120M | $123M | $45M | $129M | $117M | $126M | $28M | $91M | $116M | $135M | $26M | $93M | $115M | |
| Investing Cash Flow | $-36M | $-323M | $-90M | $-310M | $-113M | $87M | $-1.05B | $-73M | $-97M | $-84M | $-84M | $-62M | $-56M | $-94M | $-86M | $-55M | |
| Stock Issued | · | · | $361.0K | $0 | $0 | $-315.0K | $0 | $0 | $0 | $0 | $0 | $0 | · | · | $0 | $1M | |
| Net Stock Activity | · | · | · | · | · | $-315.0K | · | · | · | · | · | · | · | · | · | · | |
| Dividends Paid | $53M | $55M | $54M | $54M | $54M | $55M | $49M | $49M | $49M | $49M | $48M | $49M | $49M | $48M | $48M | $50M | |
| Financing Cash Flow | $-120M | $283M | $-23M | $-223M | $401M | $-134M | $854M | $25M | $-28M | $55M | $-8M | $-55M | $-74M | $66M | $-8M | $-58M | |
| Net Change in Cash | $403.0K | $576.0K | $1M | $-412M | $412M | $-2M | $-69M | $70M | $502.0K | $-595.0K | $-879.0K | $-1M | $4M | $-2M | $-2M | $1M | |
| Taxes Paid | $0 | $0 | · | $0 | $0 | $0 | · | $0 | $0 | $0 | · | $0 | $0 | $0 | $38.0K | $0 |
Rentabilität
| Kennzahl | Trend | Q2 2026 | Q1 2026 | Q4 2025 | Q3 2025 | Q2 2025 | Q1 2025 | Q4 2024 | Q3 2024 | Q2 2024 | Q1 2024 | Q4 2023 | Q3 2023 | Q2 2023 | Q1 2023 | Q4 2022 | Q3 2022 |
|---|---|---|---|---|---|---|---|---|---|---|---|---|---|---|---|---|---|
| Operating Margin | 67.9% | 68.4% | · | 68.1% | 69.4% | 66.0% | · | 67.9% | 66.3% | 66.2% | · | 67.8% | 64.5% | 64.2% | · | 66.3% | |
| Net Margin | 9.7% | -9.4% | · | 3.5% | 6.0% | 8.3% | · | 5.3% | 3.7% | 6.3% | · | 9.7% | 11.1% | 10.9% | · | 41.3% | |
| EBITDA Margin | 106.9% | 109.6% | · | 110.5% | 111.4% | 106.8% | · | 110.8% | 111.1% | 107.5% | · | 107.8% | 103.8% | 101.6% | · | 106.8% | |
| ROA | 0.29% | -0.28% | · | 0.10% | 0.17% | 0.26% | · | 0.15% | 0.10% | 0.17% | · | 0.26% | 0.30% | 0.30% | · | 1.1% | |
| ROE | 0.56% | -0.53% | · | 0.19% | 0.31% | 0.45% | · | 0.25% | 0.17% | 0.29% | · | 0.42% | 0.49% | 0.49% | · | 1.8% |
Liquidität & Solvenz
| Kennzahl | Trend | Q2 2026 | Q1 2026 | Q4 2025 | Q3 2025 | Q2 2025 | Q1 2025 | Q4 2024 | Q3 2024 | Q2 2024 | Q1 2024 | Q4 2023 | Q3 2023 | Q2 2023 | Q1 2023 | Q4 2022 | Q3 2022 |
|---|---|---|---|---|---|---|---|---|---|---|---|---|---|---|---|---|---|
| Interest Coverage | 3.9 | 4.0 | · | 4.1 | 4.3 | 4.5 | · | 4.6 | 4.8 | 4.8 | · | 5.0 | 5.1 | 5.2 | · | 7.0 |
Effizienz
| Kennzahl | Trend | Q2 2026 | Q1 2026 | Q4 2025 | Q3 2025 | Q2 2025 | Q1 2025 | Q4 2024 | Q3 2024 | Q2 2024 | Q1 2024 | Q4 2023 | Q3 2023 | Q2 2023 | Q1 2023 | Q4 2022 | Q3 2022 |
|---|---|---|---|---|---|---|---|---|---|---|---|---|---|---|---|---|---|
| Asset Turnover | 0.0 | 0.0 | · | 0.0 | 0.0 | 0.0 | · | 0.0 | 0.0 | 0.0 | · | 0.0 | 0.0 | 0.0 | · | 0.0 |
Pro Aktie
| Kennzahl | Trend | Q2 2026 | Q1 2026 | Q4 2025 | Q3 2025 | Q2 2025 | Q1 2025 | Q4 2024 | Q3 2024 | Q2 2024 | Q1 2024 | Q4 2023 | Q3 2023 | Q2 2023 | Q1 2023 | Q4 2022 | Q3 2022 |
|---|---|---|---|---|---|---|---|---|---|---|---|---|---|---|---|---|---|
| Book Value / Share | $27.24 | $27.41 | · | $28.19 | · | · | · | $29.03 | $29.27 | $29.53 | · | $30.01 | $30.19 | $30.32 | · | $30.16 | |
| Revenue / Share | $1.62 | $1.58 | · | $1.47 | $1.42 | $1.48 | · | $1.37 | $1.40 | $1.37 | · | $1.31 | $1.34 | $1.33 | · | $1.29 | |
| Cash Flow / Share | · | $0.24 | · | · | · | $0.27 | · | · | · | $0.19 | · | · | · | $0.17 | · | · | |
| Cash / Share | $0.04 | $0.04 | · | $0.03 | · | · | · | $0.50 | $0.04 | $0.04 | · | $0.05 | $0.05 | $0.02 | · | $0.04 | |
| Dividend / Share | · | · | · | · | · | · | · | · | · | · | $0.32 | $0.32 | $0.32 | $0.32 | $0.32 | $0.32 | |
| Dividend Paid / Share | $0.32 | $0.32 | $0.32 | $0.32 | $0.32 | $0.32 | $0.32 | $0.32 | $0.32 | $0.32 | $0.32 | $0.32 | $0.32 | $0.32 | · | · | |
| EPS (TTM) | $0.04 | $-0.03 | · | $0.35 | $0.37 | $0.33 | · | $0.33 | $0.39 | $0.49 | · | $0.59 | $0.99 | $1.07 | · | $2.07 |
Bewertung (TTM)
| Kennzahl | Trend | Q2 2026 | Q1 2026 | Q4 2025 | Q3 2025 | Q2 2025 | Q1 2025 | Q4 2024 | Q3 2024 | Q2 2024 | Q1 2024 | Q4 2023 | Q3 2023 | Q2 2023 | Q1 2023 | Q4 2022 | Q3 2022 |
|---|---|---|---|---|---|---|---|---|---|---|---|---|---|---|---|---|---|
| Revenue TTM | $1.03B | $1.01B | · | $964M | $925M | $898M | · | $828M | $818M | $809M | · | $800M | $797M | $778M | · | $758M | |
| Net Income TTM | $6M | $-5M | · | $58M | $60M | $54M | · | $51M | $59M | $74M | · | $88M | $150M | $161M | · | $310M | |
| Market Cap | $4.93B | $3.71B | · | $4.86B | · | · | · | $4.49B | $3.52B | $3.66B | · | $3.09B | $3.46B | $3.24B | · | $3.60B | |
| P/E | 749.5 | -752.3 | · | 82.7 | 81.2 | 89.4 | · | 89.3 | 59.4 | 49.1 | · | 34.5 | 23.0 | 20.0 | · | 11.3 | |
| P/S | 4.8 | 3.7 | · | 5.0 | · | · | · | 5.4 | 4.3 | 4.5 | · | 3.9 | 4.3 | 4.2 | · | 4.7 | |
| P/B | 1.1 | 0.8 | · | 1.0 | · | · | · | 1.0 | 0.8 | 0.8 | · | 0.7 | 0.8 | 0.7 | · | 0.8 | |
| P / Tangible Book | 1.1 | 0.8 | · | 1.0 | · | · | · | 1.0 | 0.8 | 0.8 | · | 0.7 | 0.8 | 0.7 | · | 0.8 | |
| P / Cash Flow | · | 91.8 | · | · | · | · | · | · | · | 129.2 | · | · | · | 122.4 | · | · | |
| Dividend Yield | 4.4% | 5.8% | · | 4.3% | · | · | · | 4.3% | 5.5% | 5.3% | · | 6.3% | 5.7% | 6.0% | · | 5.3% | |
| Earnings Yield | 0.13% | -0.13% | · | 1.2% | 1.2% | 1.1% | · | 1.1% | 1.7% | 2.0% | · | 2.9% | 4.3% | 5.0% | · | 8.9% | |
| Payout Ratio | · | -222.5% | · | · | · | 261.1% | · | · | · | 365.6% | · | · | · | 218.1% | · | · | |
| Annual Payout | $215M | $217M | · | $211M | $206M | $201M | · | $195M | $195M | $195M | · | $194M | $196M | $195M | · | $190M |
Aktuellster Zeitraum links · fehlende Werte werden als · angezeigt
Finanzberichte Gewinn- und Verlustrechnung, Bilanz, Cashflow — jährlich, letzte 5 Jahre
| Kennzahl | 2025-12-31 | 2024-12-31 | 2023-12-31 | 2022-12-31 | 2021-12-31 |
|---|---|---|---|---|---|
| Umsatz | $994M | $857M | $803M | $762M | $755M |
| Betriebsgewinnmarge % | 67.8% | 66.6% | 66.1% | 65.9% | 65.4% |
| Nettoergebnis | $41M | $46M | $83M | $167M | $279M |
| Verwässerte EPS | $0.24 | $0.30 | $0.55 | $1.11 | $1.87 |
Noch nicht genügend Fundamentaldaten vorhanden, um diese Aufstellung zu erstellen.
| Kennzahl | 2025-12-31 | 2024-12-31 | 2023-12-31 | 2022-12-31 | 2021-12-31 |
|---|---|---|---|---|---|
| Freier Cashflow | $135M | $148M | · | · | · |
Institutionelle Eigentümer (13F) 428 Einreicher · $5.7B gesamt · Stand 30. September 2026
Institutionen, die diese Aktie in ihrer vierteljährlichen SEC-Formular 13F melden. Nur Long-Positionen; ein einzelner Einreicher kann für separate Optionsscheine zweimal erscheinen. Große gegenläufige Put/Call-Positionen spiegeln typischerweise Market-Making oder abgesicherte Bestände wider, nicht die gerichtete Überzeugung.
| Neue Positionen | Geschlossene Positionen | Erhöht | Abgenommen | Nettoveränderung der Aktien |
|---|---|---|---|---|
| 64 (-16 vs. Vorquartal) | 38 (-4 vs. Vorquartal) | 136 (-3 vs. Vorquartal) | 140 (+34 vs. Vorquartal) | +2.3M |
Verglichen mit Q1 2026. SEC-Formular 13F-Einreichungen sind innerhalb von 45 Tagen nach Quartalsende fällig, zuzüglich einer kurzen Pufferzeit für verspätete Einreicher — Quartale, die noch in diesem Fenster liegen, werden zugunsten des letzten vollständig berichteten Paares übersprungen.
| Institution | Wert | Aktien | % der verfolgten 13F | Typ |
|---|---|---|---|---|
| BlackRock, Inc. | $701.495.123 | 23.398.770 | 12,21% | Aktien |
| VANGUARD GROUP INC | $643.540.030 | 24.962.763 | 11,20% | Aktien |
| VANGUARD PORTFOLIO MANAGEMENT LLC | $484.813.715 | 16.171.238 | 8,44% | Aktien |
| PRINCIPAL FINANCIAL GROUP INC | $382.153.734 | 12.746.779 | 6,65% | Aktien |
| STATE STREET CORP | $239.141.597 | 7.976.148 | 4,16% | Aktien |
| APG Asset Management US Inc. | $224.459.390 | 7.323.308 | 3,91% | Aktien |
| VANGUARD CAPITAL MANAGEMENT LLC | $222.227.080 | 7.412.511 | 3,87% | Aktien |
| MASSACHUSETTS FINANCIAL SERVICES CO /MA/ | $165.345.698 | 5.282.664 | 2,88% | Aktien |
| CENTERSQUARE INVESTMENT MANAGEMENT LLC | $129.388.134 | 4.315.815 | 2,25% | Aktien |
| MILLENNIUM MANAGEMENT LLC | $112.048.331 | 3.737.436 | 1,95% | Aktien |
| GEODE CAPITAL MANAGEMENT, LLC | $102.968.013 | 3.433.772 | 1,79% | Aktien |
| Quantinno Capital Management LP | $95.940.631 | 3.200.154 | 1,67% | Aktien |
| Invesco Ltd. | $95.426.088 | 3.182.992 | 1,66% | Aktien |
| CHARLES SCHWAB INVESTMENT MANAGEMENT INC | $91.923.986 | 3.066.177 | 1,60% | Aktien |
| JENNISON ASSOCIATES LLC | $89.836.358 | 2.996.543 | 1,56% | Aktien |
| Alyeska Investment Group, L.P. | $72.931.986 | 2.432.688 | 1,27% | Aktien |
| DIMENSIONAL FUND ADVISORS LP | $71.508.390 | 2.385.153 | 1,24% | Aktien |
| DUFF & PHELPS INVESTMENT MANAGEMENT CO | $71.406.814 | 2.381.815 | 1,24% | Aktien |
| JPMORGAN CHASE & CO | $62.351.497 | 2.060.892 | 1,08% | Aktien |
| AQR CAPITAL MANAGEMENT LLC | $58.666.091 | 1.956.841 | 1,02% | Aktien |
| NORGES BANK | $53.839.433 | 1.795.845 | 0,94% | Aktien |
| NORTHERN TRUST CORP | $52.703.970 | 1.757.971 | 0,92% | Aktien |
| CBRE INVESTMENT MANAGEMENT LISTED REAL ASSETS LLC | $49.053.816 | 1.636.218 | 0,85% | Aktien |
| GOLDMAN SACHS GROUP INC | $48.207.929 | 1.608.003 | 0,84% | Aktien |
| MORGAN STANLEY | $47.397.441 | 1.580.966 | 0,82% | Aktien |
| CITADEL ADVISORS LLC | $46.118.504 | 1.538.309 | 0,80% | Aktien |
| Bank of New York Mellon Corp | $41.742.542 | 1.392.346 | 0,73% | Aktien |
| BNP PARIBAS ASSET MANAGEMENT Holding S.A. | $40.476.298 | 1.350.110 | 0,70% | Aktien |
| BANK OF AMERICA CORP /DE/ | $39.710.181 | 1.324.556 | 0,69% | Aktien |
| DEUTSCHE BANK AG\ | $33.098.339 | 1.104.014 | 0,58% | Aktien |
| TWO SIGMA INVESTMENTS, LP | $32.689.023 | 1.090.361 | 0,57% | Aktien |
| ARROWSTREET CAPITAL, LIMITED PARTNERSHIP | $32.317.720 | 1.077.976 | 0,56% | Aktien |
| VANGUARD FIDUCIARY TRUST CO | $31.250.732 | 1.042.386 | 0,54% | Aktien |
| CORDA Investment Management, LLC. | $29.054.662 | 1.051.182 | 0,51% | Aktien |
| Legal & General Group Plc | $27.298.918 | 910.571 | 0,48% | Aktien |
| ADAGE CAPITAL PARTNERS GP, L.L.C. | $24.733.500 | 825.000 | 0,43% | Aktien |
| Heitman Real Estate Securities LLC | $24.243.507 | 808.656 | 0,42% | Aktien |
| AMERIPRISE FINANCIAL INC | $23.800.745 | 793.887 | 0,41% | Aktien |
| DEPRINCE RACE & ZOLLO INC | $23.169.230 | 838.250 | 0,40% | Aktien |
| UBS Group AG | $22.825.632 | 761.362 | 0,40% | Aktien |
| HSBC HOLDINGS PLC | $21.995.487 | 733.672 | 0,38% | Aktien |
| State of Tennessee, Department of Treasury | $20.130.581 | 671.467 | 0,35% | Aktien |
| Boston Partners | $18.953.377 | 627.477 | 0,33% | Aktien |
| RENAISSANCE TECHNOLOGIES LLC | $18.900.321 | 630.431 | 0,33% | Aktien |
| Jain Global LLC | $18.555.491 | 618.929 | 0,32% | Aktien |
| KENNEDY CAPITAL MANAGEMENT LLC | $18.489.356 | 616.723 | 0,32% | Aktien |
| JANE STREET GROUP, LLC | $17.928.490 | 598.015 | 0,31% | Aktien |
| Creative Planning | $17.231.681 | 574.773 | 0,30% | Aktien |
| Davis Selected Advisers | $17.196.678 | 573.605 | 0,30% | Aktien |
| Russell Investments Group, Ltd. | $15.620.574 | 521.005 | 0,27% | Aktien |
Aktivisten & 5%+-Eigentümer 1 Beteiligung
Investoren mit SEC Schedule 13D — wirtschaftliches Eigentum über 5% mit der Absicht, Einfluss auf den Emittenten zu nehmen (aktivistische Beteiligungen, Board-Kampagnen, M&A). Jede Zeile zeigt den zuletzt bekannten Stand der Position dieses Melders.
| Anmelder | Eingereicht | Beteiligung | Status | Zweck | Einreichung |
|---|---|---|---|---|---|
| TPG Group Holdings (SBS) Advisors, Inc., TPG Advisors VI, Inc., David Bonderman, James G. Coulter ×2 Einreichungen | 28. Februar 2017 | · | Erste Einreichung | Kapitalstruktur | SEC |
Purpose is an automated classification of the filer's own stated purpose (SEC Item 4) — not investment advice. "—" means no clear purpose was stated or the text could not be classified.
Unternehmensinsider 45 Insider · 18 Führungskräfte · 24 Direktoren
| Insider | Rolle | Letzte Aktivität | Gehaltene Aktien | Käufe 12m | Verkäufe 12m | Netto 12m |
|---|---|---|---|---|---|---|
| Michael Colin Connolly | President & CEO | 17. Februar 2026 F | 548.025 | 0 | 0 | $0 |
| Thomas D Bell JR | Chairman and CEO | 5. Juni 2009 A | 18.442 | 0 | 0 | $0 |
| Gregg D Adzema | EVP and CFO | 17. Februar 2026 F | 175.561 | 0 | 0 | $0 |
| James A Fleming | EVP and CFO | 17. Dezember 2010 A | 5.095 | 0 | 0 | $0 |
| Jeffrey D Symes | SVP, Chief Accounting Officer | 20. August 2026 S | 16.685 | 0 | 1 | $-177.612 |
| Jane Kennedy Hicks | EVP, Chief Investment Officer | 17. Februar 2026 F | 107.572 | 0 | 0 | $0 |
| Pamela F Roper | EVP, General Counsel | 17. Februar 2026 F | 82.284 | 0 | 0 | $0 |
| Richard G Hickson IV | Executive Vice President | 17. Februar 2026 F | 98.980 | 0 | 0 | $0 |
| John D Harris Jr | Senior Vice President | 10. Februar 2020 M | 11.113 | 0 | 0 | $0 |
| James T Ellis | SVP | 14. Februar 2014 F | 26.256 | 0 | 0 | $0 |
| Michael I Cohn | EVP | 14. Februar 2013 F | 23.345 | 0 | 0 | $0 |
| Robert M Jackson | Senior Vice President | 16. Februar 2012 M | 30.347 | 0 | 0 | $0 |
| Craig B Jones | Executive Vice President | 16. Februar 2012 M | 123.865 | 0 | 0 | $0 |
| Steven V Yenser | EVP | 18. Juni 2010 A | 725 | 0 | 0 | $0 |
| Daniel M Dupree | Vice Chairman | 16. Februar 2009 A | 54.224 | 0 | 0 | $0 |
| Bruce E Smith | Senior Vice President | 11. Dezember 2008 M | 23.956 | 0 | 0 | $0 |
| Joel T Murphy | Executive Vice President | 11. Dezember 2008 M | 41.968 | 0 | 0 | $0 |
| Forrest W Robinson | SVP-President Industrial Div. | 11. Dezember 2007 M | 9.761 | 0 | 0 | $0 |
| Dionne Nelson | Direktor | 1. Juni 2026 A | 28.943 | 0 | 0 | $0 |
| Donna Westbrook Hyland | Direktor | 1. Juni 2026 A | 76.893 | 0 | 0 | $0 |
| Susan Givens | Direktor | 1. Juni 2026 A | 18.725 | 0 | 0 | $0 |
| Kent R Griffin Jr | Direktor | 1. Juni 2026 A | 87.329 | 0 | 0 | $0 |
| Scott W Fordham | Direktor | 1. Juni 2026 A | 140.246 | 0 | 0 | $0 |
| Dary R Stone | Direktor | 1. Juni 2026 A | 98.523 | 0 | 0 | $0 |
| Robert M Chapman | Direktor | 1. Juni 2026 A | 82.204 | 0 | 0 | $0 |
| CANNADA CHARLES T | Direktor | 1. Juni 2026 A | 76.440 | 0 | 0 | $0 |
| Lillian C Giornelli | Direktor | 31. Mai 2024 A | 65.179 | 0 | 0 | $0 |
| Lawrence L Gellerstedt III | Direktor | 10. Februar 2020 M | 163.027 | 0 | 0 | $0 |
| Edward Manuel Casal | Direktor | 31. Mai 2019 A | 93.183 | 0 | 0 | $0 |
| Taylor S Glover | Direktor | 31. Mai 2019 A | 537.933 | 0 | 0 | $0 |
| Brenda J Mixson | Direktor | 31. Mai 2017 A | 76.494 | 0 | 0 | $0 |
| Tom G Charlesworth | Direktor | 31. Mai 2016 A | 60.030 | 0 | 0 | $0 |
| James H Hance JR | Direktor | 31. Mai 2016 A | 93.768 | 0 | 0 | $0 |
| James D Edwards | Direktor | 2. Juni 2014 A | 40.024 | 0 | 0 | $0 |
| PAYNE WILLIAM PORTER | Direktor | 24. Dezember 2013 S | 85.726 | 0 | 0 | $0 |
| Erskine B Bowles | Direktor | 1. Juni 2011 M | 35.328 | 0 | 0 | $0 |
| William B Harrison JR | Direktor | 1. Juni 2011 M | 29.308 | 0 | 0 | $0 |
| Boone A Knox | Direktor | 31. März 2010 M | 53.126 | 0 | 0 | $0 |
| Richard W Courts II | Direktor | 14. Mai 2007 A | 94.317 | 0 | 0 | $0 |
| John J Mack | Direktor | 10. Mai 2005 A | 46.672 | 0 | 0 | $0 |
| Hugh L Mccoll JR | Direktor | 10. Mai 2005 A | 7.681 | 0 | 0 | $0 |
| John S Mccoll | · | 17. Februar 2026 F | 93.516 | 0 | 0 | $0 |
| Thomas G Cousins | · | 22. September 2014 P | 6.299.598 | 0 | 0 | $0 |
| Terence C Golden | · | 17. August 2004 A | 14.846 | 0 | 0 | $0 |
| Michael A Quinlan | · | 10. Dezember 2003 A | 936 | 0 | 0 | $0 |
Insider aus SEC-Einreichungen Form 3/4/5; Netto = nur P/S aus offenen Märkten
ETF-Besitz Gehalten von 64 ETFs
Gewichtung spiegelt nur direkte Aktienbestände (N-PORT) wider; gehebelte oder derivatbasierte Fonds können zusätzliche Swap-Exposure halten, die hier nicht angezeigt wird.
| Fonds | Gewicht | Anteile | Stand | Quelle |
|---|---|---|---|---|
| SRHR · Elevation Series Trust | 4,21% | 72.500 NS | 31. Juli 2026 | N-PORT |
| FMTM · EA Series Trust | 3,20% | 255.618 NS | 31. Juli 2026 | N-PORT |
| JRE · Janus Detroit Street Trust | 1,94% | 2.580 NS | 31. Juli 2026 | N-PORT |
| DPRE · Virtus ETF Trust II | 1,44% | 1.817 NS | 31. Juli 2026 | N-PORT |
| ERTH · Invesco Exchange-Traded Fund Trust | 0,78% | 32.192 | 23. Oktober 2026 | Täglich |
| GQRE · FlexShares Trust | 0,64% | 86.840 NS | 31. Juli 2026 | N-PORT |
| RFV · Invesco Exchange-Traded Fund Trust | 0,59% | 69.235 | 23. Oktober 2026 | Täglich |
| ERET · iShares Trust | 0,40% | 1.917 SH | 11. September 2026 | Täglich |
| USRT · iShares Trust | 0,39% | 624.423 SH | 11. September 2026 | Täglich |
| DFAR · Dimensional ETF Trust | 0,39% | 219.237 NS | 31. Juli 2026 | N-PORT |
| IYR · iShares Trust | 0,35% | 508.317 SH | 11. September 2026 | Täglich |
| FREL · FIDELITY COVINGTON TRUST | 0,34% | 159.511 NS | 31. Juli 2026 | N-PORT |
| IQRA · New York Life Investments Active ET… | 0,31% | 671 NS | 31. Juli 2026 | N-PORT |
| FNK · First Trust Exchange-Traded AlphaDE… | 0,30% | 21.615 NS | 31. Juli 2026 | N-PORT |
| IVOV · VANGUARD ADMIRAL FUNDS | 0,28% | 141.315 SH | 19. August 2026 | Täglich |
| VNQ · VANGUARD SPECIALIZED FUNDS | 0,26% | 6.325.094 SH | 19. August 2026 | Täglich |
| DFGR · Dimensional ETF Trust | 0,26% | 316.535 NS | 31. Juli 2026 | N-PORT |
| REET · iShares Trust | 0,26% | 445.105 SH | 11. September 2026 | Täglich |
| BKSE · BNY Mellon ETF Trust | 0,23% | 6.287 NS | 31. Juli 2026 | N-PORT |
| JPME · J.P. Morgan Exchange-Traded Fund Tr… | 0,22% | 31.892 NS | 31. Juli 2026 | N-PORT |
| HSMV · First Trust Exchange-Traded Fund III | 0,20% | 2.179 NS | 31. Juli 2026 | N-PORT |
| BBSC · J.P. Morgan Exchange-Traded Fund Tr… | 0,19% | 41.811 NS | 31. Juli 2026 | N-PORT |
| RDIV · Invesco Exchange-Traded Fund Trust … | 0,18% | 92.015 | 23. Oktober 2026 | Täglich |
| QVMM · Invesco Exchange-Traded Fund Trust … | 0,16% | 23.156 | 23. Oktober 2026 | Täglich |
| FNX · First Trust Exchange-Traded AlphaDE… | 0,16% | 68.714 NS | 31. Juli 2026 | N-PORT |
| EQAL · Invesco Exchange-Traded Fund Trust … | 0,15% | 43.752 | 23. Oktober 2026 | Täglich |
| PTMC · Pacer Funds Trust | 0,15% | 18.083 NS | 31. Juli 2026 | N-PORT |
| BSCU · Invesco Exchange-Traded Self-Indexe… | 0,13% | 3.784.000 | 23. Oktober 2026 | Täglich |
| IVOO · VANGUARD ADMIRAL FUNDS | 0,13% | 265.496 SH | 19. August 2026 | Täglich |
| MIDU · Direxion Shares ETF Trust | 0,11% | 2.416 NS | 31. Juli 2026 | N-PORT |
| VBR · VANGUARD INDEX FUNDS | 0,10% | 2.390.824 SH | 19. August 2026 | Täglich |
| FAB · First Trust Exchange-Traded AlphaDE… | 0,09% | 4.779 NS | 31. Juli 2026 | N-PORT |
| PFIG · Invesco Exchange-Traded Fund Trust … | 0,08% | 100.000 | 23. Oktober 2026 | Täglich |
| ESML · iShares Trust | 0,07% | 67.863 SH | 11. September 2026 | Täglich |
| SMMD · iShares Trust | 0,06% | 87.877 SH | 11. September 2026 | Täglich |
| VXF · VANGUARD INDEX FUNDS | 0,06% | 1.887.348 SH | 19. August 2026 | Täglich |
| VB · VANGUARD INDEX FUNDS | 0,06% | 3.768.670 SH | 19. August 2026 | Täglich |
| IWS · iShares Trust | 0,04% | 242.250 SH | 11. September 2026 | Täglich |
| WSML · iShares Trust | 0,04% | 10.120 SH | 11. September 2026 | Täglich |
| RWK · Invesco Exchange-Traded Fund Trust … | 0,04% | 19.371 | 23. Oktober 2026 | Täglich |
| IWR · iShares Trust | 0,03% | 670.979 SH | 11. September 2026 | Täglich |
| PRF · Invesco Exchange-Traded Fund Trust | 0,02% | 64.166 | 23. Oktober 2026 | Täglich |
| IUSV · iShares Trust | 0,01% | 142.492 SH | 11. September 2026 | Täglich |
| IWD · iShares Trust | 0,01% | 361.929 SH | 11. September 2026 | Täglich |
| VTI · VANGUARD INDEX FUNDS | 0,01% | 5.228.921 SH | 19. August 2026 | Täglich |
| VONE · VANGUARD SCOTTSDALE FUNDS | 0,01% | 26.557 SH | 19. August 2026 | Täglich |
| VONV · VANGUARD SCOTTSDALE FUNDS | 0,01% | 98.598 SH | 19. August 2026 | Täglich |
| VTHR · VANGUARD SCOTTSDALE FUNDS | 0,01% | 13.633 SH | 19. August 2026 | Täglich |
| ESGV · VANGUARD WORLD FUND | 0,01% | 36.780 SH | 19. August 2026 | Täglich |
| TILT · FlexShares Trust | 0,01% | 6.640 NS | 31. Juli 2026 | N-PORT |
| IWB · iShares Trust | 0,01% | 115.212 SH | 11. September 2026 | Täglich |
| IYY · iShares Trust | 0,01% | 7.128 SH | 10. September 2026 | Täglich |
| ITOT · iShares Trust | 0,01% | 217.000 SH | 11. September 2026 | Täglich |
| IWV · iShares Trust | 0,01% | 44.307 SH | 11. September 2026 | Täglich |
| DEUS · DBX ETF Trust | 0,00% | 410 NS | 31. August 2026 | N-PORT |
| GTO · Invesco Actively Managed Exchange-T… | 0,00% | 117.000 | 22. Oktober 2026 | Täglich |
| DIVB · iShares Trust | 0,00% | 1.699 SH | 11. September 2026 | Täglich |
| VT · VANGUARD INTERNATIONAL EQUITY INDEX… | 0,00% | 126.789 SH | 19. August 2026 | Täglich |
| IJH · iShares Trust | · | 5.770.363 SH | 11. September 2026 | Täglich |
| IJJ · iShares Trust | · | 838.991 SH | 21. August 2026 | Täglich |
| XJH · iShares Trust | · | 22.606 SH | 8. September 2026 | Täglich |
| ISCB · iShares Trust | · | 6.907 SH | 11. September 2026 | Täglich |
| ISCV · iShares Trust | · | 34.207 SH | 11. September 2026 | Täglich |
| SMLF · iShares Trust | · | 97.347 SH | 11. September 2026 | Täglich |
CUZ Analysten-Konsens Bullische und bärische Analystenmeinungen, 12-Monats-Kursziel, Aufwärtspotenzial
12-Monats-Kursziel
11 Analysten · 2026-10-21Mittelwert-Ziel $33.36 +15,6%
Peer-Vergleich (GICS-Subbranche) Wichtige Kennzahlen im Vergleich zu Branchenkollegen
FY-Basis, Kurse zum Schlusskurs am Ende des letzten Geschäftsjahres jedes Unternehmens.
| Ticker | Marktkapitalisierung | P/E | Umsatz Vj. | Nettomarge | ROE | Bruttogewinnmarge |
|---|---|---|---|---|---|---|
| CUZ | $4.33B | 107.4 | 16.0% | 4.1% | 0.85% | · |
| BXP | $10.70B | 38.8 | 2.2% | 8.0% | 5.2% | 59.1% |
| CDP | $3.15B | 20.7 | 1.4% | 20.9% | 10.6% | · |
| VNO | $6.35B | 7.9 | 1.3% | 50.0% | 16.2% | · |
| KRC | $4.42B | 16.1 | -2.0% | 27.2% | 5.6% | · |
| SLG | $3.26B | -28.5 | 13.2% | -9.7% | -2.5% | · |
| HIW | $2.84B | 17.8 | -2.4% | 20.2% | 6.9% | · |
| DEI | $1.84B | 122.1 | 1.8% | 1.6% | 0.82% | 63.3% |
| PDM | $1.04B | -12.4 | -0.93% | -14.8% | -5.4% | · |
| DEA | $981M | 78.5 | 11.3% | 3.9% | 0.98% | · |
| ESRT | · | 26.1 | 0.05% | 9.5% | 7.0% | · |
Meine Kennzahlen Ihre persönliche Watchlist — ausgewählte Zeilen aus den vollständigen Fundamentaldaten
Wählen Sie die Kennzahlen, die für Sie wichtig sind — klicken Sie auf das + neben jeder Zeile in den vollständigen Fundamentaldaten oben.
Ihre Auswahl wird gespeichert und begleitet Sie über alle Ticker hinweg.