
ENB Enbridge Inc Common Stock
NYSE · Energy · 在 SEC EDGAR 上查看 ↗ 收盘 十月 2, 2026 10-K/10-Q 七月 31, 2026ENB 股票快照 价格、市值、P/E、EPS、ROE、负债/权益、52周范围
ENB 股价图表 包含技术指标的日 OHLCV — 平移、缩放和自定义您的视图
柱状图粒度会根据所选周期进行调整 — 将鼠标悬停在图表上可查看柱状图的开盘价/最高价/最低价/收盘价。
| 除息日 | 拆股 | 类型 |
|---|---|---|
| 2011年6月1日 | 2-for-1 | 正向 |
| 2005年5月31日 | 2-for-1 | 正向 |
| 1999年5月6日 | 2-for-1 | 正向 |
| 1991年5月6日 | 821-for-500 | 正向 |
关于 Enbridge Inc Common Stock 公司概况(来自维基百科)
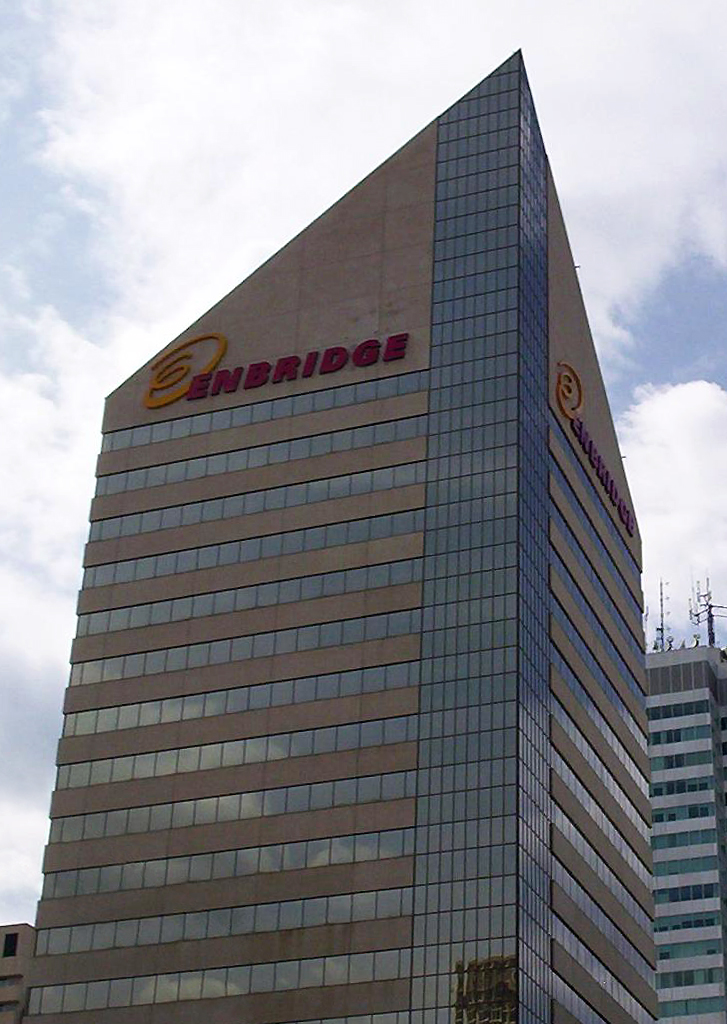
Enbridge Inc. is a Canadian pipeline and energy company headquartered in Calgary, Alberta, Canada. Enbridge owns and operates pipelines throughout Canada and the United States, transporting crude oil, natural gas, and natural gas liquids, and also generates renewable energy. Enbridge's pipeline system is the longest in North America and the largest oil export pipeline network in the world. Its crude oil system consists of 28,661 kilometres (17,809 miles) of pipelines. Its 38,300 kilometre (23,800 mile) natural gas pipeline system connects multiple Canadian provinces, several US states, and the Gulf of Mexico. The company was formed by Imperial Oil in 1949 as the Interprovincial Pipe Line Company Limited to transport Alberta oil to refineries. Over time, it has grown through acquisition of other existing pipeline companies and the expansion of their projects.
Enbridge has been responsible for several oil spills, including the Line 3 oil spill, which was the largest inland oil spill in the US, and the Kalamazoo River oil spill, which was another major inland oil spill in the US.
History
The company was initially incorporated by Imperial Oil as Interprovincial Pipe Line Company (IPL) on April 30, 1949, after Canada's first major oil discovery, in 1947, at Leduc, Alberta. In the same year, the company built its first oil pipeline from Leduc to Regina, Saskatchewan. In 1950, it was expanded through Gretna, Manitoba, to Superior, Wisconsin, in the United States. To operate the United States portion of the pipeline, the Lakehead Pipe Line Company (now Enbridge Energy Partners) was created. In 1953, the pipeline was expanded to Sarnia, Ontario, and in 1956 to Toronto and Buffalo, New York.
In 1953, IPL was listed on the Toronto and Montreal stock exchanges. In 1983, IPL built the Norman Wells pipeline and joined Frontier Pipeline Company. In 1986, through a series of stakes exchanges, IPL gained control of Home Oil and in 1988, it changed its name to Interhome Energy Inc. In 1991, it changed its name to Interprovincial Pipe Line Inc.
In 1992, Interprovincial Pipe Line Inc. was acquired by Interprovincial Pipe Line System Inc., which changed its name to IPL Energy Inc. in 1994, after the acquisition of Consumers' Gas (now Enbridge Gas Inc.) and diversification into the gas distribution business. In addition, it acquired stakes in AltaGas Services and the electric utility of Cornwall, Ontario. Through the 1990s, the company expanded its gas pipeline network and acquired a stake in the Chicap oil pipeline. It also built the Athabasca Pipeline from northeastern Alberta to the main pipeline system. In 1995, the company expanded its activities outside of North America by taking a stake in the Ocensa pipeline. This stake was sold in 2009. IPL Energy became Enbridge Inc in 1998. The Enbridge name is a portmanteau from "energy" and "bridge".
In the 2000s, Enbridge introduced several large projects. Enbridge made their first investment into renewable energy in 2002 with the purchase of a wind farm. In 2006, it announced the Enbridge Northern Gateway Pipelines Project from Athabasca to Kitimat, British Columbia. The same year, it announced the Alberta Clipper pipeline project from Hardisty, Alberta, to Superior, Wisconsin, to connect oil sands production area with the existing network. This pipeline became operational in 2010.
In 2009, Enbridge bought the Sarnia Photovoltaic Power Plant and expanded it up to 80 MW, which was the world's largest photovoltaic power station at that time.
In January 2017, Enbridge acquired Midcoast Energy Partners for $170 million in cash, and later in 2018, ArcLight acquired Midcoast Operating, L.P. from Enbridge for $1.1 billion.
Enbridge released its first annual sustainability report in 2001, and in November 2020, Enbridge expanded its environmental, social and governance (ESG) goals and targets. The company aims to achieve net-zero greenhouse gas emissions by 2050, with an interim target to reduce emissions intensity by 35% by 2030. That same year, President and CEO Al Monaco said that renewable power is now "the fourth Enbridge platform." Enbridge's ESG goals also aim to diversify its workforce with 28% representation from racial and ethnic groups and 40% from women by 2025.
In 2021, Enbridge was recognized as one of Canada's top 100 employers for the 18th time, and as one of Canada's best diversity employers for the seventh time.
In September 2023, it was announced Enbridge had agreed to acquire East Ohio Gas, Questar Gas, and Public Service Co. of North Carolina, from Dominion Energy for a total enterprise value worth $14 billion. The acquisition will result in Enbridge being the largest natural gas utility franchise in North America.
In September 2026, Enbridge announces the acquisition of Tallgrass Energy following a $2.55 billion agreement.
Merger with Spectra Energy
On September 6, 2016, Enbridge agreed to buy Spectra Energy in an all-stock deal valued at about $28 billion.
Spectra, headquartered in Houston, Texas, operated in three key areas of the natural gas industry: transmission and storage, distribution, and gathering and processing. Spectra was formed in late 2006 as a spin-off from Duke Energy. Spectra owned the Texas Eastern Pipeline (TETCo), a major natural gas pipeline transporting gas from the Gulf of Mexico coast in Texas to the New York City area; TETCo was one of the largest pipeline systems in the United States. Spectra also operated three oil pipelines, numerous other gas pipelines and was proposing to build still 3 more gas pipelines in the U.S. The merger was completed on February 27, 2017.
Operations
Crude oil and liquids pipelines
The company is the largest transporter of crude oil in Canada with 3 million barrels per day of oil and liquids. The Enbridge Pipeline System is the world's longest crude oil and liquids pipeline system, with 27,564 km (17,127 mi) of active crude pipeline in both Canada and the United States. This pipeline network delivers 3 million barrels of oil per day.
Enbridge delivered more than 3.77 billion barrels of crude oil in 2020, and more than 29.5 billion barrels over the past decade, from 2011 through 2020 inclusive.
Enbridge has several new capacities and expansion projects, including the expansion of the Alberta Clipper, replacing of Line 6B, reversal of Line 9 and others. Its Light Oil Market Access initiative is a project to deliver light crude oil from North Dakota and Western Canada to refineries in Ontario, Quebec, and the U.S. Midwest. Eastern Access, including a reversal of Line 9, is a project to deliver oil to Western Canada and Bakken to refineries in Eastern Canada and the midwest and eastern U.S. Western Gulf Coast Access, including reversal and expansion of the Seaway Pipeline and the Flanagan South Pipeline, is a plan to connect Canadian heavy oil supply to refineries along the Gulf Coast of the United States.
Enbridge's oil pipelines cross North America, with 13,833 km (8,672 mi) of active pipe in the United States and 13,681 km (8500 mi) of active pipe in Canada. The list below outlines eight of those lines.
Line 1 is a 1,767 km (1,098 mi) pipeline that starts in Enbridge's Edmonton Terminal in Alberta, and runs to its Superior Terminal in Wisconsin. On average, this pipeline delivers 237,000 barrels of light crude, natural gas liquids, and refined products daily.
Line 2A is a 966 km (600 mi) pipeline that runs from an Enbridge terminal in Edmonton, Alberta, to its Cromer Terminal in Manitoba. On average, per day this pipeline carries 442,000 barrels of condensates, light crude, and heavy crude. Line 2B is an 808 km (502 mi) pipeline that runs from the same Cromer Terminal to the Superior Terminal in Wisconsin. That pipeline delivers on average 442,000 barrels of light crude oil per day.
Line 3 is a 1,769 km (1,099 mi) pipeline that runs from the Edmonton terminal to the Superior Terminal. Over half (1,070 km) of the pipeline is located in Canada, between Alberta and Manitoba. Per day, the pipeline transports an average of 390,000 barrels of light, medium and heavy crude oil.
Line 4 is a 1,722 km (1,101 mi) crude oil pipeline starting at the Edmonton terminal to the Superior terminal. This pipeline carries, on average, 390,000 barrels of light, medium and heavy crude oil per day.
Line 5 is a 1,038 km (645 mi) crude oil pipeline running from the Superior terminal in Wisconsin to Sarnia, Ontario. On average, this pipeline moves 540,000 barrels of natural gas liquids and light crude oil per day.
Alberta clipper Pipeline (Line 67) is a 1,790 km (1,112 mi) pipeline that runs from Hardisty, Alberta to Superior, Wisconsin. An average of 800,000 barrels of heavy crude oil is moved through this pipeline per day.
Southern Lights Pipeline (Line 13) is a 2,560 km (1,591 mi) pipeline that runs from Manhattan, Illinois to the Edmonton terminal. This pipeline carries on average, 180,000 barrels of diluent per day.
Natural gas pipelines
Enbridge's pipelines transport 20% of the natural gas consumed in the United States. It owns and operates Canada's largest natural gas distribution network, providing distribution services in Ontario and Quebec. Union Gas in Ontario now fully operates under Enbridge Gas Inc. In Quebec, Enbridge has interest ownership in Gazifère.
Enbridge builds, owns and operates a network of natural gas transmission pipelines across North America, connecting the continent's natural gas supply to major markets in Canada, the United States, Mexico, and further abroad.
Enbridge's natural gas network currently covers 38,375 km (23,850 mi) across five Canadian provinces, 30 U.S. states, and offshore in the Gulf of Mexico, transporting roughly 16.2 Bcf (billions of cubic feet per day) of natural gas.
Canadian gas transmission: major assets
B.C. Pipeline (2.9 Bcf/d): this pipeline system runs from Fort Nelson in northeastern British Columbia to the U.S. border at Huntington-Sumas stretching 2,858 km (1,776 mi). It transports 60 percent of all natural gas produced in B.C., and provides natural gas service to the province as well as US states including Oregon, Idaho, and Washington.
Alliance Pipeline (1.6bcf/d): running 3,848 km (2,391 mi) from northern British Columbia across the U.S.-Canada border to Aux Sable gas processing plant in Channahon, Illinois. Enbridge owns 50 percent of the Alliance Pipeline and 42% of the Aux Sable processing facility.
U.S. gas transmission: major assets
Algonquin Gas Transmission (3.12 Bcf/d): this pipeline is 1,129 miles long, and transports natural gas to markets in New York, New Jersey, and New England.
East Tennessee (1.86 Bcf/d): a natural gas pipeline 1,526 miles long, extending from Tennessee to the Southeast and Mid-Atlantic states, ending in Virginia.
Maritimes & Northeast Pipeline: this pipeline was constructed to bring natural gas produced in Atlantic Canada through to other Canadian provinces (Nova Scotia and New Brunswick), and into U.S. states (Maine, New Hampshire, and Massachusetts).
NEXUS Gas Transmission: measuring 257 miles long, this pipeline supplies natural gas markets in the U.S. Midwest and the Dawn Hub in Ontario. This is a 50/50 joint partnership between Enbridge and DTE Energy.
Sabal Trail: carries natural gas via a 287-mile pipeline to the U.S. Southeast. This is a joint partnership between Enbridge, NextEra Energy and Duke Energy.
Southeast Supply Header (SESH) (1.09 Bcf/d): a natural gas pipeline 287 miles in length, connecting gas supply in Texas and Louisiana to other natural gas markets in the Southeast US.
Texas Eastern (12.12 Bcf/d): delivers natural gas from Texas and the Gulf Coast through 8,532 miles of pipeline to markets in the Northeastern UW including New York, Boston, and Pittsburgh.
Valley Crossing Pipeline (2.6 Bcf/d): placed into service in November 2018, this pipeline moves Texas sourced natural gas to a Mexico State-owned power utility, the Comision Federal de Electricidad (CFE).
Vector Pipeline: this pipeline acts as a connector for other pipelines including the Alliance pipeline and NEXUS Gas Transmission to the Union Gas Dawn Hub.
DCP Midstream
DCP Midstream is a joint venture between Enbridge and Phillips 66. Phillips 66 is one of the largest petroleum services companies in the US, owning and operating 39 natural gas plants and 51,000 miles of gathering pipe. Headquartered in Denver, Colorado, DCP operates a portfolio of natural gas gathering, logistics, marketing and processing services across nine states.
Renewable energy generation
Enbridge made its first investment into renewable energy in 2002 with the purchase of a wind farm. To date Enbridge has invested in 23 wind farms, 7 solar energy projects, 5 waste heat recovery facilities, 1 geothermal project, 1 power transmission project and 1 hydroelectric facility.
Enbridge has a growing interest in European offshore wind energy, and its renewable assets are part of the company's plan to achieve net-zero emissions by 2050.
Power transmission
In February 2020, Enbridge sold its shares of Montana-Alberta Tie-Line (MATL) to Berkshire Hathaway Energy. The MATL project is a 300-megawatt (MW), 230-kilovolt (kV) electrical transmission line allowing movement of power between Alberta and Montana. The MATL project, which was placed in service the fall of 2013, supports ongoing development of a rich wind-powered generation resource and allows electrical energy to flow in both directions. The transmission line is 210 miles (345 km) long and runs between the Lethbridge, Alberta area and the Great Falls, Montana area. Roughly one-third of the line is in Canada and two-thirds in the U.S.
Natural gas utility
Enbridge Gas Inc. was formed on January 1, 2019, with the combination of Enbridge Gas Distribution and Union Gas. Its network consists of 5,471 km of gas transmission lines, 66,787 km of gas distribution service lines, and 78,214 km of gas distribution main lines.
They deliver to over 15 million people in Ontario and Quebec through 3.8 million residential, commercial, industrial, and institutional meter connections and distribute roughly 2.3 bcf/d of natural gas. Additionally, in southwestern Ontario they have the largest integrated underground storage facility in Canada, and one of North America's top natural gas trading hubs.
Enbridge's natural gas distribution also includes interest ownership in two additional natural gas distributors. This includes Gazfiére, serving people in Outaouais region of Quebec, and Ènergir LP, a company that operates gas transmission, gas distribution, and power distribution throughout Quebec and Vermont.
In September 2023, Enbridge agreed to acquire three natural gas utility companies from Dominion Energy for $14 billion. The companies include the East Ohio Gas Company, Questar Gas Company, and the Public Service Company of North Carolina. These companies serve 3 million customers in the states of Ohio, Utah, Wyoming, Idaho, and North Carolina. Upon completion of the acquisition, Enbridge Gas Inc. will become the largest natural gas utility in North America supplying 9 bcf/d to 7 million customers.
Oil spills, fires, and violations
Enbridge's pipeline was responsible for the largest inland oil spill in the United States in 1991, when 1,700,000 U.S. gal (6,400 m3) of oil ruptured from a buried pipeline in Grand Rapids, Minnesota, spilling crude into a wetland and a tributary of the Mississippi River.
Using data from Enbridge's own reports, the Polaris Institute calculated that 804 spills occurred on Enbridge pipelines between 1999 and 2010. These spills released approximately 161,475 barrels (25,672.5 m3) of crude oil into the environment.
On July 4, 2002, an Enbridge pipeline ruptured in a marsh near the town of Cohasset, Minnesota, in Itasca County, spilling 6,000 barrels (950 m3) of crude oil. In an attempt to keep the oil from contaminating the Mississippi River, the Minnesota Department of Natural Resources set a controlled burn that lasted for one day and created a smoke plume about 1-mile (1.6 km) high and 5 miles (8.0 km) long.
In 2006, there were 67 reportable spills totaling 5,663 barrels (900.3 m3) on Enbridge's energy and transportation and distribution system; in 2007 there were 65 reportable spills totalling 13,777 barrels (2,190.4 m3). On March 18, 2006, approximately 613 barrels (97.5 m3) of crude oil were released when a pump failed at Enbridge's Willmar terminal in Saskatchewan. According to Enbridge, roughly half the oil was recovered.
On January 1, 2007, an Enbridge pipeline that runs from Superior, Wisconsin to near Whitewater, Wisconsin, cracked open and spilled ~50,000 US gallons (190 m3) of crude oil onto farmland and into a drainage ditch. The same pipeline was struck by construction crews on February 2, 2007, in Rusk County, Wisconsin, spilling ~201,000 US gallons (760 m3) of crude, of which about 87,000 U.S. gal (330 m3) were recovered. Some of the oil filled a hole more than 20 feet (6.1 m) deep and contaminated the local water table.
In April 2007, roughly 6,227 barrels (990.0 m3) of crude oil spilled into a field downstream of an Enbridge pumping station near Glenavon, Saskatchewan.
On November 13, 2007, Enbridge discovered a leak on their 34-inch Line 3, at Mile Post 912, near Clearbrook, Minnesota. Later, the pipeline exploded during repairs, on November 27, causing the deaths of two employees. DOT officials said that two Enbridge workers died in a crude oil explosion as they worked to make repairs on this former Lakehead system pipeline. Enbridge was cited for failing to safely and adequately perform maintenance and repair activities, clear the designated work area from possible sources of ignition, and hire properly trained and qualified workers.
In January 2009, an Enbridge pipeline leaked about 4,000 barrels (640 m3) of oil southeast of Fort McMurray at the company's Cheecham Terminal tank farm. Most of the spilled oil was contained within berms but about 1% of the oil, about 40 barrels (6.4 m3), sprayed into the air and coated nearby snow and trees.
On January 2, 2010, Enbridge's Line 2 ruptured near Neche, North Dakota, releasing about 3,784 barrels of crude oil, of which 2,237 barrels (355.7 m3) was recovered. In April 2010, an Enbridge pipeline ruptured spilling more than 9.5 barrels (1.51 m3) of oil in Virden, Manitoba. This oil leaked into the Boghill Creek, which eventually connects to the Assiniboine River.
In the July 2010 Kalamazoo River oil spill, a leaking pipeline spilled more than 1,000,000 US gallons (3,800 m3) of oil sands crude oil into Talmadge Creek leading to the Kalamazoo River in southwest Michigan on July 26, near Marshall, Michigan. A United States Environmental Protection Agency update of the Kalamazoo River spill concluded the pipeline rupture "caused the largest inland oil spill in Midwest history" and reported the cost of the cleanup at $36.7 million (US) as of November 14, 2011. PHMSA raised concerns in a Corrective Action Order (CAO) about numerous anomalies that had been detected on this pipeline by internal line inspection tools, yet Enbridge had failed to check a number of those anomalies in the field. The Michigan spill affected more than 31 miles (50 km) of waterways and wetlands and about 320 people reported symptoms from crude oil exposure. The National Transportation Safety Board said at $800 million, it was the costliest onshore spill cleanup in U.S. history. The NTSB found Enbridge knew of a defect in the pipeline five years before it burst. In June 2013, a Kalamazoo man lodged himself into an Enbridge pipeline in Marshall, MI to protest Enbridge's lack of accountability for the 2010 spill and to encourage landowners along Enbridge's Line 6B expansion to offer increased resistance to construction in 2013. In 2014, Enbridge completed cleanup of the river per the EPA's order.
On September 9, 2010, a broken water line caused a rupture on Enbridge's Line 6A pipeline near Romeoville, Illinois, releasing an estimated 7,500 barrels (1,190 m3) of oil into the surrounding area.
On July 27, 2012, an Enbridge crude oil pipeline ruptured in Grand Marsh, Wisconsin, releasing an estimated 50,000 gallons of crude oil. The pipeline had been installed in 1998. Flaws in the longitudinal welds had been seen during X-ray checks of girth welds.
On June 22, 2013, Enbridge subsidiary Athabasca pipelines reported a pipeline leak of approximately 750 barrels of light synthetic crude oil from Line 37 near Enbridge's Cheecham, Alberta, terminal about 70 kilometres (43 mi) southeast of Fort McMurray. The 17-kilometre-long, 12-inch diameter pipe was constructed in 2006 and links the Long Lake oilsands upgrader to the Cheetham terminal as part of Enbridge's Athabasca system. Unusually heavy rainfall in the region, also responsible for the 2013 Alberta floods, may have caused "ground movement on the right-of way that may have impacted the pipeline." Enbridge's Athabasca (Line 19) shares a portion of right of way with Line 37 and Enbridge's Wood Buffalo/Waupisoo (Line 75/18), a major part of the network that serves Alberta's oilsands. All three lines were closed down as a precautionary measure. Operations between Hardisty and Cheecham were restored on June 23 when Enbridge's Athabasca pipeline (Line 19) was restored to service.
On July 1, 2013, WWMT News in Michigan reported that the Michigan Department of Environmental Quality had issued a citation against Enbridge for contamination of North Ore Creek by an Enbridge pipeline maintenance activity.
On January 30, 2017, a road crew in Texas punctured the Seaway S-1 crude oil pipeline, which is jointly owned by Enterprise Products Partners and Enbridge through the joint venture Seaway Crude Pipeline Company. Two days later, it was unclear how much oil had spilled over the nearby Highway 121 northeast of Dallas. After the incident, supply concerns reportedly helped push "oil prices 2% higher in early trading to nearly $54 a barrel."
On October 9, 2018, Enbridge's Westcoast Pipeline exploded in Shelley, British Columbia, sparking a massive fireball and leading to shortages of natural gas throughout British Columbia.
On April 26, 2019, an Enbridge 20 inch diameter pipeline was found to be leaking at a valve, in Fort Atkinson, Wisconsin. Up to 1,386 gallons of liquids leaked from the valve, causing contamination of groundwater & soil. The Wisconsin Department of Natural Resources was not notified of this leak until July 31, 2020, with Enbridge claiming they thought this was smaller than the reporting size limit.
On August 1, 2019, a Texas Eastern Transmission, LP, a division of Enbridge, 30-inch gas transmission pipeline exploded and burned in Stanford, Kentucky. One person was killed, and five others were injured. Five homes were destroyed and at least four were damaged in the Indian Camp mobile home park in Stanford, where the explosion occurred. Flames reached more than 300 feet hig, and melted tar on nearby roads, officials said.
On November 11, 2024 Enbridge's Line 6 pipeline spilled 69,300 gallons of crude oil underground. According to Enbridge, the spilt oil was a result of a faulty connection on a pump transfer pipe. An Enbridge technician was the first to discover the spill in Oakland, Jefferson County, Wisconsin. Enbridge in response started soil removal in polluted areas from the spill.
Protests
In May 2012, West Coast First Nations members and supporters protested near Enbridge's Annual Shareholder's meeting, against the proposed Northern Gateway Project and on May 31, 2012, the Vancouver Observer reported about 40 protesters outside the Canadian Oil and Gas Export Summit, protesting the proposed Enbridge Northern Gateway Project.
On July 17, 2012, a group calling itself "We are the Kalamazoo" protested against Enbridge's response to the Kalamazoo spill and its plans to construct the line 6B pipeline. This protest was on the second anniversary of the Kalamazoo spill.
On November 12, 2012, the Lansing State Journal reported that the head of the Line 6B Pipeline project stated that he had never seen as much organized landowner resistance despite 30 years in the pipeline industry. They noted that this was probably because of the 2010 Kalamazoo River spill.
In May 2013, Hamilton area residents protested the reversal of flow in Line 9 and temporarily closed Ontario Highway 6. Later that year, on June 6, 2013, a group called Hamilton 350 sent a letter of complaint to the Hamilton (Ontario) police service (HPS) for accepting over $44,000 in donations from Enbridge. The letter questions whether police officers would be impartial during any anti-Enbridge protests, given the donation.
On June 26, 2013, Hamilton Police arrested at least 10 people who occupied an Enbridge compound for six days to protest the expansion of Enbridge's Line 9 and intent to ship diluted bitumen through the line.
On July 22, 2013, a group of protesters locked themselves to equipment at an Enbridge pipeline construction site in Stockbridge, Michigan. Protesters stated that they had to take matters into their own hands given that state regulators were failing the public, "We felt that there was no other option."
A September 16, 2013, "Inside Climate News" report by journalist David Hasemeyer describes how many Michigan landowners are concerned about the safety of new Enbridge pipeline being laid within a few feet of their homes, and the lack of regulations for how close a pipeline can be constructed to an existing home. The article quotes Richard Kuprewicz, President of an engineering consulting company and an adviser to Pipeline Hazardous Materials Administration: "Clearly the pipeline safety regulations aren't adequate in this area and the siting regulations aren't adequate," Kuprewicz said. "It's a bad combination."
In September 2016, a group of Native Americans protested the construction of the Dakota Access Pipeline, which Enbridge had announced plans to acquire a portion of in a $2 billion deal.
In November 2020, Michigan Governor Gretchen Whitmer revoked a 1953 easement for an Enbridge pipeline connecting two parts of the Great Lakes through the Straits of Mackinac.
In June 2021, Enbridge resumed construction on the Line 3 replacement project in Northern Minnesota after taking a brief planned break. Enbridge's plans to expand its Line 3 pipeline in Minnesota along a new route have been met with prolonged resistance from Native communities and activists calling themselves water protectors.
In January 2022, a group of about 400 met in front of a Bank of America location in Austin to protest Enbridge's plans to expand the Moda Ingleside Energy Center onto historic Karankawa land in Corpus Christi, Texas.
In September, 2023, in a trial flawed by numerous protocol breaches on the part of the prosecution and local authorities, Mylene Vialard was found guilty of felony obstruction. According to the article, Vialard was among more than a thousand arrests by Minnesota law enforcement – which along with other agencies received at least $8.6m in payments from Enbridge.
In 2024, the film Bad River was released. The film documented Enbridge's trespassing on the Bad River reservation with Line 5 and the local community's struggle to get the pipeline removed. It also covered how Enbridge attempted to influence the Bad River tribal elections.
Technology and innovation
Enbridge has two Technology and Innovation labs. In January 2019, the first lab opened in Calgary, Alberta. In April 2019, the second lab opened in Houston, Texas. The labs use industrial predictive algorithms, machine learning, and sentiment analysis to find efficiencies within the company and help improve safety and reliability of their pipeline infrastructure.
The labs have developed ways to get sensor data from pipelines, helping to improve flows of natural gas and crude oil terminals. Additionally, the labs have helped enhance pipeline leak detection, and ensure better maintenance schedules. For renewable energy projects, the labs have developed different ways to reposition wind turbine blades to help maximize wind power generation.
Financials
Dollar amounts in millions of Canadian dollars unless otherwise noted, with the exception of employee numbers. Additionally, earnings are after income tax and unadjusted. Employee count is approximate and includes both permanent and temporary employees.
Leadership
President
Dr Oliver Baker Hopkins, 1949–1951
Thomas Stuart Johnston, 1951–1967
David George Waldon, 1967–1977
Robert Kneeland Heule, 1977–1985
George Edward Courtnage, 1985–1986
Richard Francis Haskayne, 1987–1991
Brian Frederick MacNeill, 1991–2000
Patrick Darold Daniel, 2000–2012
Albert Monaco, 2012–2023
Gregory Lorne Ebel, 2023–2026
Michele Harradence, 2027–present
Chairman of the Board
Thomas Stuart Johnston, 1967–1968
David George Waldon, 1977–1978
Robert Kneeland Heule, 1985–1989
Richard Francis Haskayne, 1989–1991
Hugh Gordon MacNeill, 1991–1996
Donald James Taylor, 1996–2005
David Allen Arledge, 2005–2017
Gregory Lorne Ebel, 2017–2022
Pamela Lynn Carter, 2023–2025
Steven Walter Williams, 2025–present
来源:维基百科 (英语), CC BY-SA 4.0 · 在维基百科上查看 ↗
10年表现 收入、净利润、利润率和每股收益趋势
估值 P/E、P/S、P/B、EV/EBITDA 比率 — 该股票是昂贵还是便宜?
| 指标 | 5年趋势 | ENB | 5年均值 | 同行中位数 | 结论 |
|---|---|---|---|---|---|
| P/E (TTM) | 17.75年均值 ≈18.0 | ≈18.0 | · | · | |
| P/S (TTM) | 1.2 | · | · | · | |
| 市净率 (MRQ) | 1.5 | · | · | · | |
| 股价/自由现金流 (TTM) | 60.2 | · | · | · | |
| 市现率 (TTM) | 8.1 | · | · | · | |
| 市净率(有形资产) (MRQ) | 1.65年均值 ≈3.6 | ≈3.6 | · | · | |
| PEG Ratio (市盈率增长比) | ≈1.1 | · | · | · |
同行中位数按每项指标的标准化基础计算,可能与本股票显示的TTM/MRQ基础不完全匹配。
盈利能力 毛利率、营业利润率和净利率;股本回报率 (ROE)、资产回报率 (ROA)、投入资本回报率 (ROIC)
| 指标 | 5年趋势 | ENB | 5年均值 | 同行中位数 | 结论 |
|---|---|---|---|---|---|
| 营业利润率 (TTM) | 13.3% | · | · | · | |
| 息税折旧摊销前利润率 (TTM) | 20.2% | · | · | · | |
| 税前利润率 (TTM) | 9.6% | · | · | · | |
| 净利润率 (TTM) | 7.3% | · | · | · | |
| ROA (TTM) | 2.8% | · | · | · | |
| ROE (TTM) | 9.4% | · | · | · |
财务健康 债务、流动性、偿付能力 — 资产负债表强度
| 指标 | 5年趋势 | ENB | 5年均值 | 同行中位数 | 结论 |
|---|---|---|---|---|---|
| 负债/股东权益比率 (MRQ) | 0.0 | · | · | · | |
| 流动比率 (MRQ) | 0.7 | · | · | · |
成长 营收、每股收益 (EPS) 和净利润增长:同比、3年复合年增长率 (CAGR)、5年复合年增长率 (CAGR)
| 指标 | 5年趋势 | ENB | 5年均值 | 同行中位数 | 结论 |
|---|---|---|---|---|---|
| Revenue YoY (营收同比增长) | 21.9%5年均值 ≈12.0% | ≈12.0% | · | · | |
| Revenue CAGR 3Y (营收3年复合年增长率) | 6.9%5年均值 ≈5.0% | ≈5.0% | · | · | |
| Revenue CAGR 5Y (营收5年复合年增长率) | 10.8% | · | · | · | |
| EPS YoY | 37.6%5年均值 ≈36.1% | ≈36.1% | · | · | |
| Net Income YoY (净利润同比增长) | 37.7%5年均值 ≈32.9% | ≈32.9% | · | · | |
| EPS CAGR 3Y (每股收益年复合增长率(3年)) | 36.0%5年均值 ≈17.9% | ≈17.9% | · | · | |
| EPS CAGR 5Y (每股收益年复合增长率(5年)) | 16.8% | · | · | · | |
| Net Income CAGR 3Y (净利润年复合增长率(3年)) | 35.6%5年均值 ≈18.0% | ≈18.0% | · | · | |
| Net Income CAGR 5Y (净利润年复合增长率(5年)) | 17.4% | · | · | · |
资本效率 资产周转率、库存周转率、应收账款周转率
| 指标 | 5年趋势 | ENB | 5年均值 | 同行中位数 | 结论 |
|---|---|---|---|---|---|
| Revenue / Employee (年营业收入 ÷ 员工人数(报告的 headcount,yfinance)。衍生数据 — 非存储的 SEC-XBRL 概念。) | ≈$4.4M | · | · | · |
价值 · ≈ 5年均值 · 行业中值 · 相对于中值的评判
股息 收益率、派息率、股息历史、5年CAGR
| 除息日 | 金额 | 货币 | 收益率 |
|---|---|---|---|
| 八月 14, 2026 | $0.70 | USD | ≈5.5% |
| 五月 15, 2026 | $0.71 | USD | ≈3.8% |
| 二月 17, 2026 | $0.71 | USD | ≈4.0% |
| 八月 15, 2025 | $0.68 | USD | ≈5.7% |
| 五月 15, 2025 | $0.68 | USD | ≈5.9% |
| 二月 14, 2025 | $0.67 | USD | ≈6.2% |
| 十一月 15, 2024 | $0.65 | USD | ≈6.3% |
| 八月 15, 2024 | $0.67 | USD | ≈6.9% |
| 五月 14, 2024 | $0.67 | USD | ≈7.2% |
| 二月 14, 2024 | $0.68 | USD | ≈7.9% |
| 十一月 14, 2023 | $0.64 | USD | ≈7.9% |
| 八月 14, 2023 | $0.66 | USD | ≈7.4% |
| 五月 12, 2023 | $0.66 | USD | ≈6.9% |
| 二月 14, 2023 | $0.67 | USD | ≈6.7% |
| 十一月 14, 2022 | $0.65 | USD | ≈6.6% |
| 八月 12, 2022 | $0.67 | USD | ≈6.1% |
| 五月 12, 2022 | $0.66 | USD | ≈6.3% |
| 二月 14, 2022 | $0.68 | USD | ≈6.5% |
| 十一月 12, 2021 | $0.66 | USD | ≈6.6% |
| 八月 12, 2021 | $0.67 | USD | ≈6.7% |
收益历史 每股收益实际值 vs 预估值,惊喜%,达标率,下次财报日期
| 期间 | 报告 | EPS Actual | EPS 预期 | 惊喜 |
|---|---|---|---|---|
| 2026年6月30日 | $0.63 | $0.59 | 6.1% | |
| 2026年3月31日 | $0.98 | $0.95 | 3.1% | |
| 2025年12月31日 | $0.88 | $0.78 | 12.6% | |
| 2025年9月30日 | $0.46 | $0.52 | -11.4% | |
| 2025年6月30日 | $0.65 | $0.58 | 12.3% | |
| 2025年3月31日 | $1.03 | $0.97 | 6.4% |
完整基本面 所有年度指标 — 损益表、资产负债表、现金流量表
损益表
| 指标 | 趋势 | 2025 | 2024 | 2023 | 2022 | 2021 | 2020 | 2019 | 2018 | 2017 | 2016 | 2015 |
|---|---|---|---|---|---|---|---|---|---|---|---|---|
| Revenue | $65.19B | $53.47B | $43.65B | $53.31B | $47.07B | $39.09B | $50.07B | $46.38B | $44.38B | $34.56B | $33.79B | |
| Cost of Revenue | · | · | $21.37B | $32.59B | $28.70B | $20.67B | $31.00B | $29.40B | $28.64B | $24.00B | $25.24B | |
| SG&A Expense | $9.97B | $9.43B | $8.60B | $8.22B | $6.71B | $6.75B | $6.99B | $6.79B | $6.44B | $4.36B | $4.13B | |
| Operating Expenses | $54.24B | $43.82B | $35.00B | $48.13B | $39.27B | $31.13B | $41.81B | $41.56B | $42.81B | $31.98B | $31.93B | |
| Operating Income | $10.96B | $9.65B | $8.65B | $5.18B | $7.80B | $7.96B | $8.26B | $4.82B | $1.57B | $2.58B | $1.86B | |
| Interest Expense | $5.02B | $4.42B | $3.81B | $3.18B | $2.65B | $2.79B | $2.66B | $2.70B | $2.56B | $1.59B | $1.62B | |
| Other Non-op | $1.63B | $-1.33B | $1.22B | $-589M | $979M | $238M | $258M | $516M | $199M | $93M | $88M | |
| Pretax Income | $9.79B | $7.30B | $7.88B | $4.54B | $7.73B | $4.19B | $7.54B | $3.57B | $569M | $2.45B | $11M | |
| Income Tax | $2.00B | $1.67B | $1.82B | $1.60B | $1.42B | $774M | $1.71B | $237M | $-2.70B | $142M | $170M | |
| Net Income | $7.49B | $5.44B | $6.19B | $3.00B | $6.19B | $3.36B | $5.71B | $2.88B | $2.86B | $2.07B | $251M | |
| EPS (Basic) | $3.23 | $2.34 | $2.84 | $1.28 | $2.87 | $1.48 | $2.64 | $1.46 | $1.66 | · | · | |
| EPS (Diluted) | $3.22 | $2.34 | $2.84 | $1.28 | $2.87 | $1.48 | $2.63 | $1.46 | $1.65 | · | · | |
| Shares (Basic) | 2,180,000,000 | 2,155,000,000 | 2,056,000,000 | 2,025,000,000 | 2,023,000,000 | 2,020,000,000 | 2,017,000,000 | 1,724,000,000 | 1,525,000,000 | 911,000,000 | 847,000,000 | |
| Shares (Diluted) | 2,186,000,000 | 2,158,000,000 | 2,058,000,000 | 2,029,000,000 | 2,025,000,000 | 2,021,000,000 | 2,020,000,000 | 1,727,000,000 | 1,532,000,000 | 918,000,000 | 847,000,000 | |
| EBITDA | · | · | · | · | · | · | · | $8.06B | $4.73B | · | · |
资产负债表
| 指标 | 趋势 | 2025 | 2024 | 2023 | 2022 | 2021 | 2020 | 2019 | 2018 | 2017 | 2016 | 2015 |
|---|---|---|---|---|---|---|---|---|---|---|---|---|
| Cash & Equivalents | $1.09B | $1.80B | $5.90B | $861M | $286M | $452M | $648M | $518M | $480M | $1.49B | $654M | |
| Inventory | $1.62B | $1.49B | $1.48B | $2.25B | $1.67B | $1.54B | $1.30B | $1.34B | $1.53B | $1.23B | · | |
| Other Current Assets | $3.23B | $2.77B | $2.44B | $3.25B | · | · | · | · | · | · | · | |
| Current Assets | $13.20B | $13.16B | $14.40B | $12.15B | $8.96B | $7.35B | $8.71B | $8.57B | $9.21B | $7.79B | · | |
| PP&E (Net) | $131.60B | $131.10B | $104.64B | $104.46B | $100.07B | $94.57B | $93.72B | $94.54B | $90.71B | $64.28B | · | |
| PP&E (Gross) | · | · | · | · | · | $117.95B | $113.96B | $112.40B | $105.81B | $78.89B | · | |
| Accum. Depreciation | · | · | · | · | · | $23.38B | $20.24B | $17.86B | $15.10B | $14.61B | · | |
| Goodwill | $35.28B | $36.60B | $31.85B | $32.44B | $32.77B | $32.69B | $33.15B | $34.46B | $34.46B | $78M | · | |
| Intangibles | $3.99B | $4.59B | $3.54B | $4.02B | $4.01B | $2.08B | $2.17B | $2.37B | $3.27B | $1.57B | · | |
| Total Assets | $218.47B | $218.97B | $180.32B | $179.61B | $168.86B | $160.28B | $163.16B | $166.91B | $162.09B | $85.21B | · | |
| Accrued Liabilities | · | · | · | $5.24B | $4.47B | $3.50B | $4.54B | $4.60B | $5.13B | $3.72B | · | |
| Short-term Debt | $1.03B | $529M | $400M | $2.00B | $1.51B | $1.12B | $898M | $1.02B | $1.44B | $351M | · | |
| Current Liabilities | $21.00B | $23.81B | $17.43B | $20.30B | $18.23B | $13.98B | $15.90B | $14.86B | $14.62B | $12.34B | · | |
| Capital Leases | $587M | $738M | $652M | $677M | $612M | $681M | $689M | · | · | · | · | |
| Deferred Tax | $20.28B | $19.60B | $15.03B | $13.78B | $11.69B | $10.33B | $9.87B | $9.45B | $9.29B | $6.04B | · | |
| Other Non-current Liabilities | $12.30B | $13.26B | $8.65B | $9.19B | $7.62B | $8.78B | $8.32B | $8.83B | $7.51B | $4.98B | · | |
| Total Liabilities | $152.55B | $150.08B | $115.83B | $116.21B | $105.50B | $95.91B | $93.75B | $93.47B | $92.29B | $59.85B | · | |
| Long-term Debt | $104.41B | $101.82B | $80.44B | $78.74B | $73.81B | $65.36B | $63.59B | $62.97B | $62.93B | · | · | |
| Total Debt | · | · | · | · | · | · | · | $1.02B | $1.44B | · | · | |
| Common Stock | $71.88B | $71.74B | $69.18B | $64.76B | $64.80B | $64.77B | $64.75B | $64.68B | $50.74B | $10.49B | · | |
| Paid-in Capital | $242M | $275M | $268M | $275M | $365M | $277M | $187M | $0 | $3.19B | $3.40B | · | |
| Retained Earnings | $-21.28B | $-20.05B | $-17.11B | $-15.49B | $-10.99B | $-9.99B | $-6.31B | $-5.54B | $-2.47B | $-716M | · | |
| AOCI | $4.68B | $7.12B | $2.30B | $3.52B | $-1.10B | $-1.40B | $-272M | $2.67B | $-973M | $1.06B | · | |
| Stockholders' Equity | $62.33B | $65.90B | $61.45B | $59.89B | $60.83B | $61.37B | $66.04B | $69.47B | $58.13B | $21.39B | · | |
| Liabilities + Equity | $218.47B | $218.97B | $180.32B | $179.61B | $168.86B | $160.28B | $163.16B | $166.91B | $162.09B | $85.21B | · | |
| Shares Outstanding | 2,182,000,000 | 2,178,000,000 | 2,125,000,000 | 2,025,000,000 | 2,026,000,000 | 2,026,000,000 | 2,025,000,000 | 2,022,000,000 | 1,695,000,000 | 943,000,000 | 868,000,000 |
现金流
| 指标 | 趋势 | 2025 | 2024 | 2023 | 2022 | 2021 | 2020 | 2019 | 2018 | 2017 | 2016 | 2015 |
|---|---|---|---|---|---|---|---|---|---|---|---|---|
| D&A | $5.66B | $5.17B | $4.61B | $4.32B | $3.85B | $3.71B | $3.39B | $3.25B | $3.16B | $2.24B | $2.02B | |
| Deferred Tax | $1.02B | $719M | $1.42B | $957M | $1.09B | $447M | $1.16B | $-148M | $-2.88B | $43M | $7M | |
| Amort. of Intangibles | $534M | $530M | $535M | $483M | $348M | $294M | $296M | $281M | $280M | $177M | $158M | |
| Other Non-cash | · | · | · | · | · | · | · | $5.44B | $3.12B | · | · | |
| Operating Cash Flow | $12.27B | $12.60B | $14.20B | $11.23B | $9.26B | $9.78B | $9.40B | $10.50B | $6.66B | $5.21B | $4.57B | |
| CapEx | $8.97B | $6.71B | $4.65B | $4.65B | $7.82B | $5.41B | $5.49B | $6.81B | $8.29B | $5.13B | $7.27B | |
| Investing Cash Flow | $-10.50B | $-20.36B | $-6.04B | $-5.27B | $-10.66B | $-5.18B | $-4.66B | $-3.02B | $-11.04B | $-5.15B | $-7.93B | |
| Debt Issued | · | · | · | · | $8.03B | $5.23B | $6.18B | $3.54B | $9.48B | $4.08B | $3.77B | |
| Net Debt Issued | · | · | · | · | · | · | · | $-908M | $4.43B | · | · | |
| Stock Issued | $28M | $2.48B | $4.45B | $3M | $5M | $5M | $18M | $21M | $1.55B | $2.26B | $57M | |
| Stock Repurchased | $0 | $0 | $125M | $151M | $0 | $0 | · | · | · | · | · | |
| Net Stock Activity | · | · | · | · | · | · | · | $21M | $1.50B | · | · | |
| Dividends Paid | $8.22B | $7.88B | $7.28B | $6.97B | $6.77B | $6.56B | $5.97B | $3.48B | $2.75B | $1.15B | · | |
| Financing Cash Flow | $-2.40B | $3.54B | $-2.86B | $-5.43B | $1.24B | $-4.77B | $-4.75B | $-7.50B | $3.48B | $840M | $3.07B | |
| Net Change in Cash | $-680M | $-3.98B | $5.08B | $587M | $-170M | $-186M | $39M | $50M | $-975M | $874M | $-145M | |
| Taxes Paid | $1.21B | $861M | $578M | $495M | $489M | $524M | $571M | $277M | $172M | $194M | $80M | |
| Free Cash Flow | · | · | · | · | · | · | · | $3.70B | $-1.70B | · | · | |
| Levered FCF | · | · | · | · | · | · | · | $1.17B | $-16.37B | · | · |
盈利能力
| 指标 | 趋势 | 2025 | 2024 | 2023 | 2022 | 2021 | 2020 | 2019 | 2018 | 2017 | 2016 | 2015 |
|---|---|---|---|---|---|---|---|---|---|---|---|---|
| Operating Margin | · | · | · | · | · | · | · | 10.4% | 3.5% | · | · | |
| Net Margin | · | · | · | · | · | · | · | 6.2% | 6.4% | · | · | |
| Pretax Margin | · | · | · | · | · | · | · | 7.7% | 1.3% | · | · | |
| EBITDA Margin | · | · | · | · | · | · | · | 17.4% | 10.7% | · | · | |
| ROA | · | · | · | · | · | · | · | 1.8% | 2.3% | · | · | |
| ROE | · | · | · | · | · | · | · | 4.5% | 7.2% | · | · | |
| ROIC | · | · | · | · | · | · | · | 6.4% | 15.1% | · | · |
流动性与偿付能力
| 指标 | 趋势 | 2025 | 2024 | 2023 | 2022 | 2021 | 2020 | 2019 | 2018 | 2017 | 2016 | 2015 |
|---|---|---|---|---|---|---|---|---|---|---|---|---|
| Current Ratio | · | · | · | · | · | · | · | 0.6 | 0.6 | · | · | |
| Quick Ratio | · | · | · | · | · | · | · | 0.0 | 0.0 | · | · | |
| Debt / Equity | · | · | · | · | · | · | · | 0.0 | 0.0 | · | · | |
| Interest Coverage | · | · | · | · | · | · | · | 1.8 | 0.6 | · | · |
效率
| 指标 | 趋势 | 2025 | 2024 | 2023 | 2022 | 2021 | 2020 | 2019 | 2018 | 2017 | 2016 | 2015 |
|---|---|---|---|---|---|---|---|---|---|---|---|---|
| Asset Turnover | · | · | · | · | · | · | · | 0.3 | 0.4 | · | · | |
| Inventory Turnover | · | · | · | · | · | · | · | 20.5 | 20.7 | · | · |
每股
| 指标 | 趋势 | 2025 | 2024 | 2023 | 2022 | 2021 | 2020 | 2019 | 2018 | 2017 | 2016 | 2015 |
|---|---|---|---|---|---|---|---|---|---|---|---|---|
| Book Value / Share | · | · | · | · | · | · | · | $34.36 | $34.30 | · | · | |
| Revenue / Share | · | · | · | · | · | · | · | $26.85 | $28.97 | · | · | |
| Cash Flow / Share | · | · | · | · | · | · | · | $6.08 | $4.30 | · | · | |
| Cash / Share | · | · | · | · | · | · | · | $0.26 | $0.28 | · | · | |
| Dividend Paid / Share | $3.77 | $3.66 | $3.55 | $3.44 | $3.34 | $3.24 | $2.95 | $2.68 | $2.41 | $2.12 | $1.86 | |
| EPS (TTM) | $3.22 | $2.34 | $2.84 | $1.28 | $2.87 | $1.48 | $2.63 | $1.46 | $1.65 | · | · |
增长率
| 指标 | 趋势 | 2025 | 2024 | 2023 | 2022 | 2021 | 2020 | 2019 | 2018 | 2017 | 2016 | 2015 |
|---|---|---|---|---|---|---|---|---|---|---|---|---|
| Revenue YoY | 21.9% | 22.5% | -18.1% | 13.2% | 20.4% | · | · | · | · | · | · | |
| Revenue CAGR 3Y | 6.9% | 4.3% | 3.8% | · | · | · | · | · | · | · | · | |
| Revenue CAGR 5Y | 10.8% | · | · | · | · | · | · | · | · | · | · | |
| EPS YoY | 37.6% | -17.6% | 121.9% | -55.4% | 93.9% | · | · | · | · | · | · | |
| EPS CAGR 3Y | 36.0% | -6.6% | 24.3% | · | · | · | · | · | · | · | · | |
| EPS CAGR 5Y | 16.8% | · | · | · | · | · | · | · | · | · | · | |
| Net Income YoY | 37.7% | -12.1% | 106.2% | -51.5% | 84.0% | · | · | · | · | · | · | |
| Net Income CAGR 3Y | 35.6% | -4.2% | 22.6% | · | · | · | · | · | · | · | · | |
| Net Income CAGR 5Y | 17.4% | · | · | · | · | · | · | · | · | · | · | |
| Dividends Paid CAGR 5Y | 4.6% | · | · | · | · | · | · | · | · | · | · |
估值 (TTM)
| 指标 | 趋势 | 2025 | 2024 | 2023 | 2022 | 2021 | 2020 | 2019 | 2018 | 2017 | 2016 | 2015 |
|---|---|---|---|---|---|---|---|---|---|---|---|---|
| Revenue TTM | $65.19B | $53.47B | $43.65B | $53.31B | $47.07B | $39.09B | $50.07B | $46.38B | $44.38B | · | · | |
| Net Income TTM | $7.49B | $5.44B | $6.19B | $3.00B | $6.19B | $3.36B | $5.71B | $2.88B | $2.86B | · | · | |
| Market Cap | · | · | · | · | · | · | · | $62.84B | $66.29B | · | · | |
| Enterprise Value | · | · | · | · | · | · | · | $63.35B | $67.26B | · | · | |
| P/E | 14.9 | 18.1 | 12.7 | 30.5 | 13.6 | 21.6 | 15.1 | 21.3 | 23.7 | · | · | |
| P/S | · | · | · | · | · | · | · | 1.4 | 1.5 | · | · | |
| P/B | · | · | · | · | · | · | · | 0.9 | 1.1 | · | · | |
| P / Tangible Book | 4.5 | 3.7 | 2.9 | 3.4 | 3.3 | 2.4 | · | · | · | · | · | |
| P / Cash Flow | · | · | · | · | · | · | · | 6.0 | 10.1 | · | · | |
| P / FCF | · | · | · | · | · | · | · | 17.0 | -38.9 | · | · | |
| EV / EBITDA | · | · | · | · | · | · | · | 7.9 | 14.2 | · | · | |
| EV / FCF | · | · | · | · | · | · | · | 17.1 | -39.5 | · | · | |
| EV / Revenue | · | · | · | · | · | · | · | 1.4 | 1.5 | · | · | |
| Dividend Yield | · | · | · | · | · | · | · | 5.5% | 4.2% | · | · | |
| Earnings Yield | 6.7% | 5.5% | 7.9% | 3.3% | 7.3% | 4.6% | 6.6% | 4.7% | 4.2% | · | · | |
| Payout Ratio | · | · | · | · | · | · | · | 120.8% | 122.4% | · | · | |
| Annual Payout | $8.22B | $7.88B | $7.28B | $6.97B | $6.77B | $6.56B | $5.97B | $3.48B | $2.75B | · | · |
损益表
| 指标 | 趋势 | Q2 2026 | Q1 2026 | Q4 2025 | Q3 2025 | Q2 2025 | Q1 2025 | Q4 2024 | Q3 2024 | Q2 2024 | Q1 2024 | Q4 2023 | Q3 2023 | Q2 2023 | Q1 2023 | Q4 2022 | Q3 2022 |
|---|---|---|---|---|---|---|---|---|---|---|---|---|---|---|---|---|---|
| Revenue | $29.32B | $22.36B | $17.18B | $14.64B | $14.88B | $18.50B | $16.22B | $14.88B | $11.34B | $11.04B | $11.30B | $9.84B | $10.43B | $12.07B | $13.42B | $11.57B | |
| Cost of Revenue | · | · | · | · | · | · | · | $9.07B | $5.48B | $5.00B | · | $4.83B | $4.92B | $6.23B | · | $6.63B | |
| SG&A Expense | $2.36B | $2.57B | $2.71B | $2.48B | $2.31B | $2.47B | $2.70B | $2.28B | $2.31B | $2.13B | $2.48B | $2.06B | $2.03B | $2.04B | $2.26B | $2.09B | |
| Operating Expenses | $26.41B | $19.13B | $14.45B | $12.37B | $12.59B | $14.83B | $13.77B | $12.66B | $9.06B | $8.33B | $9.45B | $8.05B | $8.08B | $9.41B | $13.96B | $9.79B | |
| Operating Income | $2.91B | $3.23B | $2.73B | $2.27B | $2.29B | $3.67B | $2.45B | $2.22B | $2.27B | $2.71B | $1.84B | $1.79B | $2.35B | $2.66B | $-540M | $1.78B | |
| Interest Expense | · | · | · | · | · | · | · | · | · | $905M | $1.10B | $921M | $883M | $905M | $863M | $806M | |
| Other Non-op | $-35M | $-179M | $442M | $-297M | $1.37B | $120M | $-1.12B | $376M | $-31M | $-551M | $1.01B | $-465M | $575M | $102M | $335M | $-883M | |
| Pretax Income | $2.01B | $2.37B | $2.46B | $1.16B | $2.99B | $3.19B | $849M | $1.76B | $2.74B | $1.95B | $2.23B | $751M | $2.52B | $2.38B | $-549M | $1.70B | |
| Income Tax | $442M | $587M | $325M | $316M | $666M | $697M | $231M | $312M | $739M | $386M | $664M | $128M | $519M | $510M | $560M | $318M | |
| Net Income | $1.50B | $1.78B | $2.06B | $788M | $2.28B | $2.36B | $595M | $1.39B | $1.94B | $1.51B | $1.82B | $621M | $1.94B | $1.82B | $-983M | $1.36B | |
| EPS (Basic) | $0.64 | $0.77 | $0.89 | $0.30 | $1.00 | $1.04 | $0.23 | $0.59 | $0.86 | $0.67 | $0.81 | $0.26 | $0.91 | $0.86 | $-0.52 | $0.63 | |
| EPS (Diluted) | $0.64 | $0.76 | $0.89 | $0.30 | $1.00 | $1.03 | $0.23 | $0.59 | $0.86 | $0.67 | $0.82 | $0.26 | $0.91 | $0.85 | $-0.52 | $0.63 | |
| Shares (Basic) | 2,184,000,000 | 2,182,000,000 | · | 2,181,000,000 | 2,180,000,000 | 2,179,000,000 | · | 2,177,000,000 | 2,137,000,000 | 2,126,000,000 | · | 2,048,000,000 | 2,024,000,000 | 2,025,000,000 | · | 2,025,000,000 | |
| Shares (Diluted) | 2,190,000,000 | 2,188,000,000 | · | 2,187,000,000 | 2,186,000,000 | 2,185,000,000 | · | 2,180,000,000 | 2,139,000,000 | 2,128,000,000 | · | 2,049,000,000 | 2,027,000,000 | 2,028,000,000 | · | 2,028,000,000 | |
| EBITDA | $4.34B | $4.66B | · | $3.67B | $3.68B | $5.08B | · | $3.54B | $3.55B | $3.90B | · | $2.96B | $3.49B | $3.81B | · | $2.85B |
资产负债表
| 指标 | 趋势 | Q2 2026 | Q1 2026 | Q4 2025 | Q3 2025 | Q2 2025 | Q1 2025 | Q4 2024 | Q3 2024 | Q2 2024 | Q1 2024 | Q4 2023 | Q3 2023 | Q2 2023 | Q1 2023 | Q4 2022 | Q3 2022 |
|---|---|---|---|---|---|---|---|---|---|---|---|---|---|---|---|---|---|
| Cash & Equivalents | $2.01B | $1.64B | $1.09B | $1.41B | $1.20B | $2.09B | $1.80B | $1.88B | $3.59B | $1.21B | · | $2.61B | $1.03B | $976M | · | $1.02B | |
| Inventory | $1.59B | $1.85B | $1.62B | $1.90B | $1.41B | $1.23B | $1.49B | $1.61B | $1.36B | $1.38B | · | $1.57B | $1.21B | $1.31B | · | $2.35B | |
| Other Current Assets | $4.12B | $4.64B | $3.23B | $2.72B | $2.84B | $2.44B | $2.77B | $2.61B | $2.59B | $2.24B | · | $2.76B | $2.77B | $2.70B | · | · | |
| Current Assets | $17.72B | $18.86B | $13.20B | $12.08B | $11.07B | $13.60B | $13.16B | $11.89B | $12.50B | $10.01B | · | $11.13B | $8.97B | $9.92B | · | $10.81B | |
| PP&E (Net) | $137.66B | $134.41B | $131.60B | $130.95B | $128.18B | $131.58B | $131.10B | · | · | · | · | $105.58B | $103.95B | $104.25B | $104.46B | $105.25B | |
| Goodwill | $36.22B | $35.77B | $35.28B | $35.68B | $35.16B | $36.60B | $36.60B | $34.86B | $34.32B | $34.29B | $31.85B | $32.39B | $31.89B | $32.41B | $32.44B | $35.27B | |
| Intangibles | $3.97B | $4.00B | $3.99B | $4.26B | $4.28B | $4.51B | $4.59B | $4.40B | $4.50B | $4.53B | · | $3.73B | $3.76B | $3.91B | · | $4.12B | |
| Total Assets | $231.65B | $228.20B | $218.47B | $216.97B | $211.59B | $220.04B | $218.97B | $205.77B | $201.26B | $190.71B | · | $178.41B | $173.94B | $177.07B | · | $181.78B | |
| Short-term Debt | $1.57B | $1.49B | $1.03B | $1.27B | $914M | $859M | $529M | $928M | $200M | $335M | · | $1.58B | $848M | $1.44B | · | $1.88B | |
| Current Liabilities | $24.58B | $23.31B | $21.00B | $15.04B | $14.81B | $18.63B | $23.81B | $19.05B | $16.33B | $14.72B | · | $16.73B | $14.03B | $16.78B | · | $17.91B | |
| Capital Leases | · | · | $587M | · | · | · | $738M | · | · | · | · | · | · | · | · | · | |
| Deferred Tax | $21.66B | $21.01B | $20.28B | $20.24B | $19.68B | $19.98B | $19.60B | $18.37B | $17.91B | $16.69B | · | $14.95B | $14.50B | $14.29B | · | $13.34B | |
| Other Non-current Liabilities | $12.71B | $12.38B | $12.30B | $12.28B | $11.77B | $12.99B | $13.26B | $12.25B | $11.59B | $10.62B | · | $9.47B | $8.85B | $9.23B | · | $9.13B | |
| Total Liabilities | $162.80B | $159.71B | $152.55B | $148.16B | $143.23B | $148.76B | $150.08B | $137.00B | $131.01B | $123.41B | · | $109.94B | $109.90B | $112.05B | · | $114.34B | |
| Long-term Debt | · | · | $104.41B | · | · | · | · | · | · | · | · | · | · | · | · | · | |
| Total Debt | $1.57B | $1.49B | · | $1.27B | $914M | $859M | · | $928M | $200M | $335M | · | $1.58B | $848M | $1.44B | · | $1.88B | |
| Common Stock | $71.95B | $71.94B | $71.88B | $71.84B | $71.82B | $71.81B | $71.74B | $71.71B | $71.70B | $69.20B | · | $69.18B | $64.69B | $64.77B | · | $64.76B | |
| Paid-in Capital | $183M | $168M | $242M | $240M | $226M | $229M | $275M | $286M | $272M | $274M | · | $276M | $291M | $274M | · | $312M | |
| Retained Earnings | $-20.33B | $-19.61B | $-21.28B | $-19.06B | $-17.66B | $-17.79B | $-20.05B | $-16.50B | $-15.79B | $-15.70B | · | $-15.01B | $-13.75B | $-13.75B | · | $-10.88B | |
| AOCI | $6.73B | $5.65B | $4.68B | $5.35B | $4.24B | $7.19B | $7.12B | $3.47B | $4.23B | $3.66B | · | $3.83B | $2.56B | $3.43B | · | $3.83B | |
| Stockholders' Equity | $65.35B | $64.97B | $62.33B | $65.18B | $65.45B | $68.26B | $65.90B | $65.79B | $67.23B | $64.26B | · | $65.09B | $60.62B | $61.54B | · | $64.83B | |
| Liabilities + Equity | $231.65B | $228.20B | $218.47B | $216.97B | $211.59B | $220.04B | $218.97B | $205.77B | $201.26B | $190.71B | · | $178.41B | $173.94B | $177.07B | · | $181.78B | |
| Shares Outstanding | 2,184,000,000 | 2,184,000,000 | 2,182,000,000 | 2,181,000,000 | 2,181,000,000 | 2,180,000,000 | 2,178,000,000 | 2,178,000,000 | 2,177,000,000 | 2,126,000,000 | 2,125,000,000 | 2,126,000,000 | 2,023,000,000 | 2,025,000,000 | 2,025,000,000 | 2,025,000,000 |
现金流
| 指标 | 趋势 | Q2 2026 | Q1 2026 | Q4 2025 | Q3 2025 | Q2 2025 | Q1 2025 | Q4 2024 | Q3 2024 | Q2 2024 | Q1 2024 | Q4 2023 | Q3 2023 | Q2 2023 | Q1 2023 | Q4 2022 | Q3 2022 |
|---|---|---|---|---|---|---|---|---|---|---|---|---|---|---|---|---|---|
| D&A | $1.43B | $1.43B | $1.46B | $1.40B | $1.39B | $1.41B | $1.38B | $1.32B | $1.27B | $1.19B | $1.17B | $1.16B | $1.14B | $1.15B | $1.12B | $1.08B | |
| Deferred Tax | $184M | $271M | $81M | $153M | $487M | $304M | $-24M | $130M | $479M | $134M | $497M | $4M | $435M | $484M | $357M | $131M | |
| Other Non-cash | · | $-3.06B | · | · | · | $-1.92B | · | · | · | $12M | · | · | · | $1.33B | · | · | |
| Operating Cash Flow | $4.11B | $2.34B | $3.11B | $2.87B | $3.24B | $3.05B | $3.66B | $2.97B | $2.81B | $3.15B | $3.81B | $3.08B | $3.44B | $3.87B | $3.61B | $2.14B | |
| CapEx | $2.98B | $2.44B | $3.03B | $2.32B | $1.90B | $1.72B | $2.55B | $1.63B | $1.35B | $1.19B | $1.37B | $1.19B | $964M | $1.13B | $1.44B | $1.20B | |
| Investing Cash Flow | $-3.07B | $-2.83B | $-3.32B | $-2.54B | $-2.86B | $-1.79B | $-4.45B | $-4.68B | $-3.44B | $-7.79B | $-2.54B | $-1.17B | $-896M | $-1.44B | $-2.11B | $-1.04B | |
| Debt Issued | $0 | $2.00B | · | · | · | · | · | · | · | · | · | · | · | · | · | · | |
| Net Debt Issued | · | $1.93B | · | · | · | $-2.74B | · | · | · | $-3.78B | · | · | · | $-968M | · | · | |
| Stock Issued | $0 | $0 | $20M | $2M | $1M | $5M | $0 | $0 | $2.48B | $0 | $0 | $4.45B | $0 | $0 | $0 | $0 | |
| Stock Repurchased | · | · | · | · | · | · | $0 | $0 | · | · | $0 | $0 | $125M | $0 | $0 | $0 | |
| Net Stock Activity | · | $0 | · | · | · | $5M | · | · | · | · | · | · | · | $0 | · | · | |
| Dividends Paid | $2.12B | $2.12B | $2.06B | $2.06B | $2.06B | $2.05B | $1.99B | $2.00B | $1.95B | $1.95B | $1.89B | $1.79B | $1.80B | $1.80B | $1.74B | $1.74B | |
| Financing Cash Flow | $-823M | $1.11B | $-108M | $-126M | $-1.22B | $-950M | $601M | $156M | $2.91B | $-120M | $2.28B | $-376M | $-2.48B | $-2.29B | $-1.64B | $-1.18B | |
| Net Change in Cash | $242M | $650M | $-332M | $230M | $-900M | $322M | $-102M | $-1.60B | $2.31B | $-4.60B | $3.34B | $1.56B | $39M | $144M | $-150M | $-31M | |
| Free Cash Flow | · | $-97M | · | · | · | $1.33B | · | · | · | $1.97B | · | · | · | $2.74B | · | · | |
| Levered FCF | · | · | · | · | · | · | · | · | · | $1.24B | · | · | · | $2.03B | · | · |
盈利能力
| 指标 | 趋势 | Q2 2026 | Q1 2026 | Q4 2025 | Q3 2025 | Q2 2025 | Q1 2025 | Q4 2024 | Q3 2024 | Q2 2024 | Q1 2024 | Q4 2023 | Q3 2023 | Q2 2023 | Q1 2023 | Q4 2022 | Q3 2022 |
|---|---|---|---|---|---|---|---|---|---|---|---|---|---|---|---|---|---|
| Operating Margin | 9.9% | 14.4% | · | 15.5% | 15.4% | 19.9% | · | 14.9% | 20.1% | 24.6% | · | 18.2% | 22.5% | 22.1% | · | 15.4% | |
| Net Margin | 5.1% | 8.0% | · | 5.4% | 15.3% | 12.8% | · | 9.3% | 17.1% | 13.7% | · | 6.3% | 18.6% | 15.0% | · | 11.8% | |
| Pretax Margin | 6.9% | 10.6% | · | 7.9% | 20.1% | 17.2% | · | 11.8% | 24.2% | 17.7% | · | 7.6% | 24.2% | 19.7% | · | 14.7% | |
| EBITDA Margin | 14.8% | 20.8% | · | 25.1% | 24.7% | 27.5% | · | 23.8% | 31.3% | 35.4% | · | 30.0% | 33.4% | 31.5% | · | 24.7% | |
| ROA | 0.68% | 0.79% | · | 0.37% | 1.1% | 1.1% | · | 0.72% | 1.0% | 0.82% | · | 0.34% | 1.1% | 1.1% | · | 0.79% | |
| ROE | 2.3% | 2.7% | · | 1.2% | 3.4% | 3.6% | · | 2.1% | 3.0% | 2.4% | · | 0.96% | 3.2% | 2.9% | · | 2.1% | |
| ROIC | 3.4% | 3.6% | · | 2.5% | 2.7% | 4.2% | · | 2.7% | 2.5% | 3.4% | · | 2.2% | 3.0% | 3.3% | · | 2.2% |
流动性与偿付能力
| 指标 | 趋势 | Q2 2026 | Q1 2026 | Q4 2025 | Q3 2025 | Q2 2025 | Q1 2025 | Q4 2024 | Q3 2024 | Q2 2024 | Q1 2024 | Q4 2023 | Q3 2023 | Q2 2023 | Q1 2023 | Q4 2022 | Q3 2022 |
|---|---|---|---|---|---|---|---|---|---|---|---|---|---|---|---|---|---|
| Current Ratio | 0.7 | 0.8 | · | 0.8 | 0.7 | 0.7 | · | 0.6 | 0.8 | 0.7 | · | 0.7 | 0.6 | 0.6 | · | 0.6 | |
| Quick Ratio | 0.1 | 0.1 | · | 0.1 | 0.1 | 0.1 | · | 0.1 | 0.2 | 0.1 | · | 0.2 | 0.1 | 0.1 | · | 0.1 | |
| Debt / Equity | 0.0 | 0.0 | · | 0.0 | 0.0 | 0.0 | · | 0.0 | 0.0 | 0.0 | · | 0.0 | 0.0 | 0.0 | · | 0.0 | |
| Interest Coverage | · | · | · | · | · | · | · | · | · | 3.0 | · | 1.9 | 2.7 | 2.9 | · | 2.2 |
效率
| 指标 | 趋势 | Q2 2026 | Q1 2026 | Q4 2025 | Q3 2025 | Q2 2025 | Q1 2025 | Q4 2024 | Q3 2024 | Q2 2024 | Q1 2024 | Q4 2023 | Q3 2023 | Q2 2023 | Q1 2023 | Q4 2022 | Q3 2022 |
|---|---|---|---|---|---|---|---|---|---|---|---|---|---|---|---|---|---|
| Asset Turnover | 0.1 | 0.1 | · | 0.1 | 0.1 | 0.1 | · | 0.1 | 0.1 | 0.1 | · | 0.1 | 0.1 | 0.1 | · | 0.1 | |
| Inventory Turnover | · | · | · | · | · | · | · | 5.7 | 4.3 | 3.7 | · | 2.5 | 3.6 | 4.9 | · | 3.5 |
每股
| 指标 | 趋势 | Q2 2026 | Q1 2026 | Q4 2025 | Q3 2025 | Q2 2025 | Q1 2025 | Q4 2024 | Q3 2024 | Q2 2024 | Q1 2024 | Q4 2023 | Q3 2023 | Q2 2023 | Q1 2023 | Q4 2022 | Q3 2022 |
|---|---|---|---|---|---|---|---|---|---|---|---|---|---|---|---|---|---|
| Book Value / Share | $29.92 | $29.75 | · | $29.89 | $30.01 | $31.31 | · | $30.21 | $30.88 | $30.23 | · | $30.62 | $29.96 | $30.39 | · | $32.02 | |
| Revenue / Share | $13.39 | $10.22 | · | $6.69 | $6.81 | $8.47 | · | $6.83 | $5.30 | $5.19 | · | $4.80 | $5.15 | $5.95 | · | $5.71 | |
| Cash Flow / Share | · | $1.07 | · | · | · | $1.40 | · | · | · | $1.48 | · | · | · | $1.91 | · | · | |
| Cash / Share | $0.92 | $0.75 | · | $0.65 | $0.55 | $0.96 | · | $0.86 | $1.65 | $0.57 | · | $1.23 | $0.51 | $0.48 | · | $0.50 | |
| Dividend / Share | $0.00 | $0.97 | · | $0.00 | $0.00 | $0.94 | · | · | · | · | · | · | · | · | · | · | |
| Dividend Paid / Share | $0.97 | $0.97 | $-939998.11 | $0.94 | $0.94 | $0.94 | $-919998.18 | $0.92 | $0.92 | $920000.00 | $-889998.23 | $890000.00 | $0.89 | $0.89 | $0.86 | $0.86 | |
| EPS (TTM) | $2.59 | $2.95 | · | $2.56 | $2.85 | $2.71 | · | $2.94 | $2.61 | $2.66 | · | $1.50 | $1.87 | $1.18 | · | $2.70 |
估值 (TTM)
| 指标 | 趋势 | Q2 2026 | Q1 2026 | Q4 2025 | Q3 2025 | Q2 2025 | Q1 2025 | Q4 2024 | Q3 2024 | Q2 2024 | Q1 2024 | Q4 2023 | Q3 2023 | Q2 2023 | Q1 2023 | Q4 2022 | Q3 2022 |
|---|---|---|---|---|---|---|---|---|---|---|---|---|---|---|---|---|---|
| Revenue TTM | $83.49B | $69.05B | · | $64.23B | $64.48B | $60.94B | · | $48.55B | $43.52B | $42.61B | · | $45.77B | $47.50B | $50.29B | · | $52.41B | |
| Net Income TTM | $6.13B | $6.91B | · | $6.03B | $6.63B | $6.29B | · | $6.66B | $5.89B | $5.89B | · | $3.39B | $4.13B | $2.79B | · | $5.92B | |
| Market Cap | $118.39B | $118.24B | · | $110.05B | $98.84B | $96.60B | · | $88.45B | $77.48B | $76.92B | · | $70.56B | $75.15B | $77.25B | · | $75.13B | |
| Enterprise Value | $117.95B | $118.09B | · | $109.92B | $98.55B | $95.37B | · | $87.50B | $74.09B | $76.04B | · | $69.54B | $74.97B | $77.71B | · | $75.99B | |
| P/E | 20.9 | 18.4 | · | 19.7 | 15.9 | 16.4 | · | 13.8 | 13.6 | 13.6 | · | 22.1 | 19.9 | 32.3 | · | 13.7 | |
| P/S | 1.4 | 1.7 | · | 1.7 | 1.5 | 1.6 | · | 1.8 | 1.8 | 1.8 | · | 1.5 | 1.6 | 1.5 | · | 1.4 | |
| P/B | 1.8 | 1.8 | · | 1.7 | 1.5 | 1.4 | · | 1.3 | 1.2 | 1.2 | · | 1.1 | 1.2 | 1.3 | · | 1.2 | |
| P / Tangible Book | 4.7 | 4.7 | · | 4.4 | 3.8 | 3.6 | · | 3.3 | 2.7 | 3.0 | · | 2.4 | 3.0 | 3.1 | · | 3.0 | |
| P / Cash Flow | · | 50.5 | · | · | · | 31.6 | · | · | · | 24.4 | · | · | · | 20.0 | · | · | |
| EV / Revenue | 1.4 | 1.7 | · | 1.7 | 1.5 | 1.6 | · | 1.8 | 1.7 | 1.8 | · | 1.5 | 1.6 | 1.5 | · | 1.4 | |
| Dividend Yield | 7.0% | 7.0% | · | 7.4% | 8.2% | 8.3% | · | 8.8% | 9.8% | 9.7% | · | 10.1% | 9.4% | 9.1% | · | 9.2% | |
| Earnings Yield | 4.8% | 5.5% | · | 5.1% | 6.3% | 6.1% | · | 7.2% | 7.3% | 7.3% | · | 4.5% | 5.0% | 3.1% | · | 7.3% | |
| Payout Ratio | · | 119.0% | · | · | · | 86.9% | · | · | · | 128.6% | · | · | · | 99.0% | · | · | |
| Annual Payout | $8.35B | $8.28B | · | $8.15B | $8.09B | $7.98B | · | $7.77B | $7.57B | $7.42B | · | $7.13B | $7.08B | $7.02B | · | $6.92B |
最近期在左侧 · 空值显示为 ·
财务报表 损益表、资产负债表、现金流量表 — 年度,近5年
| 指标 | 2025-12-31 | 2024-12-31 | 2023-12-31 | 2022-12-31 | 2021-12-31 |
|---|---|---|---|---|---|
| 收入 | $65.19B | $53.47B | $43.65B | $53.31B | $47.07B |
| 净收入 | $7.49B | $5.44B | $6.19B | $3.00B | $6.19B |
| 稀释后每股收益 (EPS) | $3.22 | $2.34 | $2.84 | $1.28 | $2.87 |
基本面数据不足,尚无法生成此报表。
基本面数据不足,尚无法生成此报表。
机构持有人 (13F) 1615 家申报者 · $63.8B 总计 · 截至 2026年9月30日
在其季度SEC表格13F中报告持有此股票的机构。仅限多头头寸;单个申报人可能因单独的期权腿而出现两次。 大的抵消性看跌/看涨腿通常反映做市或对冲库存,而非方向性判断。
| 新仓位 | 已退出持仓 | 增加 | 减少 | 净股数变动 |
|---|---|---|---|---|
| 101 (-89 与上一季度对比) | 81 (+13 与上一季度对比) | 541 (+51 与上一季度对比) | 516 (-36 与上一季度对比) | +36.5M |
与Q1 2026对比。 SEC 13F表格的提交截止日期是季度末后45天,外加少量延迟提交的缓冲期——在此窗口期内的季度将被跳过,优先显示最近一个已完整报告的季度对。
| 机构 | 价值 | 股份 | % 已追踪的13F | 类型 |
|---|---|---|---|---|
| ROYAL BANK OF CANADA | $5875697000 | 108387706 | 9.21% | 股份 |
| VANGUARD GROUP INC | $4802765961 | 100364993 | 7.52% | 股份 |
| VANGUARD CAPITAL MANAGEMENT LLC | $3404579535 | 62781529 | 5.33% | 股份 |
| BANK OF MONTREAL /CAN/ | $3331001219 | 61486532 | 5.22% | 股份 |
| GQG Partners LLC | $2660876370 | 49084876 | 4.17% | 股份 |
| DEUTSCHE BANK AG\ | $1850502477 | 34135814 | 2.90% | 股份 |
| TD Asset Management Inc | $1695480638 | 31276338 | 2.66% | 股份 |
| MACKENZIE FINANCIAL CORP | $1626748636 | 21151328 | 2.55% | 股份 |
| 1832 Asset Management L.P. | $1551523593 | 28620616 | 2.43% | 股份 |
| GEODE CAPITAL MANAGEMENT, LLC | $1398658231 | 25099241 | 2.19% | 股份 |
| CIBC WORLD MARKET INC. | $1395383413 | 25754086 | 2.19% | 股份 |
| NORGES BANK | $1301348283 | 24021424 | 2.04% | 股份 |
| NATIONAL BANK OF CANADA /FI/ | $1121155439 | 20703852 | 1.76% | 股份 |
| Connor, Clark & Lunn Investment Management Ltd. | $1117352735 | 20624547 | 1.75% | 股份 |
| VANGUARD FIDUCIARY TRUST CO | $1049283754 | 19349126 | 1.64% | 股份 |
| Legal & General Group Plc | $944782208 | 17428310 | 1.48% | 股份 |
| Vanguard Global Advisers, LLC | $908854288 | 16759562 | 1.42% | 股份 |
| TD Waterhouse Canada Inc. | $863952233 | 16189798 | 1.35% | 股份 |
| GOLDMAN SACHS GROUP INC | $851746947 | 15711989 | 1.33% | 股份 |
| JPMORGAN CHASE & CO | $818920565 | 14781958 | 1.28% | 股份 |
| SCOTIA CAPITAL INC. | $778118150 | 14359061 | 1.22% | 股份 |
| CIBC Asset Management Inc | $763981423 | 14080398 | 1.20% | 股份 |
| MORGAN STANLEY | $753296104 | 13895886 | 1.18% | 股份 |
| Blackstone Inc. | $739416865 | 13639861 | 1.16% | 股份 |
| Amundi | $647728023 | 11948497 | 1.01% | 股份 |
| MANUFACTURERS LIFE INSURANCE COMPANY, THE | $599708731 | 11079469 | 0.94% | 股份 |
| CANADA PENSION PLAN INVESTMENT BOARD | $585113425 | 10800535 | 0.92% | 股份 |
| TORONTO DOMINION BANK | $503775144 | 9299341 | 0.79% | 股份 |
| BANK OF NOVA SCOTIA | $485527072 | 8953708 | 0.76% | 股份 |
| FIL Ltd | $473169028 | 8725419 | 0.74% | 股份 |
| ONTARIO TEACHERS PENSION PLAN BOARD | $467781621 | 8634722 | 0.73% | 股份 |
| Federation des caisses Desjardins du Quebec | $458193260 | 8470608 | 0.72% | 股份 |
| Bank of New York Mellon Corp | $412626781 | 7611637 | 0.65% | 股份 |
| Morgan Stanley Institutional Investment Advisors LLC | $400550904 | 7388875 | 0.63% | 股份 |
| CHARLES SCHWAB INVESTMENT MANAGEMENT INC | $383510312 | 7074571 | 0.60% | 股份 |
| Swiss National Bank | $381285813 | 7051631 | 0.60% | 股份 |
| BANK OF AMERICA CORP /DE/ | $380896021 | 7026305 | 0.60% | 股份 |
| Clearbridge Investments, LLC | $363515510 | 6705691 | 0.57% | 股份 |
| TORTOISE CAPITAL ADVISORS, L.L.C. | $322887834 | 5956241 | 0.51% | 股份 |
| MIRAE ASSET GLOBAL ETFS HOLDINGS Ltd. | $310768908 | 5732686 | 0.49% | 股份 |
| Capital World Investors | $273191333 | 5039487 | 0.43% | 股份 |
| KAYNE ANDERSON CAPITAL ADVISORS LP | $272630710 | 5029159 | 0.43% | 股份 |
| ROYAL BANK OF CANADA | $269397000 | 4969500 | 0.42% | 卖出期权 |
| FEDERATED HERMES, INC. | $266511322 | 4916276 | 0.42% | 股份 |
| Nuveen, LLC | $265894435 | 4904911 | 0.42% | 股份 |
| UBS Group AG | $261964891 | 4832409 | 0.41% | 股份 |
| Vontobel Holding Ltd. | $259891259 | 4797300 | 0.41% | 股份 |
| Caisse de depot et placement du Quebec | $256283148 | 4727626 | 0.40% | 股份 |
| VANGUARD ASSET MANAGEMENT, Ltd | $251476792 | 4637312 | 0.39% | 股份 |
| MASSACHUSETTS FINANCIAL SERVICES CO /MA/ | $240947587 | 3241036 | 0.38% | 股份 |
激进投资者及 5%+ 股东 3 持仓
提交了 SEC Schedule 13D 的投资者 — 持有超过 5% 的受益所有权,意图影响发行人(激进股东持股、董事会活动、并购)。每一行显示该申报人持仓的最新已知状态。
| 申报人 | 已申报 | 持股 | 状态 | 目的 | 申报 |
|---|---|---|---|---|---|
| Enbridge Energy Company, Inc., Enbridge (U.S.) Inc., Enbridge US Holdings Inc. Not applicable., Enbridge Inc. ×9 申报 | 2018年12月20日 | · | 初始申报 | 并购/出售 | SEC |
| Spectra Energy Corp (“ Spectra Energy ”), Spectra Energy Capital, LLC (“ SE Capital ”), Spectra Energy Transmission, LLC (“ SE Transmission ”), Spectra Energy Southeast Supply Header, LLC (“ SESSH ”), Spectra Energy Partners GP, LLC (“ SEP GP LLC ”), Spectra Energy Partners (DE) GP, LP (“ SEP GP ”), Enbridge (U.S.) Inc. (“ EUSI ”), Enbridge US Holdings Inc. (“ EUSHI ”) Not applicable., Enbridge Inc. (“ Enbridge ”) ×7 申报 | 2018年12月17日 | · | 初始申报 | 并购/出售 | SEC |
| 未披露的报告人, 未披露的报告人 | 2002年10月28日 | · | 初始申报 | 被动投资 | SEC |
Purpose is an automated classification of the filer's own stated purpose (SEC Item 4) — not investment advice. "—" means no clear purpose was stated or the text could not be classified.
公司内部人士 24 位内幕人士 · 10 位高管 · 15 位董事
| 内部人士 | 角色 | 上次活动 | 持股数量 | 买入 12个月 | 卖出 12个月 | 净额 12个月 |
|---|---|---|---|---|---|---|
| Albert Monaco | President & Chief Executive Officer | 2019年6月5日 P | 824530 | 0 | 0 | $0 |
| Colin K Gruending | Executive Vice President & Chief Financial Officer | 2019年6月1日 A | · | 0 | 0 | $0 |
| John K Whelen | Executive Vice President & Chief Financial Officer | 2019年3月8日 D | 199900 | 0 | 0 | $0 |
| William T. Yardley | Executive Vice President & President, Gas Transmission & Midstream | 2019年5月8日 A | 94770 | 0 | 0 | $0 |
| Guy D Jarvis | Executive Vice President & President, Liquids Pipelines | 2019年3月8日 M | 71635 | 0 | 0 | $0 |
| Byron C Neiles | Executive Vice President, Corporate Services | 2019年3月8日 D | 65008 | 0 | 0 | $0 |
| Allen C Capps | Senior Vice President & Chief Accounting Officer | 2019年3月8日 D | 1371 | 0 | 0 | $0 |
| Vernon D Yu | Executive Vice President & Chief Development Officer | 2019年3月8日 D | 87912 | 0 | 0 | $0 |
| Cynthia L Hansen | Executive Vice President & President, Utilities & Power Operations | 2019年3月1日 P | 6467 | 0 | 0 | $0 |
| Robert R Rooney | Executive Vice President & Chief Legal Officer | 2019年2月21日 A | 18096 | 0 | 0 | $0 |
| Charles W Fischer | 董事 | 2019年6月14日 A | 31169 | 0 | 0 | $0 |
| Marcel Rosaire Coutu | 董事 | 2019年6月14日 A | · | 0 | 0 | $0 |
| Catherine Lynne Williams | 董事 | 2019年6月14日 A | 52721 | 0 | 0 | $0 |
| James Herbert England | 董事 | 2019年6月14日 A | 27327 | 0 | 0 | $0 |
| Pamela L Carter | 董事 | 2019年6月14日 A | 42559 | 0 | 0 | $0 |
| Dan C Tutcher | 董事 | 2019年6月14日 A | 203838 | 0 | 0 | $0 |
| Susan M Cunningham | 董事 | 2019年6月14日 A | 404 | 0 | 0 | $0 |
| Gregory L Ebel | 董事 | 2019年6月14日 A | 648080 | 0 | 0 | $0 |
| Darkes V Maureen Kempston | 董事 | 2019年6月14日 A | · | 0 | 0 | $0 |
| MADDEN TERESA S | 董事 | 2019年6月14日 A | · | 0 | 0 | $0 |
| Michael E J Phelps | 董事 | 2019年3月22日 A | 55645 | 0 | 0 | $0 |
| Clarence P Cazalot JR | 董事 | 2019年3月22日 A | 132955 | 0 | 0 | $0 |
| Michael Mcshane | 董事 | 2018年9月21日 A | · | 0 | 0 | $0 |
| Rebecca B Roberts | 董事 | 2018年3月23日 A | · | 0 | 0 | $0 |
来自SEC表格3/4/5申报的内部人士;净额=仅公开市场买卖
ETF持仓 由 47 只交易所交易基金持有
权重仅反映直接股权持仓(N-PORT);杠杆基金或基于衍生品的基金可能持有未显示的额外掉期敞口。
| 基金 | 权重 | 单位 | 截至 | 来源 |
|---|---|---|---|---|
| BKGI · BNY Mellon ETF Trust | 7.55% | 1817730 NS | 2026年7月31日 | N-PORT |
| USAI · Pacer Funds Trust | 6.93% | 169142 NS | 2026年7月31日 | N-PORT |
| GEND · Spinnaker ETF Series | 4.12% | 3671 NS | 2026年7月31日 | N-PORT |
| BBCA · J.P. Morgan Exchange-Traded Fund ... | 3.88% | 7737103 NS | 2026年7月31日 | N-PORT |
| IGF · iShares Trust | 3.80% | 8161455 SH | 2026年9月11日 | 每日 |
| EWC · iShares, Inc. | 3.42% | 4835641 SH | 2026年9月11日 | 每日 |
| PAYR · Federated Hermes ETF Trust | 3.27% | 34304 NS | 2026年7月31日 | N-PORT |
| GENW · Spinnaker ETF Series | 3.23% | 3037 NS | 2026年7月31日 | N-PORT |
| ELCV · Strategy Shares | 3.15% | 145312 NS | 2026年7月31日 | N-PORT |
| PID · Invesco Exchange-Traded Fund Trust | 3.04% | 551755 SH | 2026年10月1日 | 每日 |
| IXC · iShares Trust | 2.71% | 1661516 SH | 2026年9月11日 | 每日 |
| FIDI · Fidelity Covington Trust | 2.59% | 172569 NS | 2026年7月31日 | N-PORT |
| IGE · iShares Trust | 2.56% | 426540 SH | 2026年9月11日 | 每日 |
| EFFI · Harbor ETF Trust | 2.15% | 61057 NS | 2026年7月31日 | N-PORT |
| TBG · EA Series Trust | 1.86% | 88930 NS | 2026年7月31日 | N-PORT |
| NFRA · FlexShares Trust | 1.83% | 1014021 NS | 2026年7月31日 | N-PORT |
| IQRA · New York Life Investments Active ... | 1.16% | 1465 NS | 2026年7月31日 | N-PORT |
| FEDM · FlexShares Trust | 1.16% | 16807 NS | 2026年7月31日 | N-PORT |
| IMTM · iShares Trust | 0.67% | 597038 SH | 2026年9月11日 | 每日 |
| VYMI · VANGUARD WHITEHALL FUNDS | 0.64% | 2445691 SH | 2026年8月19日 | 每日 |
| IDLV · Invesco Exchange-Traded Fund Trus... | 0.56% | 38153 SH | 2026年10月1日 | 每日 |
| PTIN · Pacer Funds Trust | 0.50% | 16815 NS | 2026年7月31日 | N-PORT |
| BKIE · BNY Mellon ETF Trust | 0.46% | 110930 NS | 2026年7月31日 | N-PORT |
| PXF · Invesco Exchange-Traded Fund Trus... | 0.38% | 239052 SH | 2026年10月1日 | 每日 |
| VEA · VANGUARD TAX-MANAGED FUNDS | 0.36% | 21346072 SH | 2026年8月19日 | 每日 |
| IDEV · iShares Trust | 0.36% | 2401615 SH | 2026年9月11日 | 每日 |
| DFAI · Dimensional ETF Trust | 0.34% | 1094034 NS | 2026年7月31日 | N-PORT |
| ESGG · FlexShares Trust | 0.30% | 6175 NS | 2026年7月31日 | N-PORT |
| VEU · VANGUARD INTERNATIONAL EQUITY IND... | 0.29% | 5109054 SH | 2026年8月19日 | 每日 |
| GLBL · Pacer Funds Trust | 0.29% | 58 NS | 2026年7月31日 | N-PORT |
| ACWX · iShares Trust | 0.28% | 718347 SH | 2026年9月11日 | 每日 |
| VXUS · VANGUARD STAR FUNDS | 0.26% | 32065862 SH | 2026年8月19日 | 每日 |
| CRBN · iShares Trust | 0.25% | 60770 SH | 2026年9月11日 | 每日 |
| IXUS · iShares Trust | 0.24% | 3015325 SH | 2026年9月11日 | 每日 |
| TLTD · FlexShares Trust | 0.21% | 26202 NS | 2026年7月31日 | N-PORT |
| IMFL · Invesco Exchange-Traded Self-Inde... | 0.21% | 46802 SH | 2026年10月1日 | 每日 |
| DFSI · Dimensional ETF Trust | 0.14% | 28562 NS | 2026年7月31日 | N-PORT |
| VOXP · Advisors Series Trust | 0.13% | 135 NS | 2026年7月31日 | N-PORT |
| TOK · iShares Trust | 0.12% | 5964 SH | 2026年9月11日 | 每日 |
| URTH · iShares, Inc. | 0.12% | 196859 SH | 2026年9月11日 | 每日 |
| DFIC · Dimensional ETF Trust | 0.11% | 310307 NS | 2026年7月31日 | N-PORT |
| JFLI · J.P. Morgan Exchange-Traded Fund ... | 0.11% | 961 NS | 2026年7月31日 | N-PORT |
| ACWI · iShares Trust | 0.10% | 698778 SH | 2026年9月11日 | 每日 |
| VT · VANGUARD INTERNATIONAL EQUITY IND... | 0.10% | 1809864 SH | 2026年8月19日 | 每日 |
| DFAX · Dimensional ETF Trust | 0.08% | 170741 NS | 2026年7月31日 | N-PORT |
| INTF · iShares Trust | 0.03% | 21278 SH | 2026年9月11日 | 每日 |
| AMZA · ETFis Series Trust I | 0.02% | 1618 NS | 2026年7月31日 | N-PORT |
ENB 分析师共识 看涨和看跌分析师观点、12个月价格目标、上涨空间
12个月价格目标
4 位分析师 · 2026-09-30平均目标 $51.64 +12.3%
最新新闻 提及该公司的近期头条新闻
我的指标 您的个人关注列表 — 来自完整基本面的选定行
选择对您重要的指标 — 点击上方完整基本面中任意行的 + 号。
您的选择已保存,并会跟随您浏览所有股票。