
ENB Enbridge Inc Common Stock
NYSE · Energy · Wyświetl na SEC EDGAR ↗ zamknij Paź 2, 2026 10-K/10-Q Lip 31, 2026ENB Migawka akcji Cena, kapitalizacja rynkowa, P/E, EPS, ROE, zadłużenie/kapitał własny, zakres 52-tygodniowy
ENB Wykres ceny akcji Dzienny OHLCV ze wskaźnikami technicznymi — przesuwaj, powiększaj i dostosowuj widok
Granularność słupków dostosowuje się do wybranego okresu — najedź kursorem na wykres, aby zobaczyć otwarcia/maksima/minima/zamknięcia dla danego słupka.
| Data ex-dywidendy | Podział | Typ |
|---|---|---|
| 1 czerwca 2011 | 2-for-1 | Naprzód |
| 31 maja 2005 | 2-for-1 | Naprzód |
| 6 maja 1999 | 2-for-1 | Naprzód |
| 6 maja 1991 | 821-for-500 | Naprzód |
O Enbridge Inc Common Stock Przegląd firmy z Wikipedii
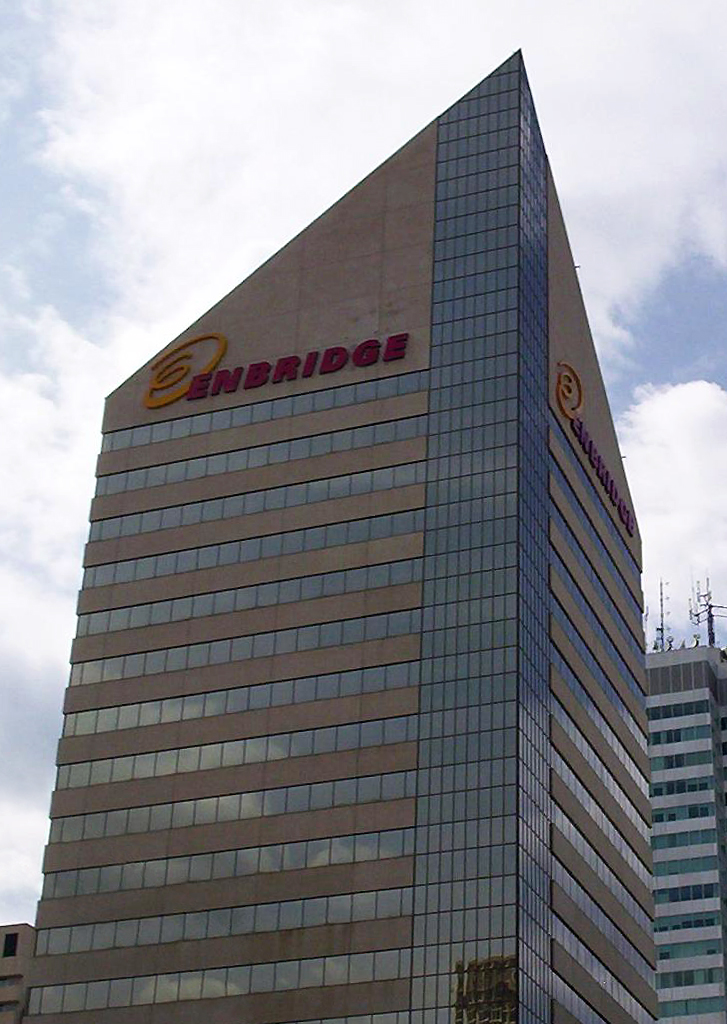
Enbridge Inc. is a Canadian pipeline and energy company headquartered in Calgary, Alberta, Canada. Enbridge owns and operates pipelines throughout Canada and the United States, transporting crude oil, natural gas, and natural gas liquids, and also generates renewable energy. Enbridge's pipeline system is the longest in North America and the largest oil export pipeline network in the world. Its crude oil system consists of 28,661 kilometres (17,809 miles) of pipelines. Its 38,300 kilometre (23,800 mile) natural gas pipeline system connects multiple Canadian provinces, several US states, and the Gulf of Mexico. The company was formed by Imperial Oil in 1949 as the Interprovincial Pipe Line Company Limited to transport Alberta oil to refineries. Over time, it has grown through acquisition of other existing pipeline companies and the expansion of their projects.
Enbridge has been responsible for several oil spills, including the Line 3 oil spill, which was the largest inland oil spill in the US, and the Kalamazoo River oil spill, which was another major inland oil spill in the US.
History
The company was initially incorporated by Imperial Oil as Interprovincial Pipe Line Company (IPL) on April 30, 1949, after Canada's first major oil discovery, in 1947, at Leduc, Alberta. In the same year, the company built its first oil pipeline from Leduc to Regina, Saskatchewan. In 1950, it was expanded through Gretna, Manitoba, to Superior, Wisconsin, in the United States. To operate the United States portion of the pipeline, the Lakehead Pipe Line Company (now Enbridge Energy Partners) was created. In 1953, the pipeline was expanded to Sarnia, Ontario, and in 1956 to Toronto and Buffalo, New York.
In 1953, IPL was listed on the Toronto and Montreal stock exchanges. In 1983, IPL built the Norman Wells pipeline and joined Frontier Pipeline Company. In 1986, through a series of stakes exchanges, IPL gained control of Home Oil and in 1988, it changed its name to Interhome Energy Inc. In 1991, it changed its name to Interprovincial Pipe Line Inc.
In 1992, Interprovincial Pipe Line Inc. was acquired by Interprovincial Pipe Line System Inc., which changed its name to IPL Energy Inc. in 1994, after the acquisition of Consumers' Gas (now Enbridge Gas Inc.) and diversification into the gas distribution business. In addition, it acquired stakes in AltaGas Services and the electric utility of Cornwall, Ontario. Through the 1990s, the company expanded its gas pipeline network and acquired a stake in the Chicap oil pipeline. It also built the Athabasca Pipeline from northeastern Alberta to the main pipeline system. In 1995, the company expanded its activities outside of North America by taking a stake in the Ocensa pipeline. This stake was sold in 2009. IPL Energy became Enbridge Inc in 1998. The Enbridge name is a portmanteau from "energy" and "bridge".
In the 2000s, Enbridge introduced several large projects. Enbridge made their first investment into renewable energy in 2002 with the purchase of a wind farm. In 2006, it announced the Enbridge Northern Gateway Pipelines Project from Athabasca to Kitimat, British Columbia. The same year, it announced the Alberta Clipper pipeline project from Hardisty, Alberta, to Superior, Wisconsin, to connect oil sands production area with the existing network. This pipeline became operational in 2010.
In 2009, Enbridge bought the Sarnia Photovoltaic Power Plant and expanded it up to 80 MW, which was the world's largest photovoltaic power station at that time.
In January 2017, Enbridge acquired Midcoast Energy Partners for $170 million in cash, and later in 2018, ArcLight acquired Midcoast Operating, L.P. from Enbridge for $1.1 billion.
Enbridge released its first annual sustainability report in 2001, and in November 2020, Enbridge expanded its environmental, social and governance (ESG) goals and targets. The company aims to achieve net-zero greenhouse gas emissions by 2050, with an interim target to reduce emissions intensity by 35% by 2030. That same year, President and CEO Al Monaco said that renewable power is now "the fourth Enbridge platform." Enbridge's ESG goals also aim to diversify its workforce with 28% representation from racial and ethnic groups and 40% from women by 2025.
In 2021, Enbridge was recognized as one of Canada's top 100 employers for the 18th time, and as one of Canada's best diversity employers for the seventh time.
In September 2023, it was announced Enbridge had agreed to acquire East Ohio Gas, Questar Gas, and Public Service Co. of North Carolina, from Dominion Energy for a total enterprise value worth $14 billion. The acquisition will result in Enbridge being the largest natural gas utility franchise in North America.
In September 2026, Enbridge announces the acquisition of Tallgrass Energy following a $2.55 billion agreement.
Merger with Spectra Energy
On September 6, 2016, Enbridge agreed to buy Spectra Energy in an all-stock deal valued at about $28 billion.
Spectra, headquartered in Houston, Texas, operated in three key areas of the natural gas industry: transmission and storage, distribution, and gathering and processing. Spectra was formed in late 2006 as a spin-off from Duke Energy. Spectra owned the Texas Eastern Pipeline (TETCo), a major natural gas pipeline transporting gas from the Gulf of Mexico coast in Texas to the New York City area; TETCo was one of the largest pipeline systems in the United States. Spectra also operated three oil pipelines, numerous other gas pipelines and was proposing to build still 3 more gas pipelines in the U.S. The merger was completed on February 27, 2017.
Operations
Crude oil and liquids pipelines
The company is the largest transporter of crude oil in Canada with 3 million barrels per day of oil and liquids. The Enbridge Pipeline System is the world's longest crude oil and liquids pipeline system, with 27,564 km (17,127 mi) of active crude pipeline in both Canada and the United States. This pipeline network delivers 3 million barrels of oil per day.
Enbridge delivered more than 3.77 billion barrels of crude oil in 2020, and more than 29.5 billion barrels over the past decade, from 2011 through 2020 inclusive.
Enbridge has several new capacities and expansion projects, including the expansion of the Alberta Clipper, replacing of Line 6B, reversal of Line 9 and others. Its Light Oil Market Access initiative is a project to deliver light crude oil from North Dakota and Western Canada to refineries in Ontario, Quebec, and the U.S. Midwest. Eastern Access, including a reversal of Line 9, is a project to deliver oil to Western Canada and Bakken to refineries in Eastern Canada and the midwest and eastern U.S. Western Gulf Coast Access, including reversal and expansion of the Seaway Pipeline and the Flanagan South Pipeline, is a plan to connect Canadian heavy oil supply to refineries along the Gulf Coast of the United States.
Enbridge's oil pipelines cross North America, with 13,833 km (8,672 mi) of active pipe in the United States and 13,681 km (8500 mi) of active pipe in Canada. The list below outlines eight of those lines.
Line 1 is a 1,767 km (1,098 mi) pipeline that starts in Enbridge's Edmonton Terminal in Alberta, and runs to its Superior Terminal in Wisconsin. On average, this pipeline delivers 237,000 barrels of light crude, natural gas liquids, and refined products daily.
Line 2A is a 966 km (600 mi) pipeline that runs from an Enbridge terminal in Edmonton, Alberta, to its Cromer Terminal in Manitoba. On average, per day this pipeline carries 442,000 barrels of condensates, light crude, and heavy crude. Line 2B is an 808 km (502 mi) pipeline that runs from the same Cromer Terminal to the Superior Terminal in Wisconsin. That pipeline delivers on average 442,000 barrels of light crude oil per day.
Line 3 is a 1,769 km (1,099 mi) pipeline that runs from the Edmonton terminal to the Superior Terminal. Over half (1,070 km) of the pipeline is located in Canada, between Alberta and Manitoba. Per day, the pipeline transports an average of 390,000 barrels of light, medium and heavy crude oil.
Line 4 is a 1,722 km (1,101 mi) crude oil pipeline starting at the Edmonton terminal to the Superior terminal. This pipeline carries, on average, 390,000 barrels of light, medium and heavy crude oil per day.
Line 5 is a 1,038 km (645 mi) crude oil pipeline running from the Superior terminal in Wisconsin to Sarnia, Ontario. On average, this pipeline moves 540,000 barrels of natural gas liquids and light crude oil per day.
Alberta clipper Pipeline (Line 67) is a 1,790 km (1,112 mi) pipeline that runs from Hardisty, Alberta to Superior, Wisconsin. An average of 800,000 barrels of heavy crude oil is moved through this pipeline per day.
Southern Lights Pipeline (Line 13) is a 2,560 km (1,591 mi) pipeline that runs from Manhattan, Illinois to the Edmonton terminal. This pipeline carries on average, 180,000 barrels of diluent per day.
Natural gas pipelines
Enbridge's pipelines transport 20% of the natural gas consumed in the United States. It owns and operates Canada's largest natural gas distribution network, providing distribution services in Ontario and Quebec. Union Gas in Ontario now fully operates under Enbridge Gas Inc. In Quebec, Enbridge has interest ownership in Gazifère.
Enbridge builds, owns and operates a network of natural gas transmission pipelines across North America, connecting the continent's natural gas supply to major markets in Canada, the United States, Mexico, and further abroad.
Enbridge's natural gas network currently covers 38,375 km (23,850 mi) across five Canadian provinces, 30 U.S. states, and offshore in the Gulf of Mexico, transporting roughly 16.2 Bcf (billions of cubic feet per day) of natural gas.
Canadian gas transmission: major assets
B.C. Pipeline (2.9 Bcf/d): this pipeline system runs from Fort Nelson in northeastern British Columbia to the U.S. border at Huntington-Sumas stretching 2,858 km (1,776 mi). It transports 60 percent of all natural gas produced in B.C., and provides natural gas service to the province as well as US states including Oregon, Idaho, and Washington.
Alliance Pipeline (1.6bcf/d): running 3,848 km (2,391 mi) from northern British Columbia across the U.S.-Canada border to Aux Sable gas processing plant in Channahon, Illinois. Enbridge owns 50 percent of the Alliance Pipeline and 42% of the Aux Sable processing facility.
U.S. gas transmission: major assets
Algonquin Gas Transmission (3.12 Bcf/d): this pipeline is 1,129 miles long, and transports natural gas to markets in New York, New Jersey, and New England.
East Tennessee (1.86 Bcf/d): a natural gas pipeline 1,526 miles long, extending from Tennessee to the Southeast and Mid-Atlantic states, ending in Virginia.
Maritimes & Northeast Pipeline: this pipeline was constructed to bring natural gas produced in Atlantic Canada through to other Canadian provinces (Nova Scotia and New Brunswick), and into U.S. states (Maine, New Hampshire, and Massachusetts).
NEXUS Gas Transmission: measuring 257 miles long, this pipeline supplies natural gas markets in the U.S. Midwest and the Dawn Hub in Ontario. This is a 50/50 joint partnership between Enbridge and DTE Energy.
Sabal Trail: carries natural gas via a 287-mile pipeline to the U.S. Southeast. This is a joint partnership between Enbridge, NextEra Energy and Duke Energy.
Southeast Supply Header (SESH) (1.09 Bcf/d): a natural gas pipeline 287 miles in length, connecting gas supply in Texas and Louisiana to other natural gas markets in the Southeast US.
Texas Eastern (12.12 Bcf/d): delivers natural gas from Texas and the Gulf Coast through 8,532 miles of pipeline to markets in the Northeastern UW including New York, Boston, and Pittsburgh.
Valley Crossing Pipeline (2.6 Bcf/d): placed into service in November 2018, this pipeline moves Texas sourced natural gas to a Mexico State-owned power utility, the Comision Federal de Electricidad (CFE).
Vector Pipeline: this pipeline acts as a connector for other pipelines including the Alliance pipeline and NEXUS Gas Transmission to the Union Gas Dawn Hub.
DCP Midstream
DCP Midstream is a joint venture between Enbridge and Phillips 66. Phillips 66 is one of the largest petroleum services companies in the US, owning and operating 39 natural gas plants and 51,000 miles of gathering pipe. Headquartered in Denver, Colorado, DCP operates a portfolio of natural gas gathering, logistics, marketing and processing services across nine states.
Renewable energy generation
Enbridge made its first investment into renewable energy in 2002 with the purchase of a wind farm. To date Enbridge has invested in 23 wind farms, 7 solar energy projects, 5 waste heat recovery facilities, 1 geothermal project, 1 power transmission project and 1 hydroelectric facility.
Enbridge has a growing interest in European offshore wind energy, and its renewable assets are part of the company's plan to achieve net-zero emissions by 2050.
Power transmission
In February 2020, Enbridge sold its shares of Montana-Alberta Tie-Line (MATL) to Berkshire Hathaway Energy. The MATL project is a 300-megawatt (MW), 230-kilovolt (kV) electrical transmission line allowing movement of power between Alberta and Montana. The MATL project, which was placed in service the fall of 2013, supports ongoing development of a rich wind-powered generation resource and allows electrical energy to flow in both directions. The transmission line is 210 miles (345 km) long and runs between the Lethbridge, Alberta area and the Great Falls, Montana area. Roughly one-third of the line is in Canada and two-thirds in the U.S.
Natural gas utility
Enbridge Gas Inc. was formed on January 1, 2019, with the combination of Enbridge Gas Distribution and Union Gas. Its network consists of 5,471 km of gas transmission lines, 66,787 km of gas distribution service lines, and 78,214 km of gas distribution main lines.
They deliver to over 15 million people in Ontario and Quebec through 3.8 million residential, commercial, industrial, and institutional meter connections and distribute roughly 2.3 bcf/d of natural gas. Additionally, in southwestern Ontario they have the largest integrated underground storage facility in Canada, and one of North America's top natural gas trading hubs.
Enbridge's natural gas distribution also includes interest ownership in two additional natural gas distributors. This includes Gazfiére, serving people in Outaouais region of Quebec, and Ènergir LP, a company that operates gas transmission, gas distribution, and power distribution throughout Quebec and Vermont.
In September 2023, Enbridge agreed to acquire three natural gas utility companies from Dominion Energy for $14 billion. The companies include the East Ohio Gas Company, Questar Gas Company, and the Public Service Company of North Carolina. These companies serve 3 million customers in the states of Ohio, Utah, Wyoming, Idaho, and North Carolina. Upon completion of the acquisition, Enbridge Gas Inc. will become the largest natural gas utility in North America supplying 9 bcf/d to 7 million customers.
Oil spills, fires, and violations
Enbridge's pipeline was responsible for the largest inland oil spill in the United States in 1991, when 1,700,000 U.S. gal (6,400 m3) of oil ruptured from a buried pipeline in Grand Rapids, Minnesota, spilling crude into a wetland and a tributary of the Mississippi River.
Using data from Enbridge's own reports, the Polaris Institute calculated that 804 spills occurred on Enbridge pipelines between 1999 and 2010. These spills released approximately 161,475 barrels (25,672.5 m3) of crude oil into the environment.
On July 4, 2002, an Enbridge pipeline ruptured in a marsh near the town of Cohasset, Minnesota, in Itasca County, spilling 6,000 barrels (950 m3) of crude oil. In an attempt to keep the oil from contaminating the Mississippi River, the Minnesota Department of Natural Resources set a controlled burn that lasted for one day and created a smoke plume about 1-mile (1.6 km) high and 5 miles (8.0 km) long.
In 2006, there were 67 reportable spills totaling 5,663 barrels (900.3 m3) on Enbridge's energy and transportation and distribution system; in 2007 there were 65 reportable spills totalling 13,777 barrels (2,190.4 m3). On March 18, 2006, approximately 613 barrels (97.5 m3) of crude oil were released when a pump failed at Enbridge's Willmar terminal in Saskatchewan. According to Enbridge, roughly half the oil was recovered.
On January 1, 2007, an Enbridge pipeline that runs from Superior, Wisconsin to near Whitewater, Wisconsin, cracked open and spilled ~50,000 US gallons (190 m3) of crude oil onto farmland and into a drainage ditch. The same pipeline was struck by construction crews on February 2, 2007, in Rusk County, Wisconsin, spilling ~201,000 US gallons (760 m3) of crude, of which about 87,000 U.S. gal (330 m3) were recovered. Some of the oil filled a hole more than 20 feet (6.1 m) deep and contaminated the local water table.
In April 2007, roughly 6,227 barrels (990.0 m3) of crude oil spilled into a field downstream of an Enbridge pumping station near Glenavon, Saskatchewan.
On November 13, 2007, Enbridge discovered a leak on their 34-inch Line 3, at Mile Post 912, near Clearbrook, Minnesota. Later, the pipeline exploded during repairs, on November 27, causing the deaths of two employees. DOT officials said that two Enbridge workers died in a crude oil explosion as they worked to make repairs on this former Lakehead system pipeline. Enbridge was cited for failing to safely and adequately perform maintenance and repair activities, clear the designated work area from possible sources of ignition, and hire properly trained and qualified workers.
In January 2009, an Enbridge pipeline leaked about 4,000 barrels (640 m3) of oil southeast of Fort McMurray at the company's Cheecham Terminal tank farm. Most of the spilled oil was contained within berms but about 1% of the oil, about 40 barrels (6.4 m3), sprayed into the air and coated nearby snow and trees.
On January 2, 2010, Enbridge's Line 2 ruptured near Neche, North Dakota, releasing about 3,784 barrels of crude oil, of which 2,237 barrels (355.7 m3) was recovered. In April 2010, an Enbridge pipeline ruptured spilling more than 9.5 barrels (1.51 m3) of oil in Virden, Manitoba. This oil leaked into the Boghill Creek, which eventually connects to the Assiniboine River.
In the July 2010 Kalamazoo River oil spill, a leaking pipeline spilled more than 1,000,000 US gallons (3,800 m3) of oil sands crude oil into Talmadge Creek leading to the Kalamazoo River in southwest Michigan on July 26, near Marshall, Michigan. A United States Environmental Protection Agency update of the Kalamazoo River spill concluded the pipeline rupture "caused the largest inland oil spill in Midwest history" and reported the cost of the cleanup at $36.7 million (US) as of November 14, 2011. PHMSA raised concerns in a Corrective Action Order (CAO) about numerous anomalies that had been detected on this pipeline by internal line inspection tools, yet Enbridge had failed to check a number of those anomalies in the field. The Michigan spill affected more than 31 miles (50 km) of waterways and wetlands and about 320 people reported symptoms from crude oil exposure. The National Transportation Safety Board said at $800 million, it was the costliest onshore spill cleanup in U.S. history. The NTSB found Enbridge knew of a defect in the pipeline five years before it burst. In June 2013, a Kalamazoo man lodged himself into an Enbridge pipeline in Marshall, MI to protest Enbridge's lack of accountability for the 2010 spill and to encourage landowners along Enbridge's Line 6B expansion to offer increased resistance to construction in 2013. In 2014, Enbridge completed cleanup of the river per the EPA's order.
On September 9, 2010, a broken water line caused a rupture on Enbridge's Line 6A pipeline near Romeoville, Illinois, releasing an estimated 7,500 barrels (1,190 m3) of oil into the surrounding area.
On July 27, 2012, an Enbridge crude oil pipeline ruptured in Grand Marsh, Wisconsin, releasing an estimated 50,000 gallons of crude oil. The pipeline had been installed in 1998. Flaws in the longitudinal welds had been seen during X-ray checks of girth welds.
On June 22, 2013, Enbridge subsidiary Athabasca pipelines reported a pipeline leak of approximately 750 barrels of light synthetic crude oil from Line 37 near Enbridge's Cheecham, Alberta, terminal about 70 kilometres (43 mi) southeast of Fort McMurray. The 17-kilometre-long, 12-inch diameter pipe was constructed in 2006 and links the Long Lake oilsands upgrader to the Cheetham terminal as part of Enbridge's Athabasca system. Unusually heavy rainfall in the region, also responsible for the 2013 Alberta floods, may have caused "ground movement on the right-of way that may have impacted the pipeline." Enbridge's Athabasca (Line 19) shares a portion of right of way with Line 37 and Enbridge's Wood Buffalo/Waupisoo (Line 75/18), a major part of the network that serves Alberta's oilsands. All three lines were closed down as a precautionary measure. Operations between Hardisty and Cheecham were restored on June 23 when Enbridge's Athabasca pipeline (Line 19) was restored to service.
On July 1, 2013, WWMT News in Michigan reported that the Michigan Department of Environmental Quality had issued a citation against Enbridge for contamination of North Ore Creek by an Enbridge pipeline maintenance activity.
On January 30, 2017, a road crew in Texas punctured the Seaway S-1 crude oil pipeline, which is jointly owned by Enterprise Products Partners and Enbridge through the joint venture Seaway Crude Pipeline Company. Two days later, it was unclear how much oil had spilled over the nearby Highway 121 northeast of Dallas. After the incident, supply concerns reportedly helped push "oil prices 2% higher in early trading to nearly $54 a barrel."
On October 9, 2018, Enbridge's Westcoast Pipeline exploded in Shelley, British Columbia, sparking a massive fireball and leading to shortages of natural gas throughout British Columbia.
On April 26, 2019, an Enbridge 20 inch diameter pipeline was found to be leaking at a valve, in Fort Atkinson, Wisconsin. Up to 1,386 gallons of liquids leaked from the valve, causing contamination of groundwater & soil. The Wisconsin Department of Natural Resources was not notified of this leak until July 31, 2020, with Enbridge claiming they thought this was smaller than the reporting size limit.
On August 1, 2019, a Texas Eastern Transmission, LP, a division of Enbridge, 30-inch gas transmission pipeline exploded and burned in Stanford, Kentucky. One person was killed, and five others were injured. Five homes were destroyed and at least four were damaged in the Indian Camp mobile home park in Stanford, where the explosion occurred. Flames reached more than 300 feet hig, and melted tar on nearby roads, officials said.
On November 11, 2024 Enbridge's Line 6 pipeline spilled 69,300 gallons of crude oil underground. According to Enbridge, the spilt oil was a result of a faulty connection on a pump transfer pipe. An Enbridge technician was the first to discover the spill in Oakland, Jefferson County, Wisconsin. Enbridge in response started soil removal in polluted areas from the spill.
Protests
In May 2012, West Coast First Nations members and supporters protested near Enbridge's Annual Shareholder's meeting, against the proposed Northern Gateway Project and on May 31, 2012, the Vancouver Observer reported about 40 protesters outside the Canadian Oil and Gas Export Summit, protesting the proposed Enbridge Northern Gateway Project.
On July 17, 2012, a group calling itself "We are the Kalamazoo" protested against Enbridge's response to the Kalamazoo spill and its plans to construct the line 6B pipeline. This protest was on the second anniversary of the Kalamazoo spill.
On November 12, 2012, the Lansing State Journal reported that the head of the Line 6B Pipeline project stated that he had never seen as much organized landowner resistance despite 30 years in the pipeline industry. They noted that this was probably because of the 2010 Kalamazoo River spill.
In May 2013, Hamilton area residents protested the reversal of flow in Line 9 and temporarily closed Ontario Highway 6. Later that year, on June 6, 2013, a group called Hamilton 350 sent a letter of complaint to the Hamilton (Ontario) police service (HPS) for accepting over $44,000 in donations from Enbridge. The letter questions whether police officers would be impartial during any anti-Enbridge protests, given the donation.
On June 26, 2013, Hamilton Police arrested at least 10 people who occupied an Enbridge compound for six days to protest the expansion of Enbridge's Line 9 and intent to ship diluted bitumen through the line.
On July 22, 2013, a group of protesters locked themselves to equipment at an Enbridge pipeline construction site in Stockbridge, Michigan. Protesters stated that they had to take matters into their own hands given that state regulators were failing the public, "We felt that there was no other option."
A September 16, 2013, "Inside Climate News" report by journalist David Hasemeyer describes how many Michigan landowners are concerned about the safety of new Enbridge pipeline being laid within a few feet of their homes, and the lack of regulations for how close a pipeline can be constructed to an existing home. The article quotes Richard Kuprewicz, President of an engineering consulting company and an adviser to Pipeline Hazardous Materials Administration: "Clearly the pipeline safety regulations aren't adequate in this area and the siting regulations aren't adequate," Kuprewicz said. "It's a bad combination."
In September 2016, a group of Native Americans protested the construction of the Dakota Access Pipeline, which Enbridge had announced plans to acquire a portion of in a $2 billion deal.
In November 2020, Michigan Governor Gretchen Whitmer revoked a 1953 easement for an Enbridge pipeline connecting two parts of the Great Lakes through the Straits of Mackinac.
In June 2021, Enbridge resumed construction on the Line 3 replacement project in Northern Minnesota after taking a brief planned break. Enbridge's plans to expand its Line 3 pipeline in Minnesota along a new route have been met with prolonged resistance from Native communities and activists calling themselves water protectors.
In January 2022, a group of about 400 met in front of a Bank of America location in Austin to protest Enbridge's plans to expand the Moda Ingleside Energy Center onto historic Karankawa land in Corpus Christi, Texas.
In September, 2023, in a trial flawed by numerous protocol breaches on the part of the prosecution and local authorities, Mylene Vialard was found guilty of felony obstruction. According to the article, Vialard was among more than a thousand arrests by Minnesota law enforcement – which along with other agencies received at least $8.6m in payments from Enbridge.
In 2024, the film Bad River was released. The film documented Enbridge's trespassing on the Bad River reservation with Line 5 and the local community's struggle to get the pipeline removed. It also covered how Enbridge attempted to influence the Bad River tribal elections.
Technology and innovation
Enbridge has two Technology and Innovation labs. In January 2019, the first lab opened in Calgary, Alberta. In April 2019, the second lab opened in Houston, Texas. The labs use industrial predictive algorithms, machine learning, and sentiment analysis to find efficiencies within the company and help improve safety and reliability of their pipeline infrastructure.
The labs have developed ways to get sensor data from pipelines, helping to improve flows of natural gas and crude oil terminals. Additionally, the labs have helped enhance pipeline leak detection, and ensure better maintenance schedules. For renewable energy projects, the labs have developed different ways to reposition wind turbine blades to help maximize wind power generation.
Financials
Dollar amounts in millions of Canadian dollars unless otherwise noted, with the exception of employee numbers. Additionally, earnings are after income tax and unadjusted. Employee count is approximate and includes both permanent and temporary employees.
Leadership
President
Dr Oliver Baker Hopkins, 1949–1951
Thomas Stuart Johnston, 1951–1967
David George Waldon, 1967–1977
Robert Kneeland Heule, 1977–1985
George Edward Courtnage, 1985–1986
Richard Francis Haskayne, 1987–1991
Brian Frederick MacNeill, 1991–2000
Patrick Darold Daniel, 2000–2012
Albert Monaco, 2012–2023
Gregory Lorne Ebel, 2023–2026
Michele Harradence, 2027–present
Chairman of the Board
Thomas Stuart Johnston, 1967–1968
David George Waldon, 1977–1978
Robert Kneeland Heule, 1985–1989
Richard Francis Haskayne, 1989–1991
Hugh Gordon MacNeill, 1991–1996
Donald James Taylor, 1996–2005
David Allen Arledge, 2005–2017
Gregory Lorne Ebel, 2017–2022
Pamela Lynn Carter, 2023–2025
Steven Walter Williams, 2025–present
Źródło: Wikipedia (Angielski), CC BY-SA 4.0 · Zobacz w Wikipedii ↗
Wyniki 10-letnie Trendy przychodów, zysku netto, marż i EPS
Wycena Wskaźniki P/E, P/S, P/B, EV/EBITDA — czy akcje są drogie, czy tanie?
| Wskaźnik | Trend 5-letni | ENB | średnia z 5 lat | Mediana porównawcza | Werdykt |
|---|---|---|---|---|---|
| P/E (TTM) | 17.7średnia z 5 lat ≈18.0 | ≈18.0 | · | · | |
| P/S (TTM) | 1.2 | · | · | · | |
| P/B (MRQ) | 1.5 | · | · | · | |
| Cena / FCF (TTM) | 60.2 | · | · | · | |
| Cena / Przepływy pieniężne (TTM) | 8.1 | · | · | · | |
| Cena / Wartość księgowa materialna (MRQ) | 1.6średnia z 5 lat ≈3.6 | ≈3.6 | · | · | |
| PEG Ratio (Współczynnik PEG) | ≈1.1 | · | · | · |
Mediana porównawcza jest obliczana na znormalizowanej podstawie dla każdej metryki i może nie zawsze odpowiadać podstawie TTM/MRQ pokazanej dla tej akcji.
Rentowność Marże brutto, operacyjne i netto; ROE, ROA, ROIC
| Wskaźnik | Trend 5-letni | ENB | średnia z 5 lat | Mediana porównawcza | Werdykt |
|---|---|---|---|---|---|
| Marża Operacyjna (TTM) | 13.3% | · | · | · | |
| Marża EBITDA (TTM) | 20.2% | · | · | · | |
| Marża przed opodatkowaniem (TTM) | 9.6% | · | · | · | |
| Marża Zysku Netto (TTM) | 7.3% | · | · | · | |
| ROA (TTM) | 2.8% | · | · | · | |
| ROE (TTM) | 9.4% | · | · | · |
Zdrowie finansowe Dług, płynność, wypłacalność — siła bilansu
| Wskaźnik | Trend 5-letni | ENB | średnia z 5 lat | Mediana porównawcza | Werdykt |
|---|---|---|---|---|---|
| Dług / Kapitał Własny (MRQ) | 0.0 | · | · | · | |
| Wskaźnik bieżący (MRQ) | 0.7 | · | · | · |
Rozwój Wzrost przychodów, EPS i zysku netto: r/r, CAGR 3-letni, CAGR 5-letni
| Wskaźnik | Trend 5-letni | ENB | średnia z 5 lat | Mediana porównawcza | Werdykt |
|---|---|---|---|---|---|
| Revenue YoY (Przychody R/R) | 21.9%średnia z 5 lat ≈12.0% | ≈12.0% | · | · | |
| Revenue CAGR 3Y (Przychody CAGR 3L) | 6.9%średnia z 5 lat ≈5.0% | ≈5.0% | · | · | |
| Revenue CAGR 5Y (Przychody CAGR 5L) | 10.8% | · | · | · | |
| EPS YoY | 37.6%średnia z 5 lat ≈36.1% | ≈36.1% | · | · | |
| Net Income YoY (Zysk Netto R/R) | 37.7%średnia z 5 lat ≈32.9% | ≈32.9% | · | · | |
| EPS CAGR 3Y (CAGR z EPS 3 lata) | 36.0%średnia z 5 lat ≈17.9% | ≈17.9% | · | · | |
| EPS CAGR 5Y (CAGR z EPS 5 lat) | 16.8% | · | · | · | |
| Net Income CAGR 3Y (CAGR z zysku netto 3 lata) | 35.6%średnia z 5 lat ≈18.0% | ≈18.0% | · | · | |
| Net Income CAGR 5Y (CAGR z zysku netto 5 lat) | 17.4% | · | · | · |
Efektywność kapitałowa Rotacja aktywów, rotacja zapasów, rotacja należności
| Wskaźnik | Trend 5-letni | ENB | średnia z 5 lat | Mediana porównawcza | Werdykt |
|---|---|---|---|---|---|
| Revenue / Employee (Przychody / pracownika) | ≈$4.4M | · | · | · |
wartość · ≈ średnia z 5 lat · mediana branżowa · werdykt względem mediany
Dywidendy Stopa dywidendy, wskaźnik wypłaty, historia dywidend, 5-letni CAGR
| Data ex-dywidendy | Kwota | Waluta | Stopa zwrotu |
|---|---|---|---|
| Sie 14, 2026 | $0,70 | USD | ≈5.5% |
| Maj 15, 2026 | $0,71 | USD | ≈3.8% |
| Lut 17, 2026 | $0,71 | USD | ≈4.0% |
| Sie 15, 2025 | $0,68 | USD | ≈5.7% |
| Maj 15, 2025 | $0,68 | USD | ≈5.9% |
| Lut 14, 2025 | $0,67 | USD | ≈6.2% |
| Lis 15, 2024 | $0,65 | USD | ≈6.3% |
| Sie 15, 2024 | $0,67 | USD | ≈6.9% |
| Maj 14, 2024 | $0,67 | USD | ≈7.2% |
| Lut 14, 2024 | $0,68 | USD | ≈7.9% |
| Lis 14, 2023 | $0,64 | USD | ≈7.9% |
| Sie 14, 2023 | $0,66 | USD | ≈7.4% |
| Maj 12, 2023 | $0,66 | USD | ≈6.9% |
| Lut 14, 2023 | $0,67 | USD | ≈6.7% |
| Lis 14, 2022 | $0,65 | USD | ≈6.6% |
| Sie 12, 2022 | $0,67 | USD | ≈6.1% |
| Maj 12, 2022 | $0,66 | USD | ≈6.3% |
| Lut 14, 2022 | $0,68 | USD | ≈6.5% |
| Lis 12, 2021 | $0,66 | USD | ≈6.6% |
| Sie 12, 2021 | $0,67 | USD | ≈6.7% |
Historia zysków EPS faktyczny vs szacowany, zaskoczenie %, wskaźnik trafień, data następnych wyników
| Okres | Raport | EPS Actual | EPS Szacowany | Niespodzianka |
|---|---|---|---|---|
| 30 czerwca 2026 | $0.63 | $0.59 | 6.1% | |
| 31 marca 2026 | $0.98 | $0.95 | 3.1% | |
| 31 grudnia 2025 | $0.88 | $0.78 | 12.6% | |
| 30 września 2025 | $0.46 | $0.52 | -11.4% | |
| 30 czerwca 2025 | $0.65 | $0.58 | 12.3% | |
| 31 marca 2025 | $1.03 | $0.97 | 6.4% |
Pełne podstawowe wskaźniki Wszystkie wskaźniki roczne — rachunek zysków i strat, bilans, przepływy pieniężne
Rachunek zysków i strat
| Wskaźnik | Trend | 2025 | 2024 | 2023 | 2022 | 2021 | 2020 | 2019 | 2018 | 2017 | 2016 | 2015 |
|---|---|---|---|---|---|---|---|---|---|---|---|---|
| Revenue | $65.19B | $53.47B | $43.65B | $53.31B | $47.07B | $39.09B | $50.07B | $46.38B | $44.38B | $34.56B | $33.79B | |
| Cost of Revenue | · | · | $21.37B | $32.59B | $28.70B | $20.67B | $31.00B | $29.40B | $28.64B | $24.00B | $25.24B | |
| SG&A Expense | $9.97B | $9.43B | $8.60B | $8.22B | $6.71B | $6.75B | $6.99B | $6.79B | $6.44B | $4.36B | $4.13B | |
| Operating Expenses | $54.24B | $43.82B | $35.00B | $48.13B | $39.27B | $31.13B | $41.81B | $41.56B | $42.81B | $31.98B | $31.93B | |
| Operating Income | $10.96B | $9.65B | $8.65B | $5.18B | $7.80B | $7.96B | $8.26B | $4.82B | $1.57B | $2.58B | $1.86B | |
| Interest Expense | $5.02B | $4.42B | $3.81B | $3.18B | $2.65B | $2.79B | $2.66B | $2.70B | $2.56B | $1.59B | $1.62B | |
| Other Non-op | $1.63B | $-1.33B | $1.22B | $-589M | $979M | $238M | $258M | $516M | $199M | $93M | $88M | |
| Pretax Income | $9.79B | $7.30B | $7.88B | $4.54B | $7.73B | $4.19B | $7.54B | $3.57B | $569M | $2.45B | $11M | |
| Income Tax | $2.00B | $1.67B | $1.82B | $1.60B | $1.42B | $774M | $1.71B | $237M | $-2.70B | $142M | $170M | |
| Net Income | $7.49B | $5.44B | $6.19B | $3.00B | $6.19B | $3.36B | $5.71B | $2.88B | $2.86B | $2.07B | $251M | |
| EPS (Basic) | $3.23 | $2.34 | $2.84 | $1.28 | $2.87 | $1.48 | $2.64 | $1.46 | $1.66 | · | · | |
| EPS (Diluted) | $3.22 | $2.34 | $2.84 | $1.28 | $2.87 | $1.48 | $2.63 | $1.46 | $1.65 | · | · | |
| Shares (Basic) | 2,180,000,000 | 2,155,000,000 | 2,056,000,000 | 2,025,000,000 | 2,023,000,000 | 2,020,000,000 | 2,017,000,000 | 1,724,000,000 | 1,525,000,000 | 911,000,000 | 847,000,000 | |
| Shares (Diluted) | 2,186,000,000 | 2,158,000,000 | 2,058,000,000 | 2,029,000,000 | 2,025,000,000 | 2,021,000,000 | 2,020,000,000 | 1,727,000,000 | 1,532,000,000 | 918,000,000 | 847,000,000 | |
| EBITDA | · | · | · | · | · | · | · | $8.06B | $4.73B | · | · |
Bilans
| Wskaźnik | Trend | 2025 | 2024 | 2023 | 2022 | 2021 | 2020 | 2019 | 2018 | 2017 | 2016 | 2015 |
|---|---|---|---|---|---|---|---|---|---|---|---|---|
| Cash & Equivalents | $1.09B | $1.80B | $5.90B | $861M | $286M | $452M | $648M | $518M | $480M | $1.49B | $654M | |
| Inventory | $1.62B | $1.49B | $1.48B | $2.25B | $1.67B | $1.54B | $1.30B | $1.34B | $1.53B | $1.23B | · | |
| Other Current Assets | $3.23B | $2.77B | $2.44B | $3.25B | · | · | · | · | · | · | · | |
| Current Assets | $13.20B | $13.16B | $14.40B | $12.15B | $8.96B | $7.35B | $8.71B | $8.57B | $9.21B | $7.79B | · | |
| PP&E (Net) | $131.60B | $131.10B | $104.64B | $104.46B | $100.07B | $94.57B | $93.72B | $94.54B | $90.71B | $64.28B | · | |
| PP&E (Gross) | · | · | · | · | · | $117.95B | $113.96B | $112.40B | $105.81B | $78.89B | · | |
| Accum. Depreciation | · | · | · | · | · | $23.38B | $20.24B | $17.86B | $15.10B | $14.61B | · | |
| Goodwill | $35.28B | $36.60B | $31.85B | $32.44B | $32.77B | $32.69B | $33.15B | $34.46B | $34.46B | $78M | · | |
| Intangibles | $3.99B | $4.59B | $3.54B | $4.02B | $4.01B | $2.08B | $2.17B | $2.37B | $3.27B | $1.57B | · | |
| Total Assets | $218.47B | $218.97B | $180.32B | $179.61B | $168.86B | $160.28B | $163.16B | $166.91B | $162.09B | $85.21B | · | |
| Accrued Liabilities | · | · | · | $5.24B | $4.47B | $3.50B | $4.54B | $4.60B | $5.13B | $3.72B | · | |
| Short-term Debt | $1.03B | $529M | $400M | $2.00B | $1.51B | $1.12B | $898M | $1.02B | $1.44B | $351M | · | |
| Current Liabilities | $21.00B | $23.81B | $17.43B | $20.30B | $18.23B | $13.98B | $15.90B | $14.86B | $14.62B | $12.34B | · | |
| Capital Leases | $587M | $738M | $652M | $677M | $612M | $681M | $689M | · | · | · | · | |
| Deferred Tax | $20.28B | $19.60B | $15.03B | $13.78B | $11.69B | $10.33B | $9.87B | $9.45B | $9.29B | $6.04B | · | |
| Other Non-current Liabilities | $12.30B | $13.26B | $8.65B | $9.19B | $7.62B | $8.78B | $8.32B | $8.83B | $7.51B | $4.98B | · | |
| Total Liabilities | $152.55B | $150.08B | $115.83B | $116.21B | $105.50B | $95.91B | $93.75B | $93.47B | $92.29B | $59.85B | · | |
| Long-term Debt | $104.41B | $101.82B | $80.44B | $78.74B | $73.81B | $65.36B | $63.59B | $62.97B | $62.93B | · | · | |
| Total Debt | · | · | · | · | · | · | · | $1.02B | $1.44B | · | · | |
| Common Stock | $71.88B | $71.74B | $69.18B | $64.76B | $64.80B | $64.77B | $64.75B | $64.68B | $50.74B | $10.49B | · | |
| Paid-in Capital | $242M | $275M | $268M | $275M | $365M | $277M | $187M | $0 | $3.19B | $3.40B | · | |
| Retained Earnings | $-21.28B | $-20.05B | $-17.11B | $-15.49B | $-10.99B | $-9.99B | $-6.31B | $-5.54B | $-2.47B | $-716M | · | |
| AOCI | $4.68B | $7.12B | $2.30B | $3.52B | $-1.10B | $-1.40B | $-272M | $2.67B | $-973M | $1.06B | · | |
| Stockholders' Equity | $62.33B | $65.90B | $61.45B | $59.89B | $60.83B | $61.37B | $66.04B | $69.47B | $58.13B | $21.39B | · | |
| Liabilities + Equity | $218.47B | $218.97B | $180.32B | $179.61B | $168.86B | $160.28B | $163.16B | $166.91B | $162.09B | $85.21B | · | |
| Shares Outstanding | 2,182,000,000 | 2,178,000,000 | 2,125,000,000 | 2,025,000,000 | 2,026,000,000 | 2,026,000,000 | 2,025,000,000 | 2,022,000,000 | 1,695,000,000 | 943,000,000 | 868,000,000 |
Przepływy pieniężne
| Wskaźnik | Trend | 2025 | 2024 | 2023 | 2022 | 2021 | 2020 | 2019 | 2018 | 2017 | 2016 | 2015 |
|---|---|---|---|---|---|---|---|---|---|---|---|---|
| D&A | $5.66B | $5.17B | $4.61B | $4.32B | $3.85B | $3.71B | $3.39B | $3.25B | $3.16B | $2.24B | $2.02B | |
| Deferred Tax | $1.02B | $719M | $1.42B | $957M | $1.09B | $447M | $1.16B | $-148M | $-2.88B | $43M | $7M | |
| Amort. of Intangibles | $534M | $530M | $535M | $483M | $348M | $294M | $296M | $281M | $280M | $177M | $158M | |
| Other Non-cash | · | · | · | · | · | · | · | $5.44B | $3.12B | · | · | |
| Operating Cash Flow | $12.27B | $12.60B | $14.20B | $11.23B | $9.26B | $9.78B | $9.40B | $10.50B | $6.66B | $5.21B | $4.57B | |
| CapEx | $8.97B | $6.71B | $4.65B | $4.65B | $7.82B | $5.41B | $5.49B | $6.81B | $8.29B | $5.13B | $7.27B | |
| Investing Cash Flow | $-10.50B | $-20.36B | $-6.04B | $-5.27B | $-10.66B | $-5.18B | $-4.66B | $-3.02B | $-11.04B | $-5.15B | $-7.93B | |
| Debt Issued | · | · | · | · | $8.03B | $5.23B | $6.18B | $3.54B | $9.48B | $4.08B | $3.77B | |
| Net Debt Issued | · | · | · | · | · | · | · | $-908M | $4.43B | · | · | |
| Stock Issued | $28M | $2.48B | $4.45B | $3M | $5M | $5M | $18M | $21M | $1.55B | $2.26B | $57M | |
| Stock Repurchased | $0 | $0 | $125M | $151M | $0 | $0 | · | · | · | · | · | |
| Net Stock Activity | · | · | · | · | · | · | · | $21M | $1.50B | · | · | |
| Dividends Paid | $8.22B | $7.88B | $7.28B | $6.97B | $6.77B | $6.56B | $5.97B | $3.48B | $2.75B | $1.15B | · | |
| Financing Cash Flow | $-2.40B | $3.54B | $-2.86B | $-5.43B | $1.24B | $-4.77B | $-4.75B | $-7.50B | $3.48B | $840M | $3.07B | |
| Net Change in Cash | $-680M | $-3.98B | $5.08B | $587M | $-170M | $-186M | $39M | $50M | $-975M | $874M | $-145M | |
| Taxes Paid | $1.21B | $861M | $578M | $495M | $489M | $524M | $571M | $277M | $172M | $194M | $80M | |
| Free Cash Flow | · | · | · | · | · | · | · | $3.70B | $-1.70B | · | · | |
| Levered FCF | · | · | · | · | · | · | · | $1.17B | $-16.37B | · | · |
Rentowność
| Wskaźnik | Trend | 2025 | 2024 | 2023 | 2022 | 2021 | 2020 | 2019 | 2018 | 2017 | 2016 | 2015 |
|---|---|---|---|---|---|---|---|---|---|---|---|---|
| Operating Margin | · | · | · | · | · | · | · | 10.4% | 3.5% | · | · | |
| Net Margin | · | · | · | · | · | · | · | 6.2% | 6.4% | · | · | |
| Pretax Margin | · | · | · | · | · | · | · | 7.7% | 1.3% | · | · | |
| EBITDA Margin | · | · | · | · | · | · | · | 17.4% | 10.7% | · | · | |
| ROA | · | · | · | · | · | · | · | 1.8% | 2.3% | · | · | |
| ROE | · | · | · | · | · | · | · | 4.5% | 7.2% | · | · | |
| ROIC | · | · | · | · | · | · | · | 6.4% | 15.1% | · | · |
Płynność i wypłacalność
| Wskaźnik | Trend | 2025 | 2024 | 2023 | 2022 | 2021 | 2020 | 2019 | 2018 | 2017 | 2016 | 2015 |
|---|---|---|---|---|---|---|---|---|---|---|---|---|
| Current Ratio | · | · | · | · | · | · | · | 0.6 | 0.6 | · | · | |
| Quick Ratio | · | · | · | · | · | · | · | 0.0 | 0.0 | · | · | |
| Debt / Equity | · | · | · | · | · | · | · | 0.0 | 0.0 | · | · | |
| Interest Coverage | · | · | · | · | · | · | · | 1.8 | 0.6 | · | · |
Efektywność
| Wskaźnik | Trend | 2025 | 2024 | 2023 | 2022 | 2021 | 2020 | 2019 | 2018 | 2017 | 2016 | 2015 |
|---|---|---|---|---|---|---|---|---|---|---|---|---|
| Asset Turnover | · | · | · | · | · | · | · | 0.3 | 0.4 | · | · | |
| Inventory Turnover | · | · | · | · | · | · | · | 20.5 | 20.7 | · | · |
Na akcję
| Wskaźnik | Trend | 2025 | 2024 | 2023 | 2022 | 2021 | 2020 | 2019 | 2018 | 2017 | 2016 | 2015 |
|---|---|---|---|---|---|---|---|---|---|---|---|---|
| Book Value / Share | · | · | · | · | · | · | · | $34.36 | $34.30 | · | · | |
| Revenue / Share | · | · | · | · | · | · | · | $26.85 | $28.97 | · | · | |
| Cash Flow / Share | · | · | · | · | · | · | · | $6.08 | $4.30 | · | · | |
| Cash / Share | · | · | · | · | · | · | · | $0.26 | $0.28 | · | · | |
| Dividend Paid / Share | $3.77 | $3.66 | $3.55 | $3.44 | $3.34 | $3.24 | $2.95 | $2.68 | $2.41 | $2.12 | $1.86 | |
| EPS (TTM) | $3.22 | $2.34 | $2.84 | $1.28 | $2.87 | $1.48 | $2.63 | $1.46 | $1.65 | · | · |
Stopy Wzrostu
| Wskaźnik | Trend | 2025 | 2024 | 2023 | 2022 | 2021 | 2020 | 2019 | 2018 | 2017 | 2016 | 2015 |
|---|---|---|---|---|---|---|---|---|---|---|---|---|
| Revenue YoY | 21.9% | 22.5% | -18.1% | 13.2% | 20.4% | · | · | · | · | · | · | |
| Revenue CAGR 3Y | 6.9% | 4.3% | 3.8% | · | · | · | · | · | · | · | · | |
| Revenue CAGR 5Y | 10.8% | · | · | · | · | · | · | · | · | · | · | |
| EPS YoY | 37.6% | -17.6% | 121.9% | -55.4% | 93.9% | · | · | · | · | · | · | |
| EPS CAGR 3Y | 36.0% | -6.6% | 24.3% | · | · | · | · | · | · | · | · | |
| EPS CAGR 5Y | 16.8% | · | · | · | · | · | · | · | · | · | · | |
| Net Income YoY | 37.7% | -12.1% | 106.2% | -51.5% | 84.0% | · | · | · | · | · | · | |
| Net Income CAGR 3Y | 35.6% | -4.2% | 22.6% | · | · | · | · | · | · | · | · | |
| Net Income CAGR 5Y | 17.4% | · | · | · | · | · | · | · | · | · | · | |
| Dividends Paid CAGR 5Y | 4.6% | · | · | · | · | · | · | · | · | · | · |
Wycena (TTM)
| Wskaźnik | Trend | 2025 | 2024 | 2023 | 2022 | 2021 | 2020 | 2019 | 2018 | 2017 | 2016 | 2015 |
|---|---|---|---|---|---|---|---|---|---|---|---|---|
| Revenue TTM | $65.19B | $53.47B | $43.65B | $53.31B | $47.07B | $39.09B | $50.07B | $46.38B | $44.38B | · | · | |
| Net Income TTM | $7.49B | $5.44B | $6.19B | $3.00B | $6.19B | $3.36B | $5.71B | $2.88B | $2.86B | · | · | |
| Market Cap | · | · | · | · | · | · | · | $62.84B | $66.29B | · | · | |
| Enterprise Value | · | · | · | · | · | · | · | $63.35B | $67.26B | · | · | |
| P/E | 14.9 | 18.1 | 12.7 | 30.5 | 13.6 | 21.6 | 15.1 | 21.3 | 23.7 | · | · | |
| P/S | · | · | · | · | · | · | · | 1.4 | 1.5 | · | · | |
| P/B | · | · | · | · | · | · | · | 0.9 | 1.1 | · | · | |
| P / Tangible Book | 4.5 | 3.7 | 2.9 | 3.4 | 3.3 | 2.4 | · | · | · | · | · | |
| P / Cash Flow | · | · | · | · | · | · | · | 6.0 | 10.1 | · | · | |
| P / FCF | · | · | · | · | · | · | · | 17.0 | -38.9 | · | · | |
| EV / EBITDA | · | · | · | · | · | · | · | 7.9 | 14.2 | · | · | |
| EV / FCF | · | · | · | · | · | · | · | 17.1 | -39.5 | · | · | |
| EV / Revenue | · | · | · | · | · | · | · | 1.4 | 1.5 | · | · | |
| Dividend Yield | · | · | · | · | · | · | · | 5.5% | 4.2% | · | · | |
| Earnings Yield | 6.7% | 5.5% | 7.9% | 3.3% | 7.3% | 4.6% | 6.6% | 4.7% | 4.2% | · | · | |
| Payout Ratio | · | · | · | · | · | · | · | 120.8% | 122.4% | · | · | |
| Annual Payout | $8.22B | $7.88B | $7.28B | $6.97B | $6.77B | $6.56B | $5.97B | $3.48B | $2.75B | · | · |
Rachunek zysków i strat
| Wskaźnik | Trend | Q2 2026 | Q1 2026 | Q4 2025 | Q3 2025 | Q2 2025 | Q1 2025 | Q4 2024 | Q3 2024 | Q2 2024 | Q1 2024 | Q4 2023 | Q3 2023 | Q2 2023 | Q1 2023 | Q4 2022 | Q3 2022 |
|---|---|---|---|---|---|---|---|---|---|---|---|---|---|---|---|---|---|
| Revenue | $29.32B | $22.36B | $17.18B | $14.64B | $14.88B | $18.50B | $16.22B | $14.88B | $11.34B | $11.04B | $11.30B | $9.84B | $10.43B | $12.07B | $13.42B | $11.57B | |
| Cost of Revenue | · | · | · | · | · | · | · | $9.07B | $5.48B | $5.00B | · | $4.83B | $4.92B | $6.23B | · | $6.63B | |
| SG&A Expense | $2.36B | $2.57B | $2.71B | $2.48B | $2.31B | $2.47B | $2.70B | $2.28B | $2.31B | $2.13B | $2.48B | $2.06B | $2.03B | $2.04B | $2.26B | $2.09B | |
| Operating Expenses | $26.41B | $19.13B | $14.45B | $12.37B | $12.59B | $14.83B | $13.77B | $12.66B | $9.06B | $8.33B | $9.45B | $8.05B | $8.08B | $9.41B | $13.96B | $9.79B | |
| Operating Income | $2.91B | $3.23B | $2.73B | $2.27B | $2.29B | $3.67B | $2.45B | $2.22B | $2.27B | $2.71B | $1.84B | $1.79B | $2.35B | $2.66B | $-540M | $1.78B | |
| Interest Expense | · | · | · | · | · | · | · | · | · | $905M | $1.10B | $921M | $883M | $905M | $863M | $806M | |
| Other Non-op | $-35M | $-179M | $442M | $-297M | $1.37B | $120M | $-1.12B | $376M | $-31M | $-551M | $1.01B | $-465M | $575M | $102M | $335M | $-883M | |
| Pretax Income | $2.01B | $2.37B | $2.46B | $1.16B | $2.99B | $3.19B | $849M | $1.76B | $2.74B | $1.95B | $2.23B | $751M | $2.52B | $2.38B | $-549M | $1.70B | |
| Income Tax | $442M | $587M | $325M | $316M | $666M | $697M | $231M | $312M | $739M | $386M | $664M | $128M | $519M | $510M | $560M | $318M | |
| Net Income | $1.50B | $1.78B | $2.06B | $788M | $2.28B | $2.36B | $595M | $1.39B | $1.94B | $1.51B | $1.82B | $621M | $1.94B | $1.82B | $-983M | $1.36B | |
| EPS (Basic) | $0.64 | $0.77 | $0.89 | $0.30 | $1.00 | $1.04 | $0.23 | $0.59 | $0.86 | $0.67 | $0.81 | $0.26 | $0.91 | $0.86 | $-0.52 | $0.63 | |
| EPS (Diluted) | $0.64 | $0.76 | $0.89 | $0.30 | $1.00 | $1.03 | $0.23 | $0.59 | $0.86 | $0.67 | $0.82 | $0.26 | $0.91 | $0.85 | $-0.52 | $0.63 | |
| Shares (Basic) | 2,184,000,000 | 2,182,000,000 | · | 2,181,000,000 | 2,180,000,000 | 2,179,000,000 | · | 2,177,000,000 | 2,137,000,000 | 2,126,000,000 | · | 2,048,000,000 | 2,024,000,000 | 2,025,000,000 | · | 2,025,000,000 | |
| Shares (Diluted) | 2,190,000,000 | 2,188,000,000 | · | 2,187,000,000 | 2,186,000,000 | 2,185,000,000 | · | 2,180,000,000 | 2,139,000,000 | 2,128,000,000 | · | 2,049,000,000 | 2,027,000,000 | 2,028,000,000 | · | 2,028,000,000 | |
| EBITDA | $4.34B | $4.66B | · | $3.67B | $3.68B | $5.08B | · | $3.54B | $3.55B | $3.90B | · | $2.96B | $3.49B | $3.81B | · | $2.85B |
Bilans
| Wskaźnik | Trend | Q2 2026 | Q1 2026 | Q4 2025 | Q3 2025 | Q2 2025 | Q1 2025 | Q4 2024 | Q3 2024 | Q2 2024 | Q1 2024 | Q4 2023 | Q3 2023 | Q2 2023 | Q1 2023 | Q4 2022 | Q3 2022 |
|---|---|---|---|---|---|---|---|---|---|---|---|---|---|---|---|---|---|
| Cash & Equivalents | $2.01B | $1.64B | $1.09B | $1.41B | $1.20B | $2.09B | $1.80B | $1.88B | $3.59B | $1.21B | · | $2.61B | $1.03B | $976M | · | $1.02B | |
| Inventory | $1.59B | $1.85B | $1.62B | $1.90B | $1.41B | $1.23B | $1.49B | $1.61B | $1.36B | $1.38B | · | $1.57B | $1.21B | $1.31B | · | $2.35B | |
| Other Current Assets | $4.12B | $4.64B | $3.23B | $2.72B | $2.84B | $2.44B | $2.77B | $2.61B | $2.59B | $2.24B | · | $2.76B | $2.77B | $2.70B | · | · | |
| Current Assets | $17.72B | $18.86B | $13.20B | $12.08B | $11.07B | $13.60B | $13.16B | $11.89B | $12.50B | $10.01B | · | $11.13B | $8.97B | $9.92B | · | $10.81B | |
| PP&E (Net) | $137.66B | $134.41B | $131.60B | $130.95B | $128.18B | $131.58B | $131.10B | · | · | · | · | $105.58B | $103.95B | $104.25B | $104.46B | $105.25B | |
| Goodwill | $36.22B | $35.77B | $35.28B | $35.68B | $35.16B | $36.60B | $36.60B | $34.86B | $34.32B | $34.29B | $31.85B | $32.39B | $31.89B | $32.41B | $32.44B | $35.27B | |
| Intangibles | $3.97B | $4.00B | $3.99B | $4.26B | $4.28B | $4.51B | $4.59B | $4.40B | $4.50B | $4.53B | · | $3.73B | $3.76B | $3.91B | · | $4.12B | |
| Total Assets | $231.65B | $228.20B | $218.47B | $216.97B | $211.59B | $220.04B | $218.97B | $205.77B | $201.26B | $190.71B | · | $178.41B | $173.94B | $177.07B | · | $181.78B | |
| Short-term Debt | $1.57B | $1.49B | $1.03B | $1.27B | $914M | $859M | $529M | $928M | $200M | $335M | · | $1.58B | $848M | $1.44B | · | $1.88B | |
| Current Liabilities | $24.58B | $23.31B | $21.00B | $15.04B | $14.81B | $18.63B | $23.81B | $19.05B | $16.33B | $14.72B | · | $16.73B | $14.03B | $16.78B | · | $17.91B | |
| Capital Leases | · | · | $587M | · | · | · | $738M | · | · | · | · | · | · | · | · | · | |
| Deferred Tax | $21.66B | $21.01B | $20.28B | $20.24B | $19.68B | $19.98B | $19.60B | $18.37B | $17.91B | $16.69B | · | $14.95B | $14.50B | $14.29B | · | $13.34B | |
| Other Non-current Liabilities | $12.71B | $12.38B | $12.30B | $12.28B | $11.77B | $12.99B | $13.26B | $12.25B | $11.59B | $10.62B | · | $9.47B | $8.85B | $9.23B | · | $9.13B | |
| Total Liabilities | $162.80B | $159.71B | $152.55B | $148.16B | $143.23B | $148.76B | $150.08B | $137.00B | $131.01B | $123.41B | · | $109.94B | $109.90B | $112.05B | · | $114.34B | |
| Long-term Debt | · | · | $104.41B | · | · | · | · | · | · | · | · | · | · | · | · | · | |
| Total Debt | $1.57B | $1.49B | · | $1.27B | $914M | $859M | · | $928M | $200M | $335M | · | $1.58B | $848M | $1.44B | · | $1.88B | |
| Common Stock | $71.95B | $71.94B | $71.88B | $71.84B | $71.82B | $71.81B | $71.74B | $71.71B | $71.70B | $69.20B | · | $69.18B | $64.69B | $64.77B | · | $64.76B | |
| Paid-in Capital | $183M | $168M | $242M | $240M | $226M | $229M | $275M | $286M | $272M | $274M | · | $276M | $291M | $274M | · | $312M | |
| Retained Earnings | $-20.33B | $-19.61B | $-21.28B | $-19.06B | $-17.66B | $-17.79B | $-20.05B | $-16.50B | $-15.79B | $-15.70B | · | $-15.01B | $-13.75B | $-13.75B | · | $-10.88B | |
| AOCI | $6.73B | $5.65B | $4.68B | $5.35B | $4.24B | $7.19B | $7.12B | $3.47B | $4.23B | $3.66B | · | $3.83B | $2.56B | $3.43B | · | $3.83B | |
| Stockholders' Equity | $65.35B | $64.97B | $62.33B | $65.18B | $65.45B | $68.26B | $65.90B | $65.79B | $67.23B | $64.26B | · | $65.09B | $60.62B | $61.54B | · | $64.83B | |
| Liabilities + Equity | $231.65B | $228.20B | $218.47B | $216.97B | $211.59B | $220.04B | $218.97B | $205.77B | $201.26B | $190.71B | · | $178.41B | $173.94B | $177.07B | · | $181.78B | |
| Shares Outstanding | 2,184,000,000 | 2,184,000,000 | 2,182,000,000 | 2,181,000,000 | 2,181,000,000 | 2,180,000,000 | 2,178,000,000 | 2,178,000,000 | 2,177,000,000 | 2,126,000,000 | 2,125,000,000 | 2,126,000,000 | 2,023,000,000 | 2,025,000,000 | 2,025,000,000 | 2,025,000,000 |
Przepływy pieniężne
| Wskaźnik | Trend | Q2 2026 | Q1 2026 | Q4 2025 | Q3 2025 | Q2 2025 | Q1 2025 | Q4 2024 | Q3 2024 | Q2 2024 | Q1 2024 | Q4 2023 | Q3 2023 | Q2 2023 | Q1 2023 | Q4 2022 | Q3 2022 |
|---|---|---|---|---|---|---|---|---|---|---|---|---|---|---|---|---|---|
| D&A | $1.43B | $1.43B | $1.46B | $1.40B | $1.39B | $1.41B | $1.38B | $1.32B | $1.27B | $1.19B | $1.17B | $1.16B | $1.14B | $1.15B | $1.12B | $1.08B | |
| Deferred Tax | $184M | $271M | $81M | $153M | $487M | $304M | $-24M | $130M | $479M | $134M | $497M | $4M | $435M | $484M | $357M | $131M | |
| Other Non-cash | · | $-3.06B | · | · | · | $-1.92B | · | · | · | $12M | · | · | · | $1.33B | · | · | |
| Operating Cash Flow | $4.11B | $2.34B | $3.11B | $2.87B | $3.24B | $3.05B | $3.66B | $2.97B | $2.81B | $3.15B | $3.81B | $3.08B | $3.44B | $3.87B | $3.61B | $2.14B | |
| CapEx | $2.98B | $2.44B | $3.03B | $2.32B | $1.90B | $1.72B | $2.55B | $1.63B | $1.35B | $1.19B | $1.37B | $1.19B | $964M | $1.13B | $1.44B | $1.20B | |
| Investing Cash Flow | $-3.07B | $-2.83B | $-3.32B | $-2.54B | $-2.86B | $-1.79B | $-4.45B | $-4.68B | $-3.44B | $-7.79B | $-2.54B | $-1.17B | $-896M | $-1.44B | $-2.11B | $-1.04B | |
| Debt Issued | $0 | $2.00B | · | · | · | · | · | · | · | · | · | · | · | · | · | · | |
| Net Debt Issued | · | $1.93B | · | · | · | $-2.74B | · | · | · | $-3.78B | · | · | · | $-968M | · | · | |
| Stock Issued | $0 | $0 | $20M | $2M | $1M | $5M | $0 | $0 | $2.48B | $0 | $0 | $4.45B | $0 | $0 | $0 | $0 | |
| Stock Repurchased | · | · | · | · | · | · | $0 | $0 | · | · | $0 | $0 | $125M | $0 | $0 | $0 | |
| Net Stock Activity | · | $0 | · | · | · | $5M | · | · | · | · | · | · | · | $0 | · | · | |
| Dividends Paid | $2.12B | $2.12B | $2.06B | $2.06B | $2.06B | $2.05B | $1.99B | $2.00B | $1.95B | $1.95B | $1.89B | $1.79B | $1.80B | $1.80B | $1.74B | $1.74B | |
| Financing Cash Flow | $-823M | $1.11B | $-108M | $-126M | $-1.22B | $-950M | $601M | $156M | $2.91B | $-120M | $2.28B | $-376M | $-2.48B | $-2.29B | $-1.64B | $-1.18B | |
| Net Change in Cash | $242M | $650M | $-332M | $230M | $-900M | $322M | $-102M | $-1.60B | $2.31B | $-4.60B | $3.34B | $1.56B | $39M | $144M | $-150M | $-31M | |
| Free Cash Flow | · | $-97M | · | · | · | $1.33B | · | · | · | $1.97B | · | · | · | $2.74B | · | · | |
| Levered FCF | · | · | · | · | · | · | · | · | · | $1.24B | · | · | · | $2.03B | · | · |
Rentowność
| Wskaźnik | Trend | Q2 2026 | Q1 2026 | Q4 2025 | Q3 2025 | Q2 2025 | Q1 2025 | Q4 2024 | Q3 2024 | Q2 2024 | Q1 2024 | Q4 2023 | Q3 2023 | Q2 2023 | Q1 2023 | Q4 2022 | Q3 2022 |
|---|---|---|---|---|---|---|---|---|---|---|---|---|---|---|---|---|---|
| Operating Margin | 9.9% | 14.4% | · | 15.5% | 15.4% | 19.9% | · | 14.9% | 20.1% | 24.6% | · | 18.2% | 22.5% | 22.1% | · | 15.4% | |
| Net Margin | 5.1% | 8.0% | · | 5.4% | 15.3% | 12.8% | · | 9.3% | 17.1% | 13.7% | · | 6.3% | 18.6% | 15.0% | · | 11.8% | |
| Pretax Margin | 6.9% | 10.6% | · | 7.9% | 20.1% | 17.2% | · | 11.8% | 24.2% | 17.7% | · | 7.6% | 24.2% | 19.7% | · | 14.7% | |
| EBITDA Margin | 14.8% | 20.8% | · | 25.1% | 24.7% | 27.5% | · | 23.8% | 31.3% | 35.4% | · | 30.0% | 33.4% | 31.5% | · | 24.7% | |
| ROA | 0.68% | 0.79% | · | 0.37% | 1.1% | 1.1% | · | 0.72% | 1.0% | 0.82% | · | 0.34% | 1.1% | 1.1% | · | 0.79% | |
| ROE | 2.3% | 2.7% | · | 1.2% | 3.4% | 3.6% | · | 2.1% | 3.0% | 2.4% | · | 0.96% | 3.2% | 2.9% | · | 2.1% | |
| ROIC | 3.4% | 3.6% | · | 2.5% | 2.7% | 4.2% | · | 2.7% | 2.5% | 3.4% | · | 2.2% | 3.0% | 3.3% | · | 2.2% |
Płynność i wypłacalność
| Wskaźnik | Trend | Q2 2026 | Q1 2026 | Q4 2025 | Q3 2025 | Q2 2025 | Q1 2025 | Q4 2024 | Q3 2024 | Q2 2024 | Q1 2024 | Q4 2023 | Q3 2023 | Q2 2023 | Q1 2023 | Q4 2022 | Q3 2022 |
|---|---|---|---|---|---|---|---|---|---|---|---|---|---|---|---|---|---|
| Current Ratio | 0.7 | 0.8 | · | 0.8 | 0.7 | 0.7 | · | 0.6 | 0.8 | 0.7 | · | 0.7 | 0.6 | 0.6 | · | 0.6 | |
| Quick Ratio | 0.1 | 0.1 | · | 0.1 | 0.1 | 0.1 | · | 0.1 | 0.2 | 0.1 | · | 0.2 | 0.1 | 0.1 | · | 0.1 | |
| Debt / Equity | 0.0 | 0.0 | · | 0.0 | 0.0 | 0.0 | · | 0.0 | 0.0 | 0.0 | · | 0.0 | 0.0 | 0.0 | · | 0.0 | |
| Interest Coverage | · | · | · | · | · | · | · | · | · | 3.0 | · | 1.9 | 2.7 | 2.9 | · | 2.2 |
Efektywność
| Wskaźnik | Trend | Q2 2026 | Q1 2026 | Q4 2025 | Q3 2025 | Q2 2025 | Q1 2025 | Q4 2024 | Q3 2024 | Q2 2024 | Q1 2024 | Q4 2023 | Q3 2023 | Q2 2023 | Q1 2023 | Q4 2022 | Q3 2022 |
|---|---|---|---|---|---|---|---|---|---|---|---|---|---|---|---|---|---|
| Asset Turnover | 0.1 | 0.1 | · | 0.1 | 0.1 | 0.1 | · | 0.1 | 0.1 | 0.1 | · | 0.1 | 0.1 | 0.1 | · | 0.1 | |
| Inventory Turnover | · | · | · | · | · | · | · | 5.7 | 4.3 | 3.7 | · | 2.5 | 3.6 | 4.9 | · | 3.5 |
Na akcję
| Wskaźnik | Trend | Q2 2026 | Q1 2026 | Q4 2025 | Q3 2025 | Q2 2025 | Q1 2025 | Q4 2024 | Q3 2024 | Q2 2024 | Q1 2024 | Q4 2023 | Q3 2023 | Q2 2023 | Q1 2023 | Q4 2022 | Q3 2022 |
|---|---|---|---|---|---|---|---|---|---|---|---|---|---|---|---|---|---|
| Book Value / Share | $29.92 | $29.75 | · | $29.89 | $30.01 | $31.31 | · | $30.21 | $30.88 | $30.23 | · | $30.62 | $29.96 | $30.39 | · | $32.02 | |
| Revenue / Share | $13.39 | $10.22 | · | $6.69 | $6.81 | $8.47 | · | $6.83 | $5.30 | $5.19 | · | $4.80 | $5.15 | $5.95 | · | $5.71 | |
| Cash Flow / Share | · | $1.07 | · | · | · | $1.40 | · | · | · | $1.48 | · | · | · | $1.91 | · | · | |
| Cash / Share | $0.92 | $0.75 | · | $0.65 | $0.55 | $0.96 | · | $0.86 | $1.65 | $0.57 | · | $1.23 | $0.51 | $0.48 | · | $0.50 | |
| Dividend / Share | $0.00 | $0.97 | · | $0.00 | $0.00 | $0.94 | · | · | · | · | · | · | · | · | · | · | |
| Dividend Paid / Share | $0.97 | $0.97 | $-939998.11 | $0.94 | $0.94 | $0.94 | $-919998.18 | $0.92 | $0.92 | $920000.00 | $-889998.23 | $890000.00 | $0.89 | $0.89 | $0.86 | $0.86 | |
| EPS (TTM) | $2.59 | $2.95 | · | $2.56 | $2.85 | $2.71 | · | $2.94 | $2.61 | $2.66 | · | $1.50 | $1.87 | $1.18 | · | $2.70 |
Wycena (TTM)
| Wskaźnik | Trend | Q2 2026 | Q1 2026 | Q4 2025 | Q3 2025 | Q2 2025 | Q1 2025 | Q4 2024 | Q3 2024 | Q2 2024 | Q1 2024 | Q4 2023 | Q3 2023 | Q2 2023 | Q1 2023 | Q4 2022 | Q3 2022 |
|---|---|---|---|---|---|---|---|---|---|---|---|---|---|---|---|---|---|
| Revenue TTM | $83.49B | $69.05B | · | $64.23B | $64.48B | $60.94B | · | $48.55B | $43.52B | $42.61B | · | $45.77B | $47.50B | $50.29B | · | $52.41B | |
| Net Income TTM | $6.13B | $6.91B | · | $6.03B | $6.63B | $6.29B | · | $6.66B | $5.89B | $5.89B | · | $3.39B | $4.13B | $2.79B | · | $5.92B | |
| Market Cap | $118.39B | $118.24B | · | $110.05B | $98.84B | $96.60B | · | $88.45B | $77.48B | $76.92B | · | $70.56B | $75.15B | $77.25B | · | $75.13B | |
| Enterprise Value | $117.95B | $118.09B | · | $109.92B | $98.55B | $95.37B | · | $87.50B | $74.09B | $76.04B | · | $69.54B | $74.97B | $77.71B | · | $75.99B | |
| P/E | 20.9 | 18.4 | · | 19.7 | 15.9 | 16.4 | · | 13.8 | 13.6 | 13.6 | · | 22.1 | 19.9 | 32.3 | · | 13.7 | |
| P/S | 1.4 | 1.7 | · | 1.7 | 1.5 | 1.6 | · | 1.8 | 1.8 | 1.8 | · | 1.5 | 1.6 | 1.5 | · | 1.4 | |
| P/B | 1.8 | 1.8 | · | 1.7 | 1.5 | 1.4 | · | 1.3 | 1.2 | 1.2 | · | 1.1 | 1.2 | 1.3 | · | 1.2 | |
| P / Tangible Book | 4.7 | 4.7 | · | 4.4 | 3.8 | 3.6 | · | 3.3 | 2.7 | 3.0 | · | 2.4 | 3.0 | 3.1 | · | 3.0 | |
| P / Cash Flow | · | 50.5 | · | · | · | 31.6 | · | · | · | 24.4 | · | · | · | 20.0 | · | · | |
| EV / Revenue | 1.4 | 1.7 | · | 1.7 | 1.5 | 1.6 | · | 1.8 | 1.7 | 1.8 | · | 1.5 | 1.6 | 1.5 | · | 1.4 | |
| Dividend Yield | 7.0% | 7.0% | · | 7.4% | 8.2% | 8.3% | · | 8.8% | 9.8% | 9.7% | · | 10.1% | 9.4% | 9.1% | · | 9.2% | |
| Earnings Yield | 4.8% | 5.5% | · | 5.1% | 6.3% | 6.1% | · | 7.2% | 7.3% | 7.3% | · | 4.5% | 5.0% | 3.1% | · | 7.3% | |
| Payout Ratio | · | 119.0% | · | · | · | 86.9% | · | · | · | 128.6% | · | · | · | 99.0% | · | · | |
| Annual Payout | $8.35B | $8.28B | · | $8.15B | $8.09B | $7.98B | · | $7.77B | $7.57B | $7.42B | · | $7.13B | $7.08B | $7.02B | · | $6.92B |
Najnowszy okres po lewej · wartości null pokazane jako ·
Sprawozdania finansowe Rachunek zysków i strat, bilans, przepływy pieniężne — roczne, ostatnie 5 lat
| Wskaźnik | 2025-12-31 | 2024-12-31 | 2023-12-31 | 2022-12-31 | 2021-12-31 |
|---|---|---|---|---|---|
| Przychody | $65.19B | $53.47B | $43.65B | $53.31B | $47.07B |
| Zysk netto | $7.49B | $5.44B | $6.19B | $3.00B | $6.19B |
| Rozwodniony EPS | $3.22 | $2.34 | $2.84 | $1.28 | $2.87 |
Zbyt mało danych fundamentalnych, aby utworzyć to sprawozdanie.
Zbyt mało danych fundamentalnych, aby utworzyć to sprawozdanie.
Właściciele instytucjonalni (13F) 1 615 emitentów · $63.8B łącznie · Na dzień 30 września 2026
Instytucje, które zgłaszają posiadanie tych akcji w swoich kwartalnych zgłoszeniach SEC Form 13F. Tylko pozycje długie; pojedynczy zgłaszający może pojawić się dwukrotnie dla oddzielnych transz opcji. Duże przeciwstawne pozycje put/call zazwyczaj odzwierciedlają działalność market-makingową lub zabezpieczone zapasy, a nie przekonanie kierunkowe.
| Nowe pozycje | Zamknięte pozycje | Zwiększone | Zmniejszony | Zmiana liczby akcji netto |
|---|---|---|---|---|
| 101 (-89 vs poprzedni kw.) | 81 (+13 vs poprzedni kw.) | 541 (+51 vs poprzedni kw.) | 516 (-36 vs poprzedni kw.) | +36.5M |
Porównano z Q1 2026. Zgłoszenia SEC Form 13F są wymagane w ciągu 45 dni od końca kwartału plus krótki bufor dla spóźnionych zgłoszeń — kwartały mieszczące się jeszcze w tym terminie są pomijane na rzecz ostatniej w pełni zgłoszonej pary.
| Instytucja | Wartość | Akcje | % z śledzonych 13F | Typ |
|---|---|---|---|---|
| ROYAL BANK OF CANADA | $5 875 697 000 | 108 387 706 | 9,21% | Akcje |
| VANGUARD GROUP INC | $4 802 765 961 | 100 364 993 | 7,52% | Akcje |
| VANGUARD CAPITAL MANAGEMENT LLC | $3 404 579 535 | 62 781 529 | 5,33% | Akcje |
| BANK OF MONTREAL /CAN/ | $3 331 001 219 | 61 486 532 | 5,22% | Akcje |
| GQG Partners LLC | $2 660 876 370 | 49 084 876 | 4,17% | Akcje |
| DEUTSCHE BANK AG\ | $1 850 502 477 | 34 135 814 | 2,90% | Akcje |
| TD Asset Management Inc | $1 695 480 638 | 31 276 338 | 2,66% | Akcje |
| MACKENZIE FINANCIAL CORP | $1 626 748 636 | 21 151 328 | 2,55% | Akcje |
| 1832 Asset Management L.P. | $1 551 523 593 | 28 620 616 | 2,43% | Akcje |
| GEODE CAPITAL MANAGEMENT, LLC | $1 398 658 231 | 25 099 241 | 2,19% | Akcje |
| CIBC WORLD MARKET INC. | $1 395 383 413 | 25 754 086 | 2,19% | Akcje |
| NORGES BANK | $1 301 348 283 | 24 021 424 | 2,04% | Akcje |
| NATIONAL BANK OF CANADA /FI/ | $1 121 155 439 | 20 703 852 | 1,76% | Akcje |
| Connor, Clark & Lunn Investment Management Ltd. | $1 117 352 735 | 20 624 547 | 1,75% | Akcje |
| VANGUARD FIDUCIARY TRUST CO | $1 049 283 754 | 19 349 126 | 1,64% | Akcje |
| Legal & General Group Plc | $944 782 208 | 17 428 310 | 1,48% | Akcje |
| Vanguard Global Advisers, LLC | $908 854 288 | 16 759 562 | 1,42% | Akcje |
| TD Waterhouse Canada Inc. | $863 952 233 | 16 189 798 | 1,35% | Akcje |
| GOLDMAN SACHS GROUP INC | $851 746 947 | 15 711 989 | 1,33% | Akcje |
| JPMORGAN CHASE & CO | $818 920 565 | 14 781 958 | 1,28% | Akcje |
| SCOTIA CAPITAL INC. | $778 118 150 | 14 359 061 | 1,22% | Akcje |
| CIBC Asset Management Inc | $763 981 423 | 14 080 398 | 1,20% | Akcje |
| MORGAN STANLEY | $753 296 104 | 13 895 886 | 1,18% | Akcje |
| Blackstone Inc. | $739 416 865 | 13 639 861 | 1,16% | Akcje |
| Amundi | $647 728 023 | 11 948 497 | 1,01% | Akcje |
| MANUFACTURERS LIFE INSURANCE COMPANY, THE | $599 708 731 | 11 079 469 | 0,94% | Akcje |
| CANADA PENSION PLAN INVESTMENT BOARD | $585 113 425 | 10 800 535 | 0,92% | Akcje |
| TORONTO DOMINION BANK | $503 775 144 | 9 299 341 | 0,79% | Akcje |
| BANK OF NOVA SCOTIA | $485 527 072 | 8 953 708 | 0,76% | Akcje |
| FIL Ltd | $473 169 028 | 8 725 419 | 0,74% | Akcje |
| ONTARIO TEACHERS PENSION PLAN BOARD | $467 781 621 | 8 634 722 | 0,73% | Akcje |
| Federation des caisses Desjardins du Quebec | $458 193 260 | 8 470 608 | 0,72% | Akcje |
| Bank of New York Mellon Corp | $412 626 781 | 7 611 637 | 0,65% | Akcje |
| Morgan Stanley Institutional Investment Advisors LLC | $400 550 904 | 7 388 875 | 0,63% | Akcje |
| CHARLES SCHWAB INVESTMENT MANAGEMENT INC | $383 510 312 | 7 074 571 | 0,60% | Akcje |
| Swiss National Bank | $381 285 813 | 7 051 631 | 0,60% | Akcje |
| BANK OF AMERICA CORP /DE/ | $380 896 021 | 7 026 305 | 0,60% | Akcje |
| Clearbridge Investments, LLC | $363 515 510 | 6 705 691 | 0,57% | Akcje |
| TORTOISE CAPITAL ADVISORS, L.L.C. | $322 887 834 | 5 956 241 | 0,51% | Akcje |
| MIRAE ASSET GLOBAL ETFS HOLDINGS Ltd. | $310 768 908 | 5 732 686 | 0,49% | Akcje |
| Capital World Investors | $273 191 333 | 5 039 487 | 0,43% | Akcje |
| KAYNE ANDERSON CAPITAL ADVISORS LP | $272 630 710 | 5 029 159 | 0,43% | Akcje |
| ROYAL BANK OF CANADA | $269 397 000 | 4 969 500 | 0,42% | Opcja sprzedaży |
| FEDERATED HERMES, INC. | $266 511 322 | 4 916 276 | 0,42% | Akcje |
| Nuveen, LLC | $265 894 435 | 4 904 911 | 0,42% | Akcje |
| UBS Group AG | $261 964 891 | 4 832 409 | 0,41% | Akcje |
| Vontobel Holding Ltd. | $259 891 259 | 4 797 300 | 0,41% | Akcje |
| Caisse de depot et placement du Quebec | $256 283 148 | 4 727 626 | 0,40% | Akcje |
| VANGUARD ASSET MANAGEMENT, Ltd | $251 476 792 | 4 637 312 | 0,39% | Akcje |
| MASSACHUSETTS FINANCIAL SERVICES CO /MA/ | $240 947 587 | 3 241 036 | 0,38% | Akcje |
Aktywiści i właściciele 5%+ 3 akcje
Inwestorzy, którzy złożyli SEC Schedule 13D — posiadanie beneficjentów powyżej 5% z zamiarem wpływania na emitenta (udziały aktywistów, kampanie zarządu, M&A). Każdy wiersz pokazuje najnowszy znany stan pozycji tego zgłaszającego.
| Zgłaszający | Złożono | Udział | Status | Cel | Zgłoszenie |
|---|---|---|---|---|---|
| Enbridge Energy Company, Inc., Enbridge (U.S.) Inc., Enbridge US Holdings Inc. Not applicable., Enbridge Inc. ×9 zgłoszenia | 20 grudnia 2018 | · | Pierwotne zgłoszenie | M&A / sprzedaż | SEC |
| Spectra Energy Corp (“ Spectra Energy ”), Spectra Energy Capital, LLC (“ SE Capital ”), Spectra Energy Transmission, LLC (“ SE Transmission ”), Spectra Energy Southeast Supply Header, LLC (“ SESSH ”), Spectra Energy Partners GP, LLC (“ SEP GP LLC ”), Spectra Energy Partners (DE) GP, LP (“ SEP GP ”), Enbridge (U.S.) Inc. (“ EUSI ”), Enbridge US Holdings Inc. (“ EUSHI ”) Not applicable., Enbridge Inc. (“ Enbridge ”) ×7 zgłoszenia | 17 grudnia 2018 | · | Pierwotne zgłoszenie | M&A / sprzedaż | SEC |
| Niezgłoszona osoba raportująca, Niezgłoszona osoba raportująca | 28 października 2002 | · | Pierwotne zgłoszenie | Inwestycja pasywna | SEC |
Purpose is an automated classification of the filer's own stated purpose (SEC Item 4) — not investment advice. "—" means no clear purpose was stated or the text could not be classified.
Insiderzy spółki 24 insiderów · 10 dyrektorzy generalni · 15 dyrektorzy
| Insider | Rola | Ostatnia aktywność | Posiadane akcje | Kupna 12m | Sprzedaże 12m | Netto 12m |
|---|---|---|---|---|---|---|
| Albert Monaco | President & Chief Executive Officer | 5 czerwca 2019 P | 824 530 | 0 | 0 | $0 |
| Colin K Gruending | Executive Vice President & Chief Financial Officer | 1 czerwca 2019 A | · | 0 | 0 | $0 |
| John K Whelen | Executive Vice President & Chief Financial Officer | 8 marca 2019 D | 199 900 | 0 | 0 | $0 |
| William T. Yardley | Executive Vice President & President, Gas Transmission & Midstream | 8 maja 2019 A | 94 770 | 0 | 0 | $0 |
| Guy D Jarvis | Executive Vice President & President, Liquids Pipelines | 8 marca 2019 M | 71 635 | 0 | 0 | $0 |
| Byron C Neiles | Executive Vice President, Corporate Services | 8 marca 2019 D | 65 008 | 0 | 0 | $0 |
| Allen C Capps | Senior Vice President & Chief Accounting Officer | 8 marca 2019 D | 1 371 | 0 | 0 | $0 |
| Vernon D Yu | Executive Vice President & Chief Development Officer | 8 marca 2019 D | 87 912 | 0 | 0 | $0 |
| Cynthia L Hansen | Executive Vice President & President, Utilities & Power Operations | 1 marca 2019 P | 6 467 | 0 | 0 | $0 |
| Robert R Rooney | Executive Vice President & Chief Legal Officer | 21 lutego 2019 A | 18 096 | 0 | 0 | $0 |
| Charles W Fischer | Dyrektor | 14 czerwca 2019 A | 31 169 | 0 | 0 | $0 |
| Marcel Rosaire Coutu | Dyrektor | 14 czerwca 2019 A | · | 0 | 0 | $0 |
| Catherine Lynne Williams | Dyrektor | 14 czerwca 2019 A | 52 721 | 0 | 0 | $0 |
| James Herbert England | Dyrektor | 14 czerwca 2019 A | 27 327 | 0 | 0 | $0 |
| Pamela L Carter | Dyrektor | 14 czerwca 2019 A | 42 559 | 0 | 0 | $0 |
| Dan C Tutcher | Dyrektor | 14 czerwca 2019 A | 203 838 | 0 | 0 | $0 |
| Susan M Cunningham | Dyrektor | 14 czerwca 2019 A | 404 | 0 | 0 | $0 |
| Gregory L Ebel | Dyrektor | 14 czerwca 2019 A | 648 080 | 0 | 0 | $0 |
| Darkes V Maureen Kempston | Dyrektor | 14 czerwca 2019 A | · | 0 | 0 | $0 |
| MADDEN TERESA S | Dyrektor | 14 czerwca 2019 A | · | 0 | 0 | $0 |
| Michael E J Phelps | Dyrektor | 22 marca 2019 A | 55 645 | 0 | 0 | $0 |
| Clarence P Cazalot JR | Dyrektor | 22 marca 2019 A | 132 955 | 0 | 0 | $0 |
| Michael Mcshane | Dyrektor | 21 września 2018 A | · | 0 | 0 | $0 |
| Rebecca B Roberts | Dyrektor | 23 marca 2018 A | · | 0 | 0 | $0 |
Insiderzy z zgłoszeń SEC Form 3/4/5; netto = tylko otwarty rynek P/S
Posiadanie ETF-ów Posiadane przez 47 funduszy ETF
Waga odzwierciedla wyłącznie bezpośrednie udziały kapitałowe (N-PORT); fundusze oparte na dźwigni lub instrumentach pochodnych mogą posiadać dodatkowe ekspozycje na swapy, które nie są pokazane.
| Fundusz | Waga | Jednostki | Na dzień | Źródło |
|---|---|---|---|---|
| BKGI · BNY Mellon ETF Trust | 7,55% | 1 817 730 NS | 31 lipca 2026 | N-PORT |
| USAI · Pacer Funds Trust | 6,93% | 169 142 NS | 31 lipca 2026 | N-PORT |
| GEND · Spinnaker ETF Series | 4,12% | 3 671 NS | 31 lipca 2026 | N-PORT |
| BBCA · J.P. Morgan Exchange-Traded Fund Tr… | 3,88% | 7 737 103 NS | 31 lipca 2026 | N-PORT |
| IGF · iShares Trust | 3,80% | 8 161 455 SH | 11 września 2026 | Dziennie |
| EWC · iShares, Inc. | 3,42% | 4 835 641 SH | 11 września 2026 | Dziennie |
| PAYR · Federated Hermes ETF Trust | 3,27% | 34 304 NS | 31 lipca 2026 | N-PORT |
| GENW · Spinnaker ETF Series | 3,23% | 3 037 NS | 31 lipca 2026 | N-PORT |
| ELCV · Strategy Shares | 3,15% | 145 312 NS | 31 lipca 2026 | N-PORT |
| PID · Invesco Exchange-Traded Fund Trust | 3,04% | 551 755 SH | 1 października 2026 | Dziennie |
| IXC · iShares Trust | 2,71% | 1 661 516 SH | 11 września 2026 | Dziennie |
| FIDI · Fidelity Covington Trust | 2,59% | 172 569 NS | 31 lipca 2026 | N-PORT |
| IGE · iShares Trust | 2,56% | 426 540 SH | 11 września 2026 | Dziennie |
| EFFI · Harbor ETF Trust | 2,15% | 61 057 NS | 31 lipca 2026 | N-PORT |
| TBG · EA Series Trust | 1,86% | 88 930 NS | 31 lipca 2026 | N-PORT |
| NFRA · FlexShares Trust | 1,83% | 1 014 021 NS | 31 lipca 2026 | N-PORT |
| IQRA · New York Life Investments Active ET… | 1,16% | 1 465 NS | 31 lipca 2026 | N-PORT |
| FEDM · FlexShares Trust | 1,16% | 16 807 NS | 31 lipca 2026 | N-PORT |
| IMTM · iShares Trust | 0,67% | 597 038 SH | 11 września 2026 | Dziennie |
| VYMI · VANGUARD WHITEHALL FUNDS | 0,64% | 2 445 691 SH | 19 sierpnia 2026 | Dziennie |
| IDLV · Invesco Exchange-Traded Fund Trust … | 0,56% | 38 153 SH | 1 października 2026 | Dziennie |
| PTIN · Pacer Funds Trust | 0,50% | 16 815 NS | 31 lipca 2026 | N-PORT |
| BKIE · BNY Mellon ETF Trust | 0,46% | 110 930 NS | 31 lipca 2026 | N-PORT |
| PXF · Invesco Exchange-Traded Fund Trust … | 0,38% | 239 052 SH | 1 października 2026 | Dziennie |
| VEA · VANGUARD TAX-MANAGED FUNDS | 0,36% | 21 346 072 SH | 19 sierpnia 2026 | Dziennie |
| IDEV · iShares Trust | 0,36% | 2 401 615 SH | 11 września 2026 | Dziennie |
| DFAI · Dimensional ETF Trust | 0,34% | 1 094 034 NS | 31 lipca 2026 | N-PORT |
| ESGG · FlexShares Trust | 0,30% | 6 175 NS | 31 lipca 2026 | N-PORT |
| VEU · VANGUARD INTERNATIONAL EQUITY INDEX… | 0,29% | 5 109 054 SH | 19 sierpnia 2026 | Dziennie |
| GLBL · Pacer Funds Trust | 0,29% | 58 NS | 31 lipca 2026 | N-PORT |
| ACWX · iShares Trust | 0,28% | 718 347 SH | 11 września 2026 | Dziennie |
| VXUS · VANGUARD STAR FUNDS | 0,26% | 32 065 862 SH | 19 sierpnia 2026 | Dziennie |
| CRBN · iShares Trust | 0,25% | 60 770 SH | 11 września 2026 | Dziennie |
| IXUS · iShares Trust | 0,24% | 3 015 325 SH | 11 września 2026 | Dziennie |
| TLTD · FlexShares Trust | 0,21% | 26 202 NS | 31 lipca 2026 | N-PORT |
| IMFL · Invesco Exchange-Traded Self-Indexe… | 0,21% | 46 802 SH | 1 października 2026 | Dziennie |
| DFSI · Dimensional ETF Trust | 0,14% | 28 562 NS | 31 lipca 2026 | N-PORT |
| VOXP · Advisors Series Trust | 0,13% | 135 NS | 31 lipca 2026 | N-PORT |
| TOK · iShares Trust | 0,12% | 5 964 SH | 11 września 2026 | Dziennie |
| URTH · iShares, Inc. | 0,12% | 196 859 SH | 11 września 2026 | Dziennie |
| DFIC · Dimensional ETF Trust | 0,11% | 310 307 NS | 31 lipca 2026 | N-PORT |
| JFLI · J.P. Morgan Exchange-Traded Fund Tr… | 0,11% | 961 NS | 31 lipca 2026 | N-PORT |
| ACWI · iShares Trust | 0,10% | 698 778 SH | 11 września 2026 | Dziennie |
| VT · VANGUARD INTERNATIONAL EQUITY INDEX… | 0,10% | 1 809 864 SH | 19 sierpnia 2026 | Dziennie |
| DFAX · Dimensional ETF Trust | 0,08% | 170 741 NS | 31 lipca 2026 | N-PORT |
| INTF · iShares Trust | 0,03% | 21 278 SH | 11 września 2026 | Dziennie |
| AMZA · ETFis Series Trust I | 0,02% | 1 618 NS | 31 lipca 2026 | N-PORT |
ENB Konsensus analityków Bycze i niedźwiedzie opinie analityków, 12-miesięczny cel cenowy, potencjał wzrostu
12-miesięczny cel cenowy
4 analityków · 2026-09-30Średnia cel $51.64 +12,3%
Najnowsze wiadomości Najnowsze nagłówki wspominające o tej firmie
Moje wskaźniki Twoja osobista lista obserwowanych — wybrane wiersze z Pełnych Fundamentów
Wybierz wskaźniki, które są dla Ciebie ważne — kliknij + obok dowolnego wiersza w sekcji Pełne dane fundamentalne powyżej.
Twój wybór został zapisany i będzie Ci towarzyszył we wszystkich tickerach.