
PSN Parsons Corporation Common Stock
NYSE · Professional Services · 在 SEC EDGAR 上查看 ↗ 收盘 十月 2, 2026 10-K/10-Q 七月 29, 2026PSN 股票快照 价格、市值、P/E、EPS、ROE、负债/权益、52周范围
PSN 股价图表 包含技术指标的日 OHLCV — 平移、缩放和自定义您的视图
柱状图粒度会根据所选周期进行调整 — 将鼠标悬停在图表上可查看柱状图的开盘价/最高价/最低价/收盘价。
关于 Parsons Corporation Common Stock 公司概况(来自维基百科)
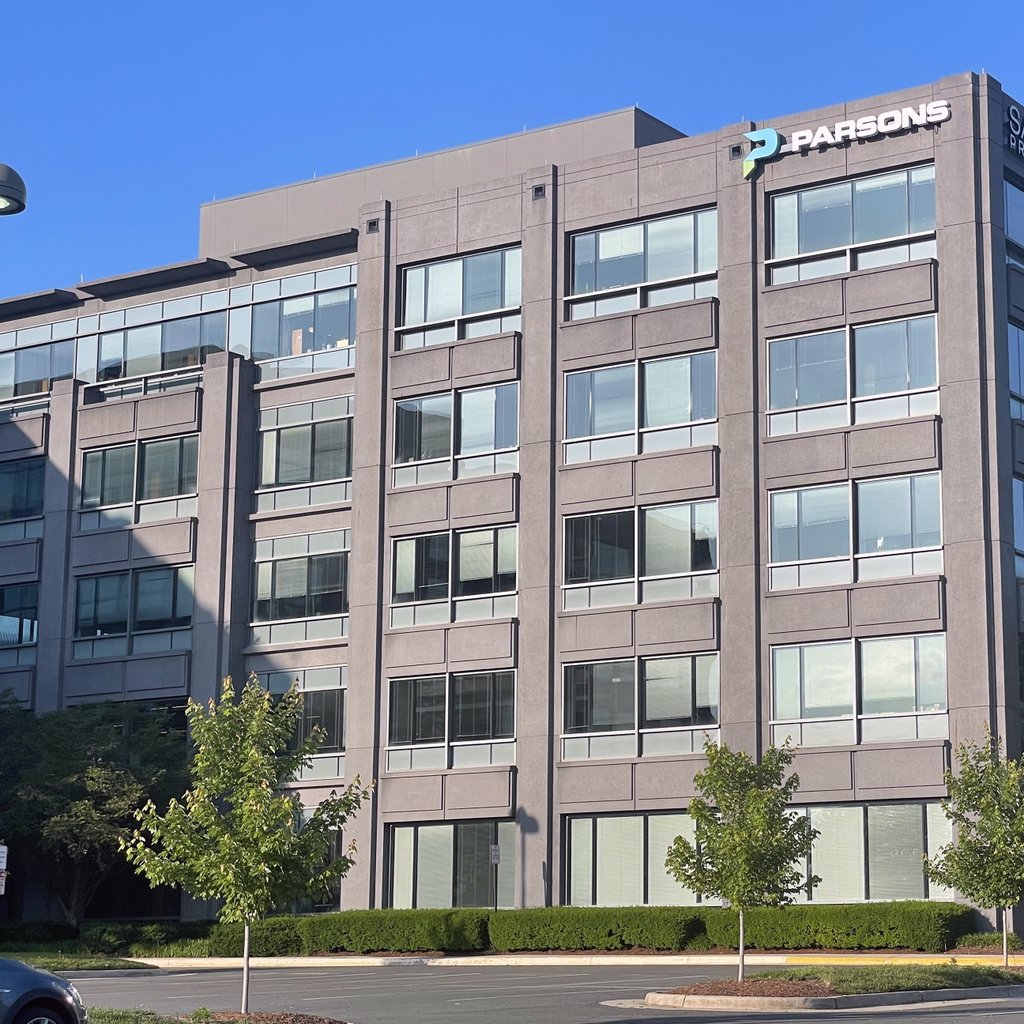
Parsons Corporation is an American multinational technology-focused defense, intelligence, and infrastructure engineering firm. Founded in 1944, Parsons is headquartered in Chantilly, Virginia, and serves both government and private sector organizations in more than 30 countries.
Parsons became a public company after its initial public offering (IPO) in 2019. It was included in the Fortune 1000 in 2020 and added to the S&P 400 in 2024. As of late 2025, Parsons employs over 21,000 professionals worldwide.
History
Parsons was founded by Ralph M. Parsons in 1944. Emerging at the end of World War II, Parsons' location in Los Angeles, proximity to organizations such as the Naval Air and Missile Test Center, Air Force Western Development Division (WDD) and Space and Missile Systems Organization (SAMSO), and partnership with Aerojet Engineering, enabled it acquire early developmental projects including electronics, instrumentation, ground checkout systems design, and engineering for aircraft, missiles and rocket facilities.
In the early 1950s, Parsons efforts in oil and petrochemical process plants came into focus with design/build efforts supporting both Shell and Gulf Oil in Texas. Parsons delivered systems that would also recover sulfur products for later use in industrial processes. Facilities came on line in 1952.
In 1961, Parsons founded the Ralph M. Parsons Foundation. The foundation became entirely independent from the company in 1974. Also in 1974, Parsons opened the first part of its headquarters in Pasadena.
In 1985, Parsons finalized an Employee Stock Ownership Program (ESOP), allocating shares in proportion to employees’ salaries. The ESOP program continues today.
Parsons interest in bridge projects grew through the 1980s, 1990s, and 2000s leveraging credentials enabled by acquisition of firms including DeLeuw, Cather, and Company in 1977 and Steinman, Boynton, Gronquist and Birdsall (SBGB) in 1988. These acquisitions brought experience and pedigree for design and/or refurbishment of iconic bridge structures including the Mackinac Bridge (Steinman, 1957), Tagus River Bridge, and Brooklyn Bridge. Parsons continues to provide inspection, maintenance, and upgrades for these bridges to this day. The company has also secured numerous design, design-build, and/or construction management jobs delivering new bridges such as the Tacoma Narrows Bridge (2007), John James Audubon Bridge, Windsor-Detroit (Gordie Howe) Bridge, and the Don Welge Memorial Bridge.
In April 1996, Parsons CEO at the time, Leonard Pieroni, was killed in a U.S. Air Force plane crash in the Balkans along with U.S. Commerce Secretary Ron Brown.
In October 2004, Parsons sold its hydrocarbons focused business, Parsons E&C Inc, to Australian firm Worley.
In 2012, Parsons developed the logistics strategy for movement of the Space Shuttle Endeavour from Los Angeles International Airport to the California Science Center near downtown. The effort was completed at no cost to NASA or the science center and was delivered by a team of local consultants that contributed expertise and resources for the effort. The activity brought to a close Parsons support for the Space Shuttle program; efforts that began in 1970 when NASA hired Parsons to perform an independent evaluation of facilities options for the Space Transportation System.
In late February 2019, Parsons announced the move of its headquarters from Pasadena, California to Centreville, Virginia.
On May 8, 2019, Parsons executed an Initial Public Offering of approximately $500 million on the New York Stock Exchange under the symbol PSN. When the transaction was conducted, Parsons returned to public status after leaving 35 years before to become a private, employed-owned company.
On September 1, 2023, Parsons announced the move of its headquarters to Chantilly, VA.
Discussing the company's business outlook in February 2024, CEO Carey Smith stated that the company believes it will continue to see strong demand for its solutions, including cyber, electronic warfare, signals collection, space, missile defense and critical Infrastructure protection given world-wide geopolitical outlook.
In 2025, Parsons Corporation pledged a $2.5 million donation to Donald Trump's demolition of the East Wing of the White House and construction of a White House State Ballroom. The New York Times reported on this donation, noting that the donation came at the same that the Parsons Corporation was jockeying for Trump administration contracts valued for more than $1 trillion.
Controversies
Healthcare centers in Iraq
In March 2004, Parsons was awarded a contract for a $243 million project to build 150 healthcare centers in Iraq. By March 2006, $186 million had been spent, with six centers complete and accepted by the U.S. Army Corps of Engineers (USACE), 135 centers partly complete, and one reassigned to another contractor. USACE progressively terminated the contract from September 2005 to March 2006, eventually requiring Parsons to complete a total of 20 centers, with the others to be completed by other contractors. The estimated cost for the completion of the other 121 centers was $36 million. Parsons and USACE disputed the degree to which the final 20 centers were completed. A report by the Special Inspector General for Iraq Reconstruction cited problems, including "high turnover among government personnel ... directions ... given without agreement from the contractor ... program managers' responsiveness to contractor communications, cost and time reporting, administration and quality assurance".
CBOSS positive train control system
In November 2011, Parsons was awarded a $138 million contract by the Peninsula Corridor Joint Powers Board (PCJPB), operators of Caltrain system in Northern California. The contract was to design and install communications-based overlay signal system positive train control (CBOSS PTC) as part of the Caltrain Modernization Program. While physical installation had commenced by September 2013, the project missed its 2015 completion deadline. Caltrain contracted a third party review to assess the project; it found program execution issues caused by both parties. By February 2017, although much of the system had been installed (but not fully tested), Caltrain terminated its contract with Parsons for failure to perform, and announced potential litigation. Caltrain then contracted Wabtec to complete the PTC system. Parsons maintained the contract was wrongly terminated and that the delay was beyond its control. Parsons and PCJPB filed lawsuits against each other seeking damages. During early stages of litigation, Parsons and PCJPB agreed that non-performance by subcontractor Alstom substantially caused the delays. With an agreement by Parsons to waive claims against PCJPB and PCJPB agreeing to assign all rights to recovery over to Parsons, they jointly sued Alstom for damages in September 2021. Judgment was reached in September 2024, with Alstom ordered to pay Parsons damages and interest of $135 million for breach of contract. Alstom has appealed the ruling. Wabtec completed the CBOSS PTC installation, employing 80% of the systems delivered by Parsons on the prior contract.
Project timeline
1940s
Less than two months after Parsons was founded, they were hired to provide turnkey engineering, management, and oil well drilling services to the great divide in Colorado, United States.
In 1948, Parsons began work to develop naval missile facilities at Point Mugu Missile facility. Also in 1948, the Atomic Energy Commission created the Idaho National Engineering Laboratory reactor so that it could conduct advanced nuclear experiments with civilian and military reactors. Parsons designed all facilities for test and support operations—including the largest cast-in-place concrete arch ever poured, a span of 3,000 feet.
1950s
In 1952, the U.S. Army awarded Parsons a multi-year design and construction contract role for numerous laboratory and test facilities at the Redstone Arsenal in Huntsville, Alabama.
In January 1953, Parsons began work on the construction of Turkey's first oil refinery near Batman, Turkey.
Between 1957 and 1960, Parsons designed Port Arguello Launch Complex 1 under contract to the U.S. Navy to support the launch of MIDAS and SAMOS programs using Atlas missiles. The facility was renamed Launch Complex 3 when the Air Force assumed control of the base from the Navy.
In 1958, Parsons began fabrication of electronics and instrumentation including miss-distance indicators for the Pershing Medium Range Ballistic Missile. In June 1959, Parsons was awarded a contract for Titan ICBM facility design to be constructed near Moses Lake Washington.
1960s
In 1961, Parsons designed the installation plans for each of the 1,000 Minuteman intercontinental ballistic missiles, which were used by the U.S. Air Force during the Cold War. In 1964, Ralph M. Parsons managed the design of the U.S. Treasury Philadelphia Mint expansion. Parsons created all construction and equipment specifications, oversaw construction, and prepared operations and maintenance manuals.
In 1962, Parsons commenced design efforts as civil architect-engineer for the Titan III Integrate, Transfer, and Launch (ITL) launch complex at Cape Canaveral Air Force Station. Upon completion, the complex became known as Launch Complex 40 and Launch Complex 41. Features of the ITL design included the Vertical Integration Building (VIB) and Solid Rocket Motor Assembly Building (SMAB). The complex supported its first launch in June 1965.
In February 1963, Parsons was contracted to design the Apollo Spacecraft Propulsion System Development Facility at White Sands New Mexico. In 1964, Parsons created a technical and economic blueprint for the North American Water and Power Alliance (NAWAPA), specifically in the United States, Canada and Mexico. The plan outlined concepts to build an integrated system of dams, channels, tunnels, reservoirs, hydroelectric plants, and pumping stations. The plan ultimately did not move forward due to environmental concerns and cost. In 1966, Parsons has served as general engineering consultant for the DC Washington Metro in Washington, D.C., which is a $11 billion, 103-mile rapid transit rail system connecting Washington, D.C., to its many suburbs.
In 1968, Parsons designed and constructed the entire Honolulu Airport in Honolulu, Hawaii (which is now referred to as the Daniel K. Inouye International Airport), including a 12,000-foot runway on an offshore reef to minimize noise in Honolulu. The runway is still used today. In 1968, Parsons began work to upgrade the Federal Aviation Administration (FAA) by providing plans, specifications, and standards to upgrade air traffic controls in 19 facilities. Today, Parsons provides 24/7/365 technical support services in all nine FAA regions and two specialized FAA centers. Again in 2001, Parsons was the prime contractor to implement modernization plans for the national airspace system.
1970s
In 1970, Parsons was hired by BP and ExxonMobil to perform engineering studies in Alaska to determine if the company could overcome the technical and logistical engineering challenges in Arctic oil production. In 1971, Parsons and Union Oil Co. of California demonstrated an improved sulfur recovery process at Union's Los Angeles pilot refinery plant. Based on the proven capacity to extract over 99% of the sulfur contained in the waste gases, the company was contracted to construct a full scale plant to harvest sulfur for industrial uses and reduce pollution.
Following arctic oil production study, Parsons was hired in 1974 as managing contractor for all oil and gas facilities for BP and Exxon's east side portion of Prudhoe Bay, Alaska. Also in 1974, Parsons provided modernization and construction program services for the new construction on more than 100 major U.S. postal installations. Parsons continues to provide services for the USPS today.
In 1975, Parsons was selected to transform Yanbu, Red Sea in Saudi Arabia into a thriving, modern port complex. The company provided the master plan, design, and construction management services for this self-contained industrial city of more that 100,000 people that produces oil, gas, and petrochemical products used worldwide. Continuing work in the middle east, Parsons won a contract to design, engineer, and manage the construction of multiple facilities for ARAMCO's Saudi Arabian gas program.
In October 1976, the Federal Railroad Administration awarded Parsons, as part of a joint venture, the Northeast Corridor Improvement Program contract, which was to provide a 456-mile, high-speed rail service between Boston, New York, and Washington, D.C. In 1977, Parsons completed a 4-year design-build turnkey program to build the Jeddah Airport in Saudi Arabia (also known as the King Abdulaziz International Airport).
In 1978, Parsons developed facilities criteria for assembly, testing, and system support of the U.S. Air Force's MX missile system at Vandenberg Space Force Base. In addition, as a subcontractor to Martin Marietta, Parsons supported development of the Space Shuttle ground system at Vandenberg. Parsons support to the ground infrastructure development effort continued into the mid-1980s.
1980s
In 1980, Los Angeles selected a Parsons joint venture to provide the Hyperion Wastewater Treatment Plant with program management, advanced planning, conceptual/detailed design, construction management, and startup services on all of their solids- and gas-handling expansion projects. In 1981, Parsons won a contract for the Petromin-Shell petrochemical design-build project, the company's largest petrochemical project ever, valued at $1.5 billion.
In 1985, the Los Angeles Metropolitan Transportation Authority hired a Parsons joint venture to provide commuter rail services and construction management of what would become the MTA's Red Line. Also in 1985, the U.S. Army Corps of Engineers selected Parsons to furnish design, systems integration, engineering, and procurement for the eight chemical weapons incineration plants throughout the continental United States. In 1986, Parsons designed, engineered, and managed construction of the Red Dog mine air and sea ports along with the entire complex.
In 1987, Parsons engineered, designed and delivered the Titan solid booster rocket test stand at Edwards Air Force Base in California. The test stand facility was originally designed by Parsons in the early 1960s to support Saturn V engine testing. Parsons rebuilt the facility again after a 1991 test failure of a Titan IV SRMU motor that caused significant facility damage.
In 1988, Parsons was hired to expand the Dulles (IAD) and Ronald Reagan (DCA) airports. Parsons also continued to oversee rehabilitation of the Brooklyn Bridge that had been started by bridge firm Steinman, Boynton, Gronquist, and Birdsall which had been acquired by Parsons that year.
1990s
In 1992, the Port of Los Angeles selected Parsons to design the Pier 300 $60 million dry bulk terminal for international commodities such as coal and petroleum coke. Also in 1992, Parsons provided engineering cleanup services to the Department of Energy for its uranium enrichment facilities in Ohio. The project was worth $125 million. In 1993, The Southern Nevada Water Authority selected Parsons as PM/CM for their $2 billion capital improvement program to increase water capacity for the Las Vegas Valley. The company continues to provide program and construction management services to SNWA most recently being awarded $150M contract in July 2023.
In 1995, Parsons designed, engineered and managed infrastructure elements of the National Ignition Facility's (NIF) construction. This facility houses the world's most powerful laser. Additionally in 1995, Parsons paid the U.S. $3.2 million to settle fraud claims, the settlement comes from allegations that Parsons knowingly overbilled the government on two Air Force contracts.
In 1996, Parsons was awarded a contract by the USAID to reconstruct Bosnia-Herzegovina, in the Balkans, after the war. In 1997, Parsons began the structural rehabilitation and catenary designs that incorporated electrifying the railroad tracks of the Tagus River Bridge (also known as the 25 de Abril Bridge) in Lisbon, Portugal. The company continues to support bridge improvements and maintenance.
In 1998, Parsons was hired by the U.S. Navy to manage UXO removal in Hawaii. The unexploded ordinances had accumulated in the island of Kaho`olawe. In 1999, Parsons completed the design for the New Baiyun Airport (now called the Guangzhou Baiyun International Airport) in Guangzhou, China. Also in 1999, Parsons was selected to design the Woodrow Wilson Bridge.
2000s
On September 19, 2002, Parsons was awarded a contract to design, build commission and operate the Savannah River Salt Waste Processing Facility (SWPF) in South Carolina by the department of energy. In 2020, the company completed all steps to begin the treatment of radioactive waste at the facility.
On October 8, 2002, Parsons proceeded on the Tacoma Narrows Bridge, a design-build project, originally scheduled to be constructed in 55 months. The bridge was completed and opened in 2007.
In June 2003, a joint-venture team led by Bechtel National, Inc. and Parsons Corporation was selected to destroy chemical weapons at the Bluegrass Army Depot in Kentucky. The final munition was destroyed in July 2023.
In 2004, Parsons served as project manager to cleanup and restore Onondaga Lake in New York.
The same year, a $29.5 million contract was given to both Parsons and Gilbert Southern/Massman Construction to redo a portion of the Escambia Bay Bridge near Pensacola, FL after Hurricane Ivan made landfall and knocked off 58 spans of the original bridge and misaligned 66 other spans. Traffic destined for the bridge was rerouted onto US 90 (exit 17 on I-10) for 2 months while construction was taking place, which caused severe traffic jams. The westbound bridge opened to traffic on October 4, six days ahead of schedule, while the eastbound lanes opened to traffic on November 20, 66 days after Ivan made landfall and 27 days ahead of schedule. Both contractors received $1.5 million in bonuses for the early completion.
In March 2004, Parsons was awarded a contract for a $243 million project to build 150 healthcare centers in Iraq. This contract generated controversy when the US Army Corps of Engineers terminated it, alleging Parsons' failure to perform and reassigning much of the remaining work to other contractors.
In 2005, a Parsons led joint venture constructed the north terminal of the Miami International Airport. The same joint venture (Parsons-Odebrecht) was awarded another contract for the airport to improve the baggage handling system.
In 2006, in a joint-venture, Parsons provided the design review and program/construction supervision for the construction of the Dubai Metro.
2010s
In 2010, Parsons, in a joint-venture, completed the $575 million, LEED-silver-certified Tom Bradley International Terminal Improvements and Baggage Screening Systems Project at Los Angeles International Airport. Parsons was the construction manager for this project. Parsons was also a part of the terminals update in 2006. The company also played a role in post 9/11 Pentagon rebuilding efforts, providing program and construction management services.
In 2011, in a joint-venture, Parsons completed construction on the John James Audubon Bridge in Mississippi. The John James Audubon Bridge is the longest cable-stayed bridge in the Western Hemisphere and is also the first Design-Build project undertaken by the Louisiana Department of Transportation and Development. On November 8, 2012, the bridge was awarded the Design-Build Institute of America (DBIA) 2012 Design Excellence Award.
In 2013, Parsons designed and managed construction for the earthworks, roads and water and wastewater in Saadiyat Island, Abu Dhabi, UAE.
In October 2014, Parsons was awarded a contract by Tecon Investments to oversee major elements of the Dubai Design District (D3).
In April 2016, Parsons received a construction management contract from the Architect of the Capitol to support the restoration, maintenance and renovation of federal structures on the Capitol campus.
In 2016, construction was completed for the World Trade Center Port Authority Trans-Hudson Transportation Hub (PATH). Parsons was responsible for the infrastructure group design of the project, as well as supervising the civil, geo-technical and environmental design of the project. It also oversees the installation of the project's communication and safety systems.
On June 12, 2017, Parsons accepted the award for the Operational Efficiency Project of the Year from the California Transportation Foundation (CTF) for their Intelligent Transportation System work on the I-80 Smart Corridor Project.
In 2017, Parsons worked with Abu Dhabi Airports Company as program manager for the Abu Dhabi International Airport expansion.
In April 2018, Leidos selected Parsons for the lead construction role to revitalize the US Antarctic research base at McMurdo Sound, Antarctica in support of the National Science Foundation US Antarctic Program. In December 2019, it was announced that Parsons and Leidos Holdings Inc. had earned spots on a $4 billion contract to support the cleanup of a former nuclear weapons site in southern Washington state.
2020s
In May 2020, Parsons was awarded the $61 million owner's engineer contract supporting construction of the new Windsor-Detroit (Gordie Howe) Bridge In September of the same year, Parsons was awarded the Recovery of Airbase Denied by Ordnance (RADBO) contract by the Air Force. The contract calls for production and delivery of armored vehicles equipped to clear mines or unexploded ordnance from airfields using three-kilowatt ZEUS laser weapon.
In December 2020, Parsons was awarded a four-year, $37 million competitively awarded contract by Naval Facilities Engineering Command Southwest (NAVFAC SW) to support rebuilding efforts at Naval Air Weapons Station China Lake.
In May 2021, Parsons secured a contract with $185 million ceiling to deliver Integrated Solutions for Situational Awareness (ISSA) for Space Systems Command In July, Parsons was awarded a seven-year contract from the Missile Defense Agency to continue work on the TEAMs Next contract to support the development of defense systems.
In June 2022, the Defense Health Agency awarded Parsons a spot on a potential $10 billion multi-award contract for military medical research and development support.
In 2023, Parsons was confirmed as the delivery partner for The Line at NEOM, a 170 km linear city being built in Saudi Arabia.
On July 7, 2023, U.S. officials announced that the final munition in the nation's obsolete stockpile of chemical weapons at the Blue Grass Chemical Agent Plant has been safely destroyed by Bechtel National, Inc. and Parsons. The team used neutralization and explosive destruction to eliminate the munition.
In March 2024, the National Nuclear Security Administration awarded a contract to Parsons Government Services and SeaTech Global Security Solutions to counter the smuggling of nuclear technology on a global basis. The contract has a combined award value of up to $1 billion. Also in March, the National Oceanic and Atmospheric Administration Office of Space Commerce selected Parsons Corporation to develop key elements of its civil space traffic coordination system called the Traffic Coordination System for Space, or TraCSS. The systems integration contract has a period of performance of 2-years and a potential value of $27 million.
In April 2024, Parsons secured a position on a $464 million contract with the United States Army Environmental Command (USAEC) for services involving hazardous waste, including perfluoroalkyl and polyfluoroalkyl substances (PFAS).
In June 2025, Parsons announced a partnership with IBM in pursuit of opportunities stemming from the Federal Aviation Administration's plans to update and modernize the United States air traffic control system.
Also in June 2025, Parsons was named #1 Program Management Firm by Engineering News-Record (ENR)'s annual list of Top 50 Program Management Firms.
In February 2026, Parsons ran a two-year project led by Honda in collaboration with i-Probe Inc. and the University of Cincinnati. Over the duration of the project, Honda test vehicles with vision and LiDAR sensors covered approximately 3,000 miles in central and southeastern Ohio. These tests were conducted in urban and rural areas, during variable weather conditions, and at different times of day.
On February 6, 2026, The US Army got a high-tech boost against rogue drones along the southern border with DroneArmor, a next-gen counter-unmanned aerial system (C-UAS) platform developed by Parsons Corporation.
On February 17, 2026, the Department of Homeland Security announced that Parsons will oversee and manage the completion of Mexico-United States border wall construction. In a February 10, 2026 interview on The Dan Bongino Show, then-Secretary Kristi Noem stated that DHS is on track to complete border wall construction by January 2028.
On February 17, 2026, The Pima County Sheriff's Department requested Parsons support to assist with the search for Nancy Guthrie. Parsons deployed BlueFly®, a Bluetooth and Wi-Fi sensor intended for search and rescue operations in challenging environments. The technology has been used on a variety of air and ground vehicles, and on foot in austere terrain. It provides first responders with a heat map to identify signals within a search area. BlueFly® was used on Feb. 3 during the Pima County Sheriff's Department Search and Rescue helicopter search over the Guthrie neighborhood. The technology was subsequently used for additional search operations by helicopter, ground vehicles, and on foot.
On February 18, 2026, Sealing Technologies, a Parsons Corporation company, announced that it received an Intent to Award notification from the United States Cyber Command (USCYBERCOM) for a sole-source contract to begin production on the company's Joint Cyber Hunt Kit (JCHK) solution. The three-year period of performance contract is new work for the company with an anticipated ceiling value of up to $500 million.
Management
Carey Smith serves as chairwoman, President, and CEO of Parsons. Matt Oflios serves as the CFO. Parsons operates in two business segments: Federal Solutions and Critical Infrastructure. Additionally the company performs international work especially in the Middle East in countries such as Saudi Arabia.
The board of directors consists of 11 members. As of March 2023, members include:
Carey Smith: Chairwoman, President, And Chief Executive Officer
George Ball, Former Chief Financial Officer Of Parsons Corporation
Mark K. Holdsworth, Founder And Managing Partner Of The Holdsworth Group
Steven F. Leer, Former Executive Chairman Of The Board Of Directors Of Arch Coal, Inc.
Ellen Lord, Former Under Secretary Of Defense For Acquisition And Sustainment For The U.S. Department Of Defense
Letitia A. Long, Former Director Of The National Geospatial-Intelligence Agency (NGA)
Darren W. McDew, General USAF (ret), Retired U.S. Air Force General
Harry T. McMahon, Former Executive Vice Chairman Of Bank of America Merrill Lynch
M. Christian Mitchell, Former National Managing Partner Of Deloitte
Suzanne M. “Zan” Vautrinot, Major General USAF (ret), President Of Kilovolt Consulting, Inc.
David C. Wajsgras, Former President Of The Intelligence, Information And Services (IIS) Business (Raytheon)
Acquisitions
Companies acquired by Parsons listed by date of acquisition (incomplete list). Information is current as of Jan 2026.
1944, Ralph M. Parsons Company formed
Jun 1961, Anaconda-Jurden Associates, Inc.
Jun 1966, Vitro Engineering
Jun 1971, Dillingham Engineering Pty. Ltd.
Sep 1977, S.I.P., Inc.
Oct 1977, DeLeuw, Cather and Company
May 1981, Engineering Science, Inc.
Mar 1985, C.T. Main Corporation
1988, Steinman, Boynton, Gronquist & Birdsall
Mar 1995, Gilbert-Commonwealth, Inc.
May 2005, Alaris Group
Jun 2006, 3D/International
Mar 2009, McMunn Associates
Nov 2011, Sparta, Inc
Apr 2014, Delcan, Inc.
May 2014, Secure Mission Solutions
Nov 2017, Williams Electric
May 2018, Polaris Alpha
Jan 2019, OG Systems
Jul 2019, QRC Technologies
Oct 2020, Braxton Science & Technology Group
Jun 2021, Blackhorse Solutions
Jul 2021, Echo Ridge LLC
Jun 2022, Xator Corporation
Apr 2023, IPKeys Power Partners and IPKeys Cyber Partners
Aug 2023, Sealing Technologies, Inc.
Jul 2024, BlackSignal Technologies, Inc.
Oct 2024, BCC Engineering, Inc.
Feb 2025, TRS Group, Inc.
Jul 2025, Chesapeake Technology International Corp.
Oct 2025, Applied Sciences Consulting, Inc.
Jan 2026, Altamira Technologies.
来源:维基百科 (英语), CC BY-SA 4.0 · 在维基百科上查看 ↗
10年表现 收入、净利润、利润率和每股收益趋势
估值 P/E、P/S、P/B、EV/EBITDA 比率 — 该股票是昂贵还是便宜?
| 指标 | 5年趋势 | PSN | 5年均值 | 同行中位数 | 结论 |
|---|---|---|---|---|---|
| P/E (TTM) | 28.15年均值 ≈45.2 | ≈45.2 | 16.8 | 估值过高 | |
| P/S (TTM) | 0.45年均值 ≈0.5 | ≈0.5 | 0.6 | 低估 | |
| 市净率 (MRQ) | 0.95年均值 ≈1.2 | ≈1.2 | 2.2 | 低估 | |
| EV / EBITDA (企业价值 / EBITDA) | 7.35年均值 ≈11.8 | ≈11.8 | 12.4 | 低估 | |
| 股价/自由现金流 (TTM) | 7.65年均值 ≈8.4 | ≈8.4 | · | · | |
| 市现率 (TTM) | 6.15年均值 ≈7.4 | ≈7.4 | 10.4 | 低估 | |
| EV / Revenue (市值/营收) | 0.55年均值 ≈0.6 | ≈0.6 | · | · | |
| EV / FCF (市值/自由现金流) | 7.55年均值 ≈10.3 | ≈10.3 | · | · | |
| 市净率(有形资产) (MRQ) | 1.05年均值 ≈14.7 | ≈14.7 | · | · | |
| PEG Ratio (市盈率增长比) | ≈1.6 | · | · | · |
同行中位数按每项指标的标准化基础计算,可能与本股票显示的TTM/MRQ基础不完全匹配。
盈利能力 毛利率、营业利润率和净利率;股本回报率 (ROE)、资产回报率 (ROA)、投入资本回报率 (ROIC)
| 指标 | 5年趋势 | PSN | 5年均值 | 同行中位数 | 结论 |
|---|---|---|---|---|---|
| 营业利润率 (TTM) | 4.9%5年均值 ≈5.3% | ≈5.3% | 8.3% | 弱 | |
| EBITDA Margin (息税折旧摊销前利润率) | 6.6%5年均值 ≈5.3% | ≈5.3% | 8.3% | 弱 | |
| 税前利润率 (TTM) | 4.4%5年均值 ≈4.7% | ≈4.7% | 6.6% | 弱 | |
| 净利润率 (TTM) | 2.5%5年均值 ≈2.9% | ≈2.9% | 5.1% | 弱 | |
| ROA (TTM) | 2.7%5年均值 ≈3.3% | ≈3.3% | 6.3% | 弱 | |
| ROE (TTM) | 6.1%5年均值 ≈7.1% | ≈7.1% | 14.9% | 弱 | |
| ROIC | 8.7%5年均值 ≈6.7% | ≈6.7% | 12.1% | 弱 |
财务健康 债务、流动性、偿付能力 — 资产负债表强度
| 指标 | 5年趋势 | PSN | 5年均值 | 同行中位数 | 结论 |
|---|---|---|---|---|---|
| 负债/股东权益比率 (MRQ) | 0.65年均值 ≈0.4 | ≈0.4 | 0.8 | 低负债 | |
| 流动比率 (MRQ) | 1.75年均值 ≈1.5 | ≈1.5 | 1.7 | 持平 | |
| Quick Ratio (速动比率) | 1.05年均值 ≈0.9 | ≈0.9 | 1.2 | 低流动性 | |
| 长期负债/股东权益 (MRQ) | 0.65年均值 ≈0.4 | ≈0.4 | 0.8 | 低负债 | |
| Interest Coverage (利息保障倍数) | 8.15年均值 ≈8.2 | ≈8.2 | · | · |
成长 营收、每股收益 (EPS) 和净利润增长:同比、3年复合年增长率 (CAGR)、5年复合年增长率 (CAGR)
| 指标 | 5年趋势 | PSN | 5年均值 | 同行中位数 | 结论 |
|---|---|---|---|---|---|
| Revenue YoY (营收同比增长) | -5.7%5年均值 ≈11.2% | ≈11.2% | · | · | |
| Revenue CAGR 3Y (营收3年复合年增长率) | 14.9%5年均值 ≈16.4% | ≈16.4% | · | · | |
| Revenue CAGR 5Y (营收5年复合年增长率) | 10.2% | · | · | · | |
| EPS YoY | 3.8%5年均值 ≈24.9% | ≈24.9% | · | · | |
| Net Income YoY (净利润同比增长) | 2.6%5年均值 ≈26.2% | ≈26.2% | · | · | |
| EPS CAGR 3Y (每股收益年复合增长率(3年)) | 36.2%5年均值 ≈34.3% | ≈34.3% | · | · | |
| EPS CAGR 5Y (每股收益年复合增长率(5年)) | 17.8% | · | · | · | |
| Net Income CAGR 3Y (净利润年复合增长率(3年)) | 35.6%5年均值 ≈35.9% | ≈35.9% | · | · | |
| Net Income CAGR 5Y (净利润年复合增长率(5年)) | 19.6% | · | · | · |
资本效率 资产周转率、库存周转率、应收账款周转率
| 指标 | 5年趋势 | PSN | 5年均值 | 同行中位数 | 结论 |
|---|---|---|---|---|---|
| Asset Turnover (资产周转率) | 1.15年均值 ≈1.1 | ≈1.1 | 1.1 | 持平 | |
| Receivables Turnover (应收账款周转率) | 5.75年均值 ≈6.2 | ≈6.2 | 5.4 | 持平 | |
| Revenue / Employee (年营业收入 ÷ 员工人数(报告的 headcount,yfinance)。衍生数据 — 非存储的 SEC-XBRL 概念。) | ≈$303.1K | · | · | · |
价值 · ≈ 5年均值 · 行业中值 · 相对于中值的评判
收益历史 每股收益实际值 vs 预估值,惊喜%,达标率,下次财报日期
| 期间 | 报告 | EPS Actual | EPS 预期 | 惊喜 |
|---|---|---|---|---|
| 2026年6月30日 | 八月 4, 2026 | $0.86 | $0.76 | 12.6% |
| 2026年3月31日 | $0.79 | $0.69 | 14.1% | |
| 2025年12月31日 | $0.75 | $0.80 | -6.2% | |
| 2025年9月30日 | $0.86 | $0.76 | 13.4% | |
| 2025年6月30日 | $0.78 | $0.75 | 4.6% | |
| 2025年3月31日 | $0.78 | $0.75 | 4.1% |
完整基本面 所有年度指标 — 损益表、资产负债表、现金流量表
损益表
| 指标 | 趋势 | 2025 | 2024 | 2023 | 2022 | 2021 | 2020 | 2019 | 2018 | 2017 |
|---|---|---|---|---|---|---|---|---|---|---|
| Revenue | $6.36B | $6.75B | $5.44B | $4.20B | $3.66B | $3.92B | $3.95B | $3.56B | $3.02B | |
| Cost of Revenue | $4.93B | $5.34B | $4.24B | $3.25B | $2.81B | $3.04B | $3.12B | $2.80B | $2.40B | |
| SG&A Expense | $1.02B | $955M | $870M | $777M | $757M | $729M | $781M | $597M | $506M | |
| Operating Income | $418M | $428M | $288M | $186M | $132M | $178M | $92M | $205M | $151M | |
| Interest Expense | $51M | $52M | $31M | $23M | $18M | $21M | $24M | $21M | $16M | |
| Interest Income | $7M | $11M | $2M | $966.0K | $396.0K | $787.0K | $1M | $3M | $2M | |
| Other Non-op | $9M | $-2M | $5M | $3M | $-3M | $4M | $-2M | $-2M | $6M | |
| Pretax Income | $383M | $368M | $264M | $166M | $113M | $161M | $67M | $260M | $133M | |
| Income Tax | $74M | $77M | $56M | $40M | $24M | $42M | $-70M | $20M | $21M | |
| Net Income | $241M | $235M | $161M | $97M | $64M | $99M | $121M | $222M | $97M | |
| EPS (Basic) | $2.26 | $2.21 | $1.53 | $0.93 | $0.62 | $0.98 | $1.30 | $2.78 | $1.16 | |
| EPS (Diluted) | $2.20 | $2.12 | $1.42 | $0.87 | $0.59 | $0.97 | $1.30 | $2.78 | $1.16 | |
| Shares (Basic) | 106,828,000 | 106,274,000 | 104,992,000 | 103,758,000 | 102,544,000 | 100,848,000 | 92,419,000 | 80,014,000 | 83,574,000 | |
| Shares (Diluted) | 109,693,000 | 112,174,000 | 115,082,000 | 113,483,000 | 112,127,000 | 101,205,000 | 92,753,000 | 80,014,000 | 83,574,000 | |
| EBITDA | $418M | $428M | $288M | $186M | $132M | $178M | $92M | · | · |
资产负债表
| 指标 | 趋势 | 2025 | 2024 | 2023 | 2022 | 2021 | 2020 | 2019 | 2018 | 2017 |
|---|---|---|---|---|---|---|---|---|---|---|
| Cash & Equivalents | $466M | $454M | $273M | $263M | $343M | $484M | $183M | $280M | · | |
| Receivables | $1.12B | $1.10B | $916M | $717M | $598M | $699M | $671M | $623M | · | |
| Prepaid Expense | $177M | $167M | $191M | $106M | $111M | $81M | $84M | $69M | · | |
| Current Assets | $2.68B | $2.46B | $2.14B | $1.72B | $1.63B | $1.84B | $1.53B | $1.49B | · | |
| PP&E (Net) | $151M | $112M | $99M | $96M | $104M | $121M | $123M | $92M | $88M | |
| PP&E (Gross) | $455M | $398M | $383M | $368M | $364M | $368M | $349M | $296M | · | |
| Accum. Depreciation | $304M | $286M | $284M | $272M | $260M | $247M | $226M | $205M | · | |
| Goodwill | $2.19B | $2.08B | $1.79B | $1.66B | $1.41B | $1.26B | $1.05B | $737M | $497M | |
| Intangibles | $326M | $350M | $276M | $254M | $208M | $246M | $260M | $180M | · | |
| Other Non-current Assets | $59M | $56M | $72M | $66M | $46M | $56M | $61M | $46M | · | |
| Total Assets | $5.77B | $5.49B | $4.80B | $4.20B | $3.83B | $3.94B | $3.45B | $2.61B | · | |
| Accounts Payable | $251M | $208M | $243M | $201M | $196M | $226M | $217M | $226M | · | |
| Short-term Debt | $0 | $463M | $0 | · | · | · | · | $0 | · | |
| Current Liabilities | $1.53B | $1.92B | $1.41B | $1.11B | $1.03B | $1.19B | $1.14B | $1.01B | · | |
| Capital Leases | $94M | $114M | $118M | $111M | $149M | $182M | $204M | $0 | · | |
| Deferred Tax | $12M | $11M | $10M | $12M | $11M | $12M | $10M | $6M | · | |
| Other Non-current Liabilities | $95M | $96M | $120M | $109M | $95M | $132M | $126M | $128M | · | |
| Total Liabilities | $3.00B | $2.95B | $2.43B | $2.10B | $1.89B | $2.08B | $1.79B | $1.66B | · | |
| Long-term Debt | $1.24B | $784M | $746M | $744M | $592M | $540M | $249M | $429M | · | |
| Total Debt | $1.24B | $1.71B | $746M | $744M | $592M | $590M | · | · | · | |
| Common Stock | $146M | $147M | $146M | $146M | $146M | $147M | $146M | · | · | |
| Retained Earnings | $661M | $427M | $204M | $43M | $-54M | $-121M | $-218M | $12M | · | |
| Treasury Stock | $793M | $815M | $827M | $845M | $867M | $899M | $934M | $957M | · | |
| AOCI | $-21M | $-27M | $-15M | $-18M | $-10M | $-14M | $-14M | $-23M | · | |
| Stockholders' Equity | $2.64B | $2.42B | $2.29B | $2.04B | $1.90B | $1.81B | $1.63B | $-968M | · | |
| Liabilities + Equity | $5.77B | $5.49B | $4.80B | $4.20B | $3.83B | $3.94B | $3.45B | $2.61B | · | |
| Shares Outstanding | 56,103,965 | 52,657,447 | 45,960,122 | 40,960,845 | 33,331,494 | 25,719,350 | 21,772,888 | 0 | · |
现金流
| 指标 | 趋势 | 2025 | 2024 | 2023 | 2022 | 2021 | 2020 | 2019 | 2018 | 2017 |
|---|---|---|---|---|---|---|---|---|---|---|
| D&A | $116M | $99M | $120M | $121M | $144M | $128M | $126M | $70M | $35M | |
| Stock-based Comp | $43M | $56M | $34M | $23M | $20M | $15M | $8M | $0 | $0 | |
| Deferred Tax | $44M | $6M | $-9M | $-844.0K | $-3M | $1M | $-123M | $-1M | $5M | |
| Amort. of Intangibles | $70M | $56M | $77M | $78M | $103M | $88M | $88M | $37M | $6M | |
| Restructuring | · | · | · | · | · | $2M | $3M | · | · | |
| Operating Cash Flow | $478M | $524M | $408M | $238M | $206M | $289M | $220M | $285M | $265M | |
| CapEx | $68M | $49M | $40M | $31M | $21M | $34M | $68M | $29M | $28M | |
| Investing Cash Flow | $-256M | $-557M | $-376M | $-417M | $-241M | $-346M | $-571M | $-503M | $-53M | |
| Stock Issued | $9M | $8M | $6M | $5M | $6M | $4M | $537M | $0 | · | |
| Stock Repurchased | $125M | $25M | $11M | $22M | $22M | $0 | $6M | · | · | |
| Net Stock Activity | $-116M | $-17M | $-5M | $-17M | $-16M | $4M | · | · | · | |
| Dividends Paid | · | · | · | · | $0 | $0 | $52M | $0 | $0 | |
| Financing Cash Flow | $-214M | $219M | $-22M | $100M | $-107M | $348M | $266M | $55M | $-160M | |
| Net Change in Cash | $13M | $181M | $10M | $-81M | $-143M | $292M | $-86M | $-165M | $53M | |
| Taxes Paid | $31M | $60M | $74M | $32M | $22M | $55M | $60M | $17M | $14M | |
| Free Cash Flow | $410M | $474M | $367M | $207M | $184M | $255M | $153M | · | · | |
| Levered FCF | $369M | $434M | $343M | $189M | $170M | $240M | $104M | · | · |
盈利能力
| 指标 | 趋势 | 2025 | 2024 | 2023 | 2022 | 2021 | 2020 | 2019 | 2018 | 2017 |
|---|---|---|---|---|---|---|---|---|---|---|
| Operating Margin | 6.6% | 6.3% | 5.3% | 4.4% | 3.6% | 4.5% | 2.3% | · | · | |
| Net Margin | 3.8% | 3.5% | 3.0% | 2.3% | 1.8% | 2.5% | 3.0% | · | · | |
| Pretax Margin | 6.0% | 5.5% | 4.9% | 4.0% | 3.1% | 4.1% | 1.7% | · | · | |
| EBITDA Margin | 6.6% | 6.3% | 5.3% | 4.4% | 3.6% | 4.5% | 2.3% | · | · | |
| ROA | 4.3% | 4.6% | 3.6% | 2.4% | 1.7% | 2.7% | 4.0% | · | · | |
| ROE | 9.5% | 10.0% | 7.4% | 4.9% | 3.5% | 5.7% | 36.4% | · | · | |
| ROIC | 8.7% | 8.2% | 7.5% | 5.1% | 4.2% | 5.5% | 11.5% | · | · |
流动性与偿付能力
| 指标 | 趋势 | 2025 | 2024 | 2023 | 2022 | 2021 | 2020 | 2019 | 2018 | 2017 |
|---|---|---|---|---|---|---|---|---|---|---|
| Current Ratio | 1.8 | 1.3 | 1.5 | 1.6 | 1.6 | 1.6 | 1.3 | · | · | |
| Quick Ratio | 1.0 | 0.8 | 0.8 | 0.9 | 0.9 | 1.0 | 0.7 | · | · | |
| Debt / Equity | 0.5 | 0.7 | 0.3 | 0.4 | 0.3 | 0.3 | · | · | · | |
| LT Debt / Equity | 0.5 | 0.3 | 0.3 | 0.4 | 0.3 | 0.3 | · | · | · | |
| Interest Coverage | 8.1 | 8.3 | 9.2 | 8.0 | 7.5 | 8.5 | 3.9 | · | · |
效率
| 指标 | 趋势 | 2025 | 2024 | 2023 | 2022 | 2021 | 2020 | 2019 | 2018 | 2017 |
|---|---|---|---|---|---|---|---|---|---|---|
| Asset Turnover | 1.1 | 1.3 | 1.2 | 1.0 | 0.9 | 1.1 | 1.3 | · | · | |
| Receivables Turnover | 5.7 | 6.7 | 6.7 | 6.4 | 5.6 | 5.7 | 6.1 | · | · |
每股
| 指标 | 趋势 | 2025 | 2024 | 2023 | 2022 | 2021 | 2020 | 2019 | 2018 | 2017 |
|---|---|---|---|---|---|---|---|---|---|---|
| Book Value / Share | $47.09 | $45.89 | $49.77 | $49.89 | $57.03 | $70.52 | $74.86 | · | · | |
| Revenue / Share | $58.02 | $60.18 | $47.29 | $36.97 | $32.65 | $38.72 | $42.64 | · | · | |
| Cash Flow / Share | $4.36 | $4.67 | $3.54 | $2.09 | $1.83 | $2.86 | $2.37 | · | · | |
| Cash / Share | $8.31 | $8.61 | $5.94 | $6.41 | $10.28 | $18.80 | $8.39 | · | · | |
| Dividend / Share | · | · | · | · | · | · | · | $0.00 | · | |
| EPS (TTM) | $2.20 | $2.12 | $1.42 | $0.87 | $0.59 | $0.97 | $1.30 | · | · |
增长率
| 指标 | 趋势 | 2025 | 2024 | 2023 | 2022 | 2021 | 2020 | 2019 | 2018 | 2017 |
|---|---|---|---|---|---|---|---|---|---|---|
| Revenue YoY | -5.7% | 24.0% | 29.7% | 14.6% | -6.6% | · | · | · | · | |
| Revenue CAGR 3Y | 14.9% | 22.6% | 11.6% | · | · | · | · | · | · | |
| Revenue CAGR 5Y | 10.2% | · | · | · | · | · | · | · | · | |
| EPS YoY | 3.8% | 49.3% | 63.2% | 47.5% | -39.2% | · | · | · | · | |
| EPS CAGR 3Y | 36.2% | 53.2% | 13.6% | · | · | · | · | · | · | |
| EPS CAGR 5Y | 17.8% | · | · | · | · | · | · | · | · | |
| Net Income YoY | 2.6% | 45.9% | 66.7% | 50.9% | -35.0% | · | · | · | · | |
| Net Income CAGR 3Y | 35.6% | 54.2% | 17.8% | · | · | · | · | · | · | |
| Net Income CAGR 5Y | 19.6% | · | · | · | · | · | · | · | · |
估值 (TTM)
| 指标 | 趋势 | 2025 | 2024 | 2023 | 2022 | 2021 | 2020 | 2019 | 2018 | 2017 |
|---|---|---|---|---|---|---|---|---|---|---|
| Revenue TTM | $6.36B | $6.75B | $5.44B | $4.20B | $3.66B | $3.92B | $3.95B | · | · | |
| Net Income TTM | $241M | $235M | $161M | $97M | $64M | $99M | $121M | · | · | |
| Market Cap | $3.47B | $4.86B | $2.88B | $1.89B | $1.12B | $936M | $899M | · | · | |
| Enterprise Value | $4.24B | $6.12B | $3.36B | $2.38B | $1.37B | $1.04B | · | · | · | |
| P/E | 28.1 | 43.5 | 44.2 | 53.2 | 57.0 | 37.5 | 31.8 | · | · | |
| P/S | 0.5 | 0.7 | 0.5 | 0.5 | 0.3 | 0.2 | 0.2 | · | · | |
| P/B | 1.3 | 2.0 | 1.3 | 0.9 | 0.6 | 0.5 | 0.6 | · | · | |
| P / Tangible Book | 26.8 | · | 13.2 | 14.8 | 4.0 | 3.1 | · | · | · | |
| P / Cash Flow | 7.2 | 9.3 | 7.1 | 8.0 | 5.5 | 3.2 | 4.1 | · | · | |
| P / FCF | 8.4 | 10.2 | 7.8 | 9.2 | 6.1 | 3.7 | 5.9 | · | · | |
| EV / EBITDA | 10.1 | 14.3 | 11.6 | 12.8 | 10.4 | 5.9 | · | · | · | |
| EV / FCF | 10.3 | 12.9 | 9.1 | 11.5 | 7.4 | 4.1 | · | · | · | |
| EV / Revenue | 0.7 | 0.9 | 0.6 | 0.6 | 0.4 | 0.3 | · | · | · | |
| Dividend Yield | · | · | · | · | 0.00% | 0.00% | 5.8% | · | · | |
| Earnings Yield | 3.6% | 2.3% | 2.3% | 1.9% | 1.8% | 2.7% | 3.1% | · | · | |
| Payout Ratio | · | · | · | · | 0.00% | 0.00% | 43.2% | · | · | |
| Annual Payout | · | · | · | · | $0 | $0 | $52M | · | · |
损益表
| 指标 | 趋势 | Q2 2026 | Q1 2026 | Q4 2025 | Q3 2025 | Q2 2025 | Q1 2025 | Q4 2024 | Q3 2024 | Q2 2024 | Q1 2024 | Q4 2023 | Q3 2023 | Q2 2023 | Q1 2023 | Q4 2022 | Q3 2022 |
|---|---|---|---|---|---|---|---|---|---|---|---|---|---|---|---|---|---|
| Revenue | $1.58B | $1.49B | $1.60B | $1.62B | $1.58B | $1.55B | $1.73B | $1.81B | $1.67B | $1.54B | $1.49B | $1.42B | $1.36B | $1.17B | $1.10B | $1.13B | |
| Cost of Revenue | $1.28B | $1.13B | $1.23B | $1.26B | $1.24B | $1.20B | $1.36B | $1.45B | $1.32B | $1.21B | $1.13B | $1.12B | $1.07B | $917M | $860M | $872M | |
| SG&A Expense | $260M | $268M | $260M | $260M | $252M | $244M | $265M | $246M | $223M | $221M | $238M | $221M | $212M | $199M | $195M | $197M | |
| Operating Income | $1M | $96M | $105M | $108M | $96M | $109M | $100M | $115M | $111M | $102M | $77M | $83M | $76M | $51M | $53M | $64M | |
| Interest Expense | $16M | $16M | $13M | $14M | $13M | $12M | $13M | $13M | $13M | $13M | $9M | $9M | $7M | $6M | $8M | $6M | |
| Interest Income | $565.0K | $2M | $2M | $2M | $1M | $2M | $2M | $4M | $4M | $1M | $600.0K | $492.0K | $306.0K | $793.0K | $348.0K | $382.0K | |
| Other Non-op | $18M | $-189.0K | $637.0K | $2M | $5M | $2M | $-1M | $2M | $895.0K | $-3M | $3M | $-191.0K | $543.0K | $1M | $3M | $-685.0K | |
| Pretax Income | $4M | $81M | $95M | $98M | $89M | $101M | $88M | $108M | $103M | $68M | $72M | $75M | $70M | $47M | $48M | $57M | |
| Income Tax | $4M | $16M | $20M | $16M | $19M | $19M | $19M | $23M | $22M | $13M | $14M | $15M | $15M | $12M | $12M | $14M | |
| Net Income | $-15M | $53M | $56M | $64M | $55M | $66M | $54M | $72M | $69M | $40M | $45M | $47M | $43M | $26M | $28M | $30M | |
| EPS (Basic) | $-0.14 | $0.49 | $0.52 | $0.60 | $0.52 | $0.62 | $0.51 | $0.68 | $0.65 | $0.37 | $0.43 | $0.45 | $0.41 | $0.24 | $0.26 | $0.29 | |
| EPS (Diluted) | $-0.14 | $0.49 | $0.51 | $0.59 | $0.50 | $0.60 | $0.47 | $0.65 | $0.63 | $0.37 | $0.39 | $0.42 | $0.38 | $0.23 | $0.24 | $0.27 | |
| Shares (Basic) | 106,982,000 | 107,182,000 | · | 106,763,000 | 106,997,000 | 106,831,000 | · | 106,291,000 | 106,303,000 | 106,037,000 | · | 104,971,000 | 104,908,000 | 104,805,000 | · | 103,608,135 | |
| Shares (Diluted) | 107,682,000 | 108,392,000 | · | 109,078,000 | 110,102,000 | 111,026,000 | · | 111,086,000 | 110,524,000 | 114,362,000 | · | 115,066,000 | 114,708,000 | 114,754,000 | · | 113,442,755 | |
| EBITDA | $1M | $96M | · | $108M | $96M | $109M | · | $115M | $111M | $102M | · | $83M | $76M | $51M | · | $64M |
资产负债表
| 指标 | 趋势 | Q2 2026 | Q1 2026 | Q4 2025 | Q3 2025 | Q2 2025 | Q1 2025 | Q4 2024 | Q3 2024 | Q2 2024 | Q1 2024 | Q4 2023 | Q3 2023 | Q2 2023 | Q1 2023 | Q4 2022 | Q3 2022 |
|---|---|---|---|---|---|---|---|---|---|---|---|---|---|---|---|---|---|
| Cash & Equivalents | $266M | $284M | $466M | $423M | $411M | $270M | $454M | $559M | $528M | $423M | · | $205M | $179M | $220M | · | $148M | |
| Receivables | $1.15B | $1.10B | $1.12B | $1.22B | $1.17B | $1.12B | $1.10B | $1.03B | $1.04B | $1.02B | · | $907M | $949M | $764M | · | $711M | |
| Prepaid Expense | $228M | $192M | $177M | $180M | $178M | $184M | $167M | $171M | $199M | $213M | · | $147M | $140M | $134M | · | $110M | |
| Current Assets | $2.72B | $2.59B | $2.68B | $2.65B | $2.59B | $2.40B | $2.46B | $2.55B | $2.57B | $2.43B | · | $2.02B | $1.98B | $1.80B | · | $1.61B | |
| PP&E (Net) | $160M | $155M | $151M | $126M | $123M | $122M | $112M | $101M | $98M | $98M | $99M | $99M | $95M | $95M | $96M | $95M | |
| PP&E (Gross) | $456M | $463M | $455M | $432M | $424M | $415M | $398M | $389M | $391M | $389M | · | $390M | $383M | $373M | · | $372M | |
| Accum. Depreciation | $296M | $308M | $304M | $306M | $301M | $293M | $286M | $288M | $293M | $291M | · | $291M | $288M | $278M | · | $277M | |
| Goodwill | $2.42B | $2.42B | $2.19B | $2.16B | $2.16B | $2.11B | $2.08B | $1.93B | $1.79B | $1.79B | $1.79B | $1.80B | $1.69B | $1.66B | $1.66B | $1.66B | |
| Intangibles | $384M | $408M | $326M | $339M | $361M | $340M | $350M | $308M | $248M | $262M | · | $282M | $240M | $236M | · | $273M | |
| Other Non-current Assets | $59M | $58M | $59M | $62M | $56M | $57M | $56M | $55M | $72M | $71M | · | $67M | $69M | $66M | · | $54M | |
| Total Assets | $6.11B | $6.01B | $5.77B | $5.74B | $5.72B | $5.45B | $5.49B | $5.44B | $5.24B | $5.10B | · | $4.73B | $4.51B | $4.26B | · | $4.09B | |
| Accounts Payable | $247M | $233M | $251M | $271M | $288M | $289M | $208M | $300M | $253M | $274M | · | $266M | $237M | $209M | · | $201M | |
| Short-term Debt | · | · | $0 | $0 | $85M | $435M | $463M | $115M | · | · | · | · | · | · | · | · | |
| Current Liabilities | $1.64B | $1.48B | $1.53B | $1.59B | $1.61B | $1.87B | $1.92B | $1.65B | $1.43B | $1.35B | · | $1.39B | $1.29B | $1.14B | · | $1.15B | |
| Capital Leases | $120M | $121M | $94M | $98M | $100M | $108M | $114M | $98M | $98M | $107M | · | $119M | $129M | $107M | · | $121M | |
| Deferred Tax | $10M | $12M | $12M | $18M | $19M | $11M | $11M | $28M | $10M | $10M | · | $20M | $20M | $13M | · | $10M | |
| Other Non-current Liabilities | $91M | $104M | $95M | $102M | $111M | $107M | $96M | $93M | $111M | $114M | · | $112M | $110M | $107M | · | $98M | |
| Total Liabilities | $3.36B | $3.26B | $3.00B | $3.07B | $3.10B | $2.90B | $2.95B | $3.03B | $2.92B | $2.86B | · | $2.48B | $2.32B | $2.13B | · | $2.09B | |
| Long-term Debt | $1.47B | $1.51B | $1.24B | $1.24B | $1.24B | $785M | $784M | $1.13B | $1.25B | $1.25B | · | $820M | $745M | $744M | · | $695M | |
| Total Debt | $1.47B | $1.51B | · | $1.24B | $1.41B | $1.66B | · | $1.25B | $1.25B | $1.25B | · | $820M | $745M | $744M | · | $695M | |
| Common Stock | $146M | $146M | $146M | $146M | $147M | $147M | $147M | $147M | $147M | $147M | · | $146M | $146M | $146M | · | $146M | |
| Retained Earnings | $695M | $710M | $661M | $606M | $542M | $488M | $427M | $227M | $156M | $87M | · | $159M | $112M | $68M | · | $15M | |
| Treasury Stock | $793M | $793M | $793M | $815M | $815M | $815M | $815M | $827M | $827M | $827M | · | $845M | $845M | $845M | · | $867M | |
| AOCI | $-27M | $-23M | $-21M | $-24M | $-18M | $-26M | $-27M | $-16M | $-19M | $-17M | · | $-17M | $-15M | $-18M | · | $-19M | |
| Stockholders' Equity | $2.63B | $2.65B | $2.64B | $2.56B | $2.52B | $2.45B | $2.42B | $2.31B | $2.22B | $2.15B | · | $2.17B | $2.12B | $2.06B | · | $1.95B | |
| Liabilities + Equity | $6.11B | $6.01B | $5.77B | $5.74B | $5.72B | $5.45B | $5.49B | $5.44B | $5.24B | $5.10B | · | $4.73B | $4.51B | $4.26B | · | $4.09B | |
| Shares Outstanding | 57,556,643 | 56,923,103 | 56,103,965 | 55,535,089 | · | 53,922,339 | 52,657,447 | 51,357,743 | 50,022,445 | 48,205,185 | · | 45,136,147 | 43,665,289 | 42,248,807 | · | 39,326,392 |
现金流
| 指标 | 趋势 | Q2 2026 | Q1 2026 | Q4 2025 | Q3 2025 | Q2 2025 | Q1 2025 | Q4 2024 | Q3 2024 | Q2 2024 | Q1 2024 | Q4 2023 | Q3 2023 | Q2 2023 | Q1 2023 | Q4 2022 | Q3 2022 |
|---|---|---|---|---|---|---|---|---|---|---|---|---|---|---|---|---|---|
| D&A | $37M | $36M | $31M | $30M | $29M | $27M | $26M | $25M | $24M | $25M | $33M | $30M | $29M | $28M | $30M | $30M | |
| Stock-based Comp | $11M | $11M | $10M | $10M | $12M | $11M | $16M | $19M | $10M | $11M | $10M | $8M | $9M | $7M | $8M | $7M | |
| Deferred Tax | $-3M | $5M | $16M | $26M | $670.0K | $2M | $7M | $-793.0K | $-5M | $5M | $-709.0K | $-3M | $-3M | $-3M | $5M | $-4M | |
| Amort. of Intangibles | $24M | $24M | $18M | $18M | $17M | $16M | $15M | $13M | $14M | $14M | $22M | $19M | $18M | $18M | $19M | $19M | |
| Operating Cash Flow | $58M | $-4M | $168M | $163M | $160M | $-12M | $127M | $299M | $161M | $-63M | $190M | $204M | $23M | $-9M | $89M | $123M | |
| CapEx | $16M | $15M | $32M | $13M | $9M | $13M | $19M | $12M | $9M | $9M | $10M | $13M | $10M | $8M | $11M | $6M | |
| Investing Cash Flow | $-22M | $-365M | $-67M | $-24M | $-103M | $-62M | $-212M | $-256M | $-43M | $-46M | $-49M | $-243M | $-63M | $-21M | $-15M | $1M | |
| Stock Issued | $5M | $572.0K | $4M | $0 | $5M | $0 | $4M | $0 | · | · | $3M | $0 | · | · | $3M | $0 | |
| Stock Repurchased | $15M | $35M | $60M | $25M | $15M | $25M | $15M | $0 | $10M | $0 | $3M | $0 | $2M | $6M | $2M | $4M | |
| Net Stock Activity | · | $-34M | · | · | · | $-25M | · | · | · | $0 | · | · | · | $-6M | · | · | |
| Financing Cash Flow | $-53M | $186M | $-58M | $-127M | $82M | $-111M | $-15M | $-13M | $-12M | $260M | $-74M | $67M | $-2M | $-13M | $40M | $-102M | |
| Net Change in Cash | $-18M | $-182M | $44M | $11M | $142M | $-184M | $-105M | $30M | $105M | $150M | $68M | $27M | $-42M | $-42M | $115M | $21M | |
| Free Cash Flow | · | $-19M | · | · | · | $-25M | · | · | · | $-73M | · | · | · | $-17M | · | · | |
| Levered FCF | · | $-31M | · | · | · | $-35M | · | · | · | $-82M | · | · | · | $-22M | · | · |
盈利能力
| 指标 | 趋势 | Q2 2026 | Q1 2026 | Q4 2025 | Q3 2025 | Q2 2025 | Q1 2025 | Q4 2024 | Q3 2024 | Q2 2024 | Q1 2024 | Q4 2023 | Q3 2023 | Q2 2023 | Q1 2023 | Q4 2022 | Q3 2022 |
|---|---|---|---|---|---|---|---|---|---|---|---|---|---|---|---|---|---|
| Operating Margin | 0.08% | 6.4% | · | 6.7% | 6.0% | 7.0% | · | 6.3% | 6.7% | 6.6% | · | 5.9% | 5.6% | 4.4% | · | 5.6% | |
| Net Margin | -0.97% | 3.5% | · | 4.0% | 3.5% | 4.3% | · | 4.0% | 4.1% | -7.0% | · | 3.3% | 3.2% | 2.2% | · | 2.6% | |
| Pretax Margin | 0.24% | 5.5% | · | 6.0% | 5.6% | 6.5% | · | 6.0% | 6.2% | -8.1% | · | 5.3% | 5.2% | 4.0% | · | 5.1% | |
| EBITDA Margin | 0.08% | 6.4% | · | 6.7% | 6.0% | 7.0% | · | 6.3% | 6.7% | 6.6% | · | 5.9% | 5.6% | 4.4% | · | 5.6% | |
| ROA | -0.26% | 0.92% | · | 1.1% | 1.0% | 1.3% | · | 1.4% | 1.4% | -2.3% | · | 1.1% | 1.0% | 0.63% | · | 0.75% | |
| ROE | -0.59% | 2.1% | · | 2.6% | 2.3% | 2.9% | · | 3.2% | 3.2% | -5.1% | · | 2.3% | 2.1% | 1.3% | · | 1.6% | |
| ROIC | 0.00% | 1.8% | · | 2.4% | 1.9% | 2.2% | · | 2.6% | 2.5% | 2.2% | · | 2.2% | 2.1% | 1.4% | · | 1.8% |
流动性与偿付能力
| 指标 | 趋势 | Q2 2026 | Q1 2026 | Q4 2025 | Q3 2025 | Q2 2025 | Q1 2025 | Q4 2024 | Q3 2024 | Q2 2024 | Q1 2024 | Q4 2023 | Q3 2023 | Q2 2023 | Q1 2023 | Q4 2022 | Q3 2022 |
|---|---|---|---|---|---|---|---|---|---|---|---|---|---|---|---|---|---|
| Current Ratio | 1.7 | 1.8 | · | 1.7 | 1.6 | 1.3 | · | 1.5 | 1.8 | 1.8 | · | 1.4 | 1.5 | 1.6 | · | 1.4 | |
| Quick Ratio | 0.9 | 0.9 | · | 1.0 | 1.0 | 0.7 | · | 1.0 | 1.1 | 1.1 | · | 0.8 | 0.9 | 0.9 | · | 0.7 | |
| Debt / Equity | 0.6 | 0.6 | · | 0.5 | 0.6 | 0.7 | · | 0.5 | 0.6 | 0.6 | · | 0.4 | 0.4 | 0.4 | · | 0.4 | |
| LT Debt / Equity | 0.6 | 0.6 | · | 0.5 | 0.5 | 0.3 | · | 0.5 | 0.6 | 0.6 | · | 0.4 | 0.4 | 0.4 | · | 0.4 | |
| Interest Coverage | 0.1 | 6.0 | · | 8.0 | 7.6 | 8.9 | · | 8.8 | 8.6 | 7.8 | · | 9.7 | 10.5 | 7.9 | · | 10.1 |
效率
| 指标 | 趋势 | Q2 2026 | Q1 2026 | Q4 2025 | Q3 2025 | Q2 2025 | Q1 2025 | Q4 2024 | Q3 2024 | Q2 2024 | Q1 2024 | Q4 2023 | Q3 2023 | Q2 2023 | Q1 2023 | Q4 2022 | Q3 2022 |
|---|---|---|---|---|---|---|---|---|---|---|---|---|---|---|---|---|---|
| Asset Turnover | 0.3 | 0.3 | · | 0.3 | 0.3 | 0.3 | · | 0.4 | 0.3 | 0.3 | · | 0.3 | 0.3 | 0.3 | · | 0.3 | |
| Receivables Turnover | 1.4 | 1.3 | · | 1.4 | 1.4 | 1.4 | · | 1.9 | 1.7 | 1.7 | · | 1.8 | 1.6 | 1.7 | · | 1.7 |
每股
| 指标 | 趋势 | Q2 2026 | Q1 2026 | Q4 2025 | Q3 2025 | Q2 2025 | Q1 2025 | Q4 2024 | Q3 2024 | Q2 2024 | Q1 2024 | Q4 2023 | Q3 2023 | Q2 2023 | Q1 2023 | Q4 2022 | Q3 2022 |
|---|---|---|---|---|---|---|---|---|---|---|---|---|---|---|---|---|---|
| Book Value / Share | $45.72 | $46.55 | · | $46.06 | · | $45.51 | · | $45.03 | $44.35 | $44.59 | · | $48.14 | $48.54 | $48.85 | · | $49.66 | |
| Revenue / Share | $14.63 | $13.76 | · | $14.87 | $14.39 | $13999.96 | · | $16.29 | $15.11 | $14.48 | · | $12.33 | $11.83 | $10.23 | · | $10.00 | |
| Cash Flow / Share | · | $-0.03 | · | · | · | $-106.16 | · | · | · | $-0.60 | · | · | · | $-0.08 | · | · | |
| Cash / Share | $4.62 | $4.99 | · | $7.61 | · | $5.00 | · | $10.88 | $10.56 | $8.78 | · | $4.55 | $4.09 | $5.22 | · | $3.75 | |
| EPS (TTM) | $1.45 | $2.09 | · | $2.16 | $2.22 | $2.35 | · | $2.04 | $1.81 | $1.56 | · | $1.27 | $1.12 | $0.91 | · | $0.89 |
估值 (TTM)
| 指标 | 趋势 | Q2 2026 | Q1 2026 | Q4 2025 | Q3 2025 | Q2 2025 | Q1 2025 | Q4 2024 | Q3 2024 | Q2 2024 | Q1 2024 | Q4 2023 | Q3 2023 | Q2 2023 | Q1 2023 | Q4 2022 | Q3 2022 |
|---|---|---|---|---|---|---|---|---|---|---|---|---|---|---|---|---|---|
| Revenue TTM | $6.29B | $6.30B | · | $6.49B | $6.68B | $6.77B | · | $6.51B | $6.12B | $5.80B | · | $5.05B | $4.77B | $4.42B | · | $4.04B | |
| Net Income TTM | $157M | $228M | · | $240M | $248M | $262M | · | $226M | $201M | $175M | · | $144M | $126M | $102M | · | $98M | |
| Market Cap | $3.02B | $3.08B | · | $4.60B | · | $3.19B | · | $5.32B | $4.09B | $4.00B | · | $2.45B | $2.10B | $1.89B | · | $1.54B | |
| Enterprise Value | $4.22B | $4.31B | · | $5.42B | · | $4.58B | · | $6.01B | $4.81B | $4.82B | · | $3.07B | $2.67B | $2.41B | · | $2.09B | |
| P/E | 36.1 | 25.9 | · | 38.4 | 32.3 | 25.2 | · | 50.8 | 45.2 | 53.2 | · | 42.8 | 43.0 | 49.2 | · | 44.0 | |
| P/S | 0.5 | 0.5 | · | 0.7 | · | 0.5 | · | 0.8 | 0.7 | 0.7 | · | 0.5 | 0.4 | 0.4 | · | 0.4 | |
| P/B | 1.1 | 1.2 | · | 1.8 | · | 1.3 | · | 2.3 | 1.8 | 1.9 | · | 1.1 | 1.0 | 0.9 | · | 0.8 | |
| P / Tangible Book | · | · | · | 83.8 | · | 451.8 | · | 72.6 | 22.8 | 41.5 | · | 26.3 | 11.3 | 11.4 | · | 83.3 | |
| P / Cash Flow | · | -833.4 | · | · | · | -270.9 | · | · | · | -63.0 | · | · | · | -210.3 | · | · | |
| EV / Revenue | 0.7 | 0.7 | · | 0.8 | · | 0.7 | · | 0.9 | 0.8 | 0.8 | · | 0.6 | 0.6 | 0.5 | · | 0.5 | |
| Earnings Yield | 2.8% | 3.9% | · | 2.6% | 3.1% | 4.0% | · | 2.0% | 2.2% | 1.9% | · | 2.3% | 2.3% | 2.0% | · | 2.3% |
最近期在左侧 · 空值显示为 ·
财务报表 损益表、资产负债表、现金流量表 — 年度,近5年
| 指标 | 2025-12-31 | 2024-12-31 | 2023-12-31 | 2022-12-31 | 2021-12-31 |
|---|---|---|---|---|---|
| 收入 | $6.36B | $6.75B | $5.44B | $4.20B | $3.66B |
| 营业利润率 % | 6.6% | 6.3% | 5.3% | 4.4% | 3.6% |
| 净收入 | $241M | $235M | $161M | $97M | $64M |
| 稀释后每股收益 (EPS) | $2.20 | $2.12 | $1.42 | $0.87 | $0.59 |
| 指标 | 2025-12-31 | 2024-12-31 | 2023-12-31 | 2022-12-31 | 2021-12-31 |
|---|---|---|---|---|---|
| 负债/股东权益比率 | 0.5 | 0.7 | 0.3 | 0.4 | 0.3 |
| 流动比率 | 1.8 | 1.3 | 1.5 | 1.6 | 1.6 |
| 速动比率 | 1.0 | 0.8 | 0.8 | 0.9 | 0.9 |
| 指标 | 2025-12-31 | 2024-12-31 | 2023-12-31 | 2022-12-31 | 2021-12-31 |
|---|---|---|---|---|---|
| 自由现金流 | $410M | $474M | $367M | $207M | $184M |
机构持有人 (13F) 374 家申报者 · $6.1B 总计 · 截至 2026年9月30日
在其季度SEC表格13F中报告持有此股票的机构。仅限多头头寸;单个申报人可能因单独的期权腿而出现两次。 大的抵消性看跌/看涨腿通常反映做市或对冲库存,而非方向性判断。
| 新仓位 | 已退出持仓 | 增加 | 减少 | 净股数变动 |
|---|---|---|---|---|
| 62 (+3 与上一季度对比) | 56 (-10 与上一季度对比) | 124 (+11 与上一季度对比) | 115 (-18 与上一季度对比) | +6.0M |
与Q1 2026对比。 SEC 13F表格的提交截止日期是季度末后45天,外加少量延迟提交的缓冲期——在此窗口期内的季度将被跳过,优先显示最近一个已完整报告的季度对。
| 机构 | 价值 | 股份 | % 已追踪的13F | 类型 |
|---|---|---|---|---|
| Newport Trust Company, LLC | $2586527005 | 49370624 | 42.46% | 股份 |
| VANGUARD GROUP INC | $307663081 | 4978367 | 5.05% | 股份 |
| BlackRock, Inc. | $281326005 | 5369842 | 4.62% | 股份 |
| WELLINGTON MANAGEMENT GROUP LLP | $241009455 | 4600295 | 3.96% | 股份 |
| Swedbank AB | $192274863 | 3670068 | 3.16% | 股份 |
| MORGAN STANLEY | $137768562 | 2629671 | 2.26% | 股份 |
| VANGUARD CAPITAL MANAGEMENT LLC | $125912816 | 2403375 | 2.07% | 股份 |
| DIMENSIONAL FUND ADVISORS LP | $124552563 | 2377589 | 2.04% | 股份 |
| EARNEST PARTNERS LLC | $120208907 | 2294501 | 1.97% | 股份 |
| VANGUARD PORTFOLIO MANAGEMENT LLC | $117390011 | 2240695 | 1.93% | 股份 |
| Channing Capital Management, LLC | $106476179 | 2032376 | 1.75% | 股份 |
| STATE STREET CORP | $104403211 | 1992808 | 1.71% | 股份 |
| PRIMECAP MANAGEMENT CO/CA/ | $89696919 | 1712100 | 1.47% | 股份 |
| UBS Group AG | $89068239 | 1700100 | 1.46% | 买入期权 |
| Invesco Ltd. | $82833410 | 1581092 | 1.36% | 股份 |
| FMR LLC | $73882618 | 1410243 | 1.21% | 股份 |
| MIRAE ASSET GLOBAL ETFS HOLDINGS Ltd. | $64415181 | 1229532 | 1.06% | 股份 |
| UBS Group AG | $60805355 | 1160629 | 1.00% | 股份 |
| VAN ECK ASSOCIATES CORP | $58978933 | 1125767 | 0.97% | 股份 |
| AQR CAPITAL MANAGEMENT LLC | $55643127 | 1089760 | 0.91% | 股份 |
| GOLDMAN SACHS GROUP INC | $53649717 | 1024045 | 0.88% | 股份 |
| AMERIPRISE FINANCIAL INC | $51530360 | 983592 | 0.85% | 股份 |
| GEODE CAPITAL MANAGEMENT, LLC | $49291995 | 940617 | 0.81% | 股份 |
| BANK OF AMERICA CORP /DE/ | $45234348 | 863416 | 0.74% | 股份 |
| Clearline Capital LP | $36216893 | 691294 | 0.59% | 股份 |
| BROWN ADVISORY INC | $34142292 | 651695 | 0.56% | 股份 |
| Point72 Asset Management, L.P. | $31303758 | 597514 | 0.51% | 股份 |
| Nuveen, LLC | $30999321 | 591703 | 0.51% | 股份 |
| NEEDHAM INVESTMENT MANAGEMENT LLC | $29076450 | 555000 | 0.48% | 股份 |
| CHARLES SCHWAB INVESTMENT MANAGEMENT INC | $28372905 | 541571 | 0.47% | 股份 |
| DISCOVERY CAPITAL MANAGEMENT, LLC / CT | $27693354 | 528600 | 0.45% | 股份 |
| FIRST TRUST ADVISORS LP | $26568576 | 507134 | 0.44% | 股份 |
| NEW YORK STATE COMMON RETIREMENT FUND | $24692926 | 471329 | 0.41% | 股份 |
| ROYAL BANK OF CANADA | $24141000 | 460800 | 0.40% | 股份 |
| KETTLE HILL CAPITAL MANAGEMENT, LLC | $22305095 | 425751 | 0.37% | 股份 |
| NORTHERN TRUST CORP | $19162742 | 365771 | 0.31% | 股份 |
| BANK OF NOVA SCOTIA | $18521719 | 353535 | 0.30% | 股份 |
| VANGUARD FIDUCIARY TRUST CO | $17592824 | 335805 | 0.29% | 股份 |
| ROYCE & ASSOCIATES LP | $17580512 | 335570 | 0.29% | 股份 |
| Goodman Financial Corp | $17081631 | 326050 | 0.28% | 股份 |
| TimesSquare Capital Management, LLC | $16307553 | 301044 | 0.27% | 股份 |
| JPMORGAN CHASE & CO | $16005477 | 309236 | 0.26% | 股份 |
| SILVERCREST ASSET MANAGEMENT GROUP LLC | $15177383 | 289700 | 0.25% | 股份 |
| Bank of New York Mellon Corp | $14929220 | 284963 | 0.25% | 股份 |
| Rokos Capital Management LLP | $13795230 | 263318 | 0.23% | 股份 |
| Vident Advisory, LLC | $11124953 | 212349 | 0.18% | 股份 |
| NORGES BANK | $10127459 | 193309 | 0.17% | 股份 |
| ArrowMark Colorado Holdings LLC | $9901710 | 189000 | 0.16% | 股份 |
| RAYMOND JAMES FINANCIAL INC | $9404162 | 179503 | 0.15% | 股份 |
| First Eagle Investment Management, LLC | $9391274 | 179257 | 0.15% | 股份 |
公司内部人士 23 位内幕人士 · 9 位高管 · 15 位董事
| 内部人士 | 角色 | 上次活动 | 持股数量 | 买入 12个月 | 卖出 12个月 | 净额 12个月 |
|---|---|---|---|---|---|---|
| Carey A. Smith | President & CEO | 2026年5月8日 P | 575376 | 2 | 0 | $624645 |
| Matthew Ofilos | Chief Financial Officer | 2026年3月9日 F | 75579 | 0 | 0 | $0 |
| Soo Lagasse | Chief Human Resources Officer | 2026年4月1日 A | 12496 | 0 | 0 | $0 |
| Susan M. Balaguer | Chief Human Resources Officer | 2026年3月9日 F | 37207 | 0 | 0 | $0 |
| John Thomas Martinez | Chief Legal Officer | 2026年3月1日 A | 55008 | 0 | 0 | $0 |
| Michael Richard Kolloway | Chief Legal Officer and Secretary | 2025年3月9日 F | 87920 | 0 | 0 | $0 |
| Charles L. Harrington | Chairman | 2022年3月4日 M | 166885 | 0 | 0 | $0 |
| Debra Fiori | Chief People Officer | 2021年3月4日 M | 9683 | 0 | 0 | $0 |
| Adam Worthington Taylor | Chief Transformation and Administrative Officer | 2019年5月14日 M | 0 | 0 | 0 | $0 |
| David C Wajsgras | 董事 | 2026年10月1日 A | 41372 | 0 | 0 | $0 |
| LEER STEVEN F | 董事 | 2026年10月1日 A | 35192 | 0 | 0 | $0 |
| Holdsworth Mark Keith | 董事 | 2026年5月12日 P | 39918 | 2 | 0 | $512673 |
| Harry T. Mcmahon | 董事 | 2026年5月11日 P | 61582 | 1 | 0 | $491400 |
| Robert Hanson Smith | 董事 | 2026年4月14日 A | 3673 | 0 | 0 | $0 |
| Ellen M. Lord | 董事 | 2026年4月14日 A | 14597 | 0 | 0 | $0 |
| Darren W Mcdew | 董事 | 2026年4月14日 A | 25175 | 0 | 0 | $0 |
| Letitia A Long | 董事 | 2026年4月14日 A | 25175 | 0 | 0 | $0 |
| Suzanne M Vautrinot | 董事 | 2026年4月14日 A | 29918 | 0 | 0 | $0 |
| Christian M Mitchell | 董事 | 2026年4月14日 A | 29918 | 0 | 0 | $0 |
| James F Mcgovern | 董事 | 2022年4月14日 A | 20802 | 0 | 0 | $0 |
| Tamara L. Lundgren | 董事 | 2020年4月21日 A | 250 | 0 | 0 | $0 |
| Kenneth C Dahlberg | 董事 | 2020年4月21日 A | 250 | 0 | 0 | $0 |
| George L. Ball | · | 2026年8月7日 P | 170383 | 2 | 0 | $1459400 |
来自SEC表格3/4/5申报的内部人士;净额=仅公开市场买卖
ETF持仓 由 76 只交易所交易基金持有
权重仅反映直接股权持仓(N-PORT);杠杆基金或基于衍生品的基金可能持有未显示的额外掉期敞口。
| 基金 | 权重 | 单位 | 截至 | 来源 |
|---|---|---|---|---|
| EWUS · iShares Trust | 1.04% | 29171 SH | 2026年9月11日 | 每日 |
| IDV · iShares Trust | 0.52% | 3021320 SH | 2026年9月11日 | 每日 |
| IEUS · iShares Trust | 0.30% | 35475 SH | 2026年9月11日 | 每日 |
| FXL · First Trust Exchange-Traded Alpha... | 0.28% | 162326 NS | 2026年7月31日 | N-PORT |
| RWK · Invesco Exchange-Traded Fund Trus... | 0.23% | 71139 SH | 2026年10月2日 | 每日 |
| PRFZ · Invesco Exchange-Traded Fund Trust | 0.14% | 91785 SH | 2026年10月2日 | 每日 |
| SCZ · iShares Trust | 0.13% | 1128349 SH | 2026年9月11日 | 每日 |
| FNX · First Trust Exchange-Traded Alpha... | 0.13% | 39321 NS | 2026年7月31日 | N-PORT |
| PPA · Invesco Exchange-Traded Fund Trust | 0.13% | 226902 SH | 2026年10月2日 | 每日 |
| JVAL · J.P. Morgan Exchange-Traded Fund ... | 0.12% | 23420 NS | 2026年7月31日 | N-PORT |
| FNK · First Trust Exchange-Traded Alpha... | 0.12% | 6185 NS | 2026年7月31日 | N-PORT |
| DFAS · Dimensional ETF Trust | 0.10% | 354547 NS | 2026年7月31日 | N-PORT |
| IVOG · VANGUARD ADMIRAL FUNDS | 0.10% | 35362 SH | 2026年8月19日 | 每日 |
| IVOO · VANGUARD ADMIRAL FUNDS | 0.08% | 86298 SH | 2026年8月19日 | 每日 |
| RXI · iShares Trust | 0.08% | 12988 SH | 2026年9月11日 | 每日 |
| QVMM · Invesco Exchange-Traded Fund Trus... | 0.07% | 7419 SH | 2026年10月2日 | 每日 |
| PTMC · Pacer Funds Trust | 0.07% | 5938 NS | 2026年7月31日 | N-PORT |
| JMOM · J.P. Morgan Exchange-Traded Fund ... | 0.07% | 37701 NS | 2026年7月31日 | N-PORT |
| WSML · iShares Trust | 0.06% | 22077 SH | 2026年9月11日 | 每日 |
| FSMD · FIDELITY COVINGTON TRUST | 0.06% | 35522 NS | 2026年7月31日 | N-PORT |
| VBR · VANGUARD INDEX FUNDS | 0.06% | 779352 SH | 2026年8月19日 | 每日 |
| PXF · Invesco Exchange-Traded Fund Trus... | 0.06% | 100465 SH | 2026年10月2日 | 每日 |
| EQAL · Invesco Exchange-Traded Fund Trus... | 0.06% | 11022 SH | 2026年10月2日 | 每日 |
| BBMC · J.P. Morgan Exchange-Traded Fund ... | 0.05% | 24867 NS | 2026年7月31日 | N-PORT |
| ESML · iShares Trust | 0.05% | 31077 SH | 2026年9月11日 | 每日 |
| MIDU · Direxion Shares ETF Trust | 0.05% | 785 NS | 2026年7月31日 | N-PORT |
| IVOV · VANGUARD ADMIRAL FUNDS | 0.05% | 15165 SH | 2026年8月19日 | 每日 |
| DFSV · Dimensional ETF Trust | 0.05% | 88818 NS | 2026年7月31日 | N-PORT |
| BKMC · BNY Mellon ETF Trust | 0.04% | 6363 NS | 2026年7月31日 | N-PORT |
| VIS · VANGUARD WORLD FUND | 0.04% | 65070 SH | 2026年8月19日 | 每日 |
| DFAT · Dimensional ETF Trust | 0.04% | 124185 NS | 2026年7月31日 | N-PORT |
| IEV · iShares Trust | 0.04% | 39731 SH | 2026年9月11日 | 每日 |
| FAB · First Trust Exchange-Traded Alpha... | 0.04% | 1368 NS | 2026年7月31日 | N-PORT |
| FIDU · FIDELITY COVINGTON TRUST | 0.03% | 17556 NS | 2026年7月31日 | N-PORT |
| ISCG · iShares Trust | 0.03% | 6595 SH | 2026年9月11日 | 每日 |
| IEUR · iShares Trust | 0.03% | 188748 SH | 2026年9月11日 | 每日 |
| DFSU · Dimensional ETF Trust | 0.03% | 15743 NS | 2026年7月31日 | N-PORT |
| VXF · VANGUARD INDEX FUNDS | 0.03% | 613979 SH | 2026年8月19日 | 每日 |
| VB · VANGUARD INDEX FUNDS | 0.03% | 1227802 SH | 2026年8月19日 | 每日 |
| VGK · VANGUARD INTERNATIONAL EQUITY IND... | 0.03% | 755520 SH | 2026年8月19日 | 每日 |
| DFUV · Dimensional ETF Trust | 0.02% | 85317 NS | 2026年7月31日 | N-PORT |
| SMMD · iShares Trust | 0.02% | 19586 SH | 2026年9月11日 | 每日 |
| DXUV · Dimensional ETF Trust | 0.02% | 2744 NS | 2026年7月31日 | N-PORT |
| VYMI · VANGUARD WHITEHALL FUNDS | 0.02% | 307561 SH | 2026年8月19日 | 每日 |
| DFAC · Dimensional ETF Trust | 0.02% | 199345 NS | 2026年7月31日 | N-PORT |
| IEFA · iShares Trust | 0.02% | 2348870 SH | 2026年9月11日 | 每日 |
| IWS · iShares Trust | 0.02% | 54964 SH | 2026年9月10日 | 每日 |
| IDEV · iShares Trust | 0.02% | 348721 SH | 2026年9月11日 | 每日 |
| IWR · iShares Trust | 0.01% | 150363 SH | 2026年9月11日 | 每日 |
| DCOR · Dimensional ETF Trust | 0.01% | 9037 NS | 2026年7月31日 | N-PORT |
| IXUS · iShares Trust | 0.01% | 419358 SH | 2026年9月11日 | 每日 |
| VXUS · VANGUARD STAR FUNDS | 0.01% | 4693190 SH | 2026年8月19日 | 每日 |
| VEU · VANGUARD INTERNATIONAL EQUITY IND... | 0.01% | 735963 SH | 2026年8月19日 | 每日 |
| VEA · VANGUARD TAX-MANAGED FUNDS | 0.01% | 3059076 SH | 2026年8月19日 | 每日 |
| VONV · VANGUARD SCOTTSDALE FUNDS | 0.01% | 22350 SH | 2026年8月19日 | 每日 |
| VSGX · VANGUARD WORLD FUND | 0.01% | 64249 SH | 2026年8月19日 | 每日 |
| DFAU · Dimensional ETF Trust | 0.01% | 24278 NS | 2026年7月31日 | N-PORT |
| IYW · iShares Trust | 0.01% | 45812 SH | 2026年9月11日 | 每日 |
| TILT · FlexShares Trust | 0.01% | 3058 NS | 2026年7月31日 | N-PORT |
| IWD · iShares Trust | 0.00% | 82123 SH | 2026年9月11日 | 每日 |
| IUSG · iShares Trust | 0.00% | 31853 SH | 2026年9月11日 | 每日 |
| ITOT · iShares Trust | 0.00% | 75041 SH | 2026年9月11日 | 每日 |
| IYY · iShares Trust | 0.00% | 2304 SH | 2026年9月10日 | 每日 |
| DFUS · Dimensional ETF Trust | 0.00% | 13260 NS | 2026年7月31日 | N-PORT |
| IUSV · iShares Trust | 0.00% | 15050 SH | 2026年9月11日 | 每日 |
| IWB · iShares Trust | 0.00% | 25538 SH | 2026年9月11日 | 每日 |
| IWV · iShares Trust | 0.00% | 10169 SH | 2026年9月10日 | 每日 |
| VTI · VANGUARD INDEX FUNDS | 0.00% | 1694908 SH | 2026年8月19日 | 每日 |
| VT · VANGUARD INTERNATIONAL EQUITY IND... | 0.00% | 282607 SH | 2026年8月19日 | 每日 |
| VONE · VANGUARD SCOTTSDALE FUNDS | 0.00% | 6152 SH | 2026年8月19日 | 每日 |
| VTHR · VANGUARD SCOTTSDALE FUNDS | 0.00% | 3144 SH | 2026年8月19日 | 每日 |
| IJH · iShares Trust | · | 1876276 SH | 2026年9月11日 | 每日 |
| IJK · iShares Trust | · | 208285 SH | 2026年9月11日 | 每日 |
| IJJ · iShares Trust | · | 89507 SH | 2026年8月21日 | 每日 |
| ISCB · iShares Trust | · | 2573 SH | 2026年9月11日 | 每日 |
| ISCV · iShares Trust | · | 8046 SH | 2026年9月11日 | 每日 |
PSN 分析师共识 看涨和看跌分析师观点、12个月价格目标、上涨空间
12个月价格目标
11 位分析师 · 2026-10-02平均目标 $59.64 +46.2%
同行比较(GICS 子行业) 关键指标与行业同行对比
财年依据,价格截至各公司上一个财年末收盘价。
| 股票代码 | 市值 | P/E | 营收同比增长 | 净利润率 | ROE | 毛利率 |
|---|---|---|---|---|---|---|
| PSN | $3.47B | 28.1 | -5.7% | 3.8% | 9.5% | · |
| PL | · | -31.2 | 25.9% | · | · | · |
| SAIC | $4.48B | 13.2 | -2.9% | 4.9% | 23.3% | · |
| MBGL | · | · | · | · | · | · |
| AMTM | $6.32B | 96.1 | 71.6% | 0.46% | 1.5% | · |
| AMTM | $6.32B | 96.1 | 71.6% | 0.46% | 1.5% | · |
| KBR | $5.12B | 12.6 | 0.99% | 5.3% | 28.1% | 14.8% |
| FCN | $5.27B | 20.7 | 2.4% | 7.1% | 14.9% | 32.1% |
| EXPO | · | 33.9 | 4.2% | 18.2% | 25.9% | · |
| CBZ | $2.74B | 27.6 | 52.1% | 4.2% | · | 12.9% |
| HURN | · | 29.6 | 11.7% | 6.2% | 20.9% | · |
最新新闻 提及该公司的近期头条新闻
我的指标 您的个人关注列表 — 来自完整基本面的选定行
选择对您重要的指标 — 点击上方完整基本面中任意行的 + 号。
您的选择已保存,并会跟随您浏览所有股票。