
YELP Yelp Inc. Common Stock
NYSE · Media · View on SEC EDGAR ↗ close Oct 2, 2026 10-K/10-Q Aug 7, 2026YELP Stock Snapshot Price, market cap, P/E, EPS, ROE, debt/equity, 52-week range
YELP Stock Price Chart Daily OHLCV with technical indicators — pan, zoom, and customize your view
Bar granularity adapts to the selected period — hover the chart to see open/high/low/close for a bar.
About Yelp Inc. Common Stock Company overview from Wikipedia
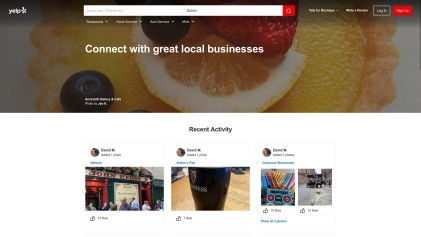
Yelp Inc. is an American company that develops the Yelp.com website and the Yelp mobile app, which publishes crowd-sourced reviews about businesses. It also operates Yelp Guest Manager, a table reservation service. It is headquartered in San Francisco.
Yelp was founded in 2004 by former PayPal employees Russel Simmons and Jeremy Stoppelman. It has since become one of the leading sources of user-generated reviews and ratings for businesses.
Yelp grew in usage and raised several rounds of funding in the following years. By 2010, it had $30 million in revenue, and the website had published about 4.5 million crowd-sourced reviews. From 2009 to 2012, Yelp expanded throughout Europe and Asia. In 2009, it entered unsuccessful negotiations to be acquired by Google. Yelp became a public company via an initial public offering in March 2012 and became profitable for the first time two years later.
As of December 31, 2024, approximately 308 million reviews had been contributed to Yelp. In 2024, the company had over 76 million unique visitors on desktop and mobile. Yelp estimates that over 50% of its audience has an annual household income of more than $100,000.
The company has been accused of using unfair practices to raise revenue from the businesses that are reviewed on its site – e.g., by presenting more negative review information for companies that do not purchase its advertising services or by prominently featuring advertisements of the competitors of such non-paying companies or conversely by excluding negative reviews from companies' overall rating on the basis that the reviews "are not currently recommended". There have also been complaints of aggressive and misleading tactics by some of its advertising sales representatives. The company's review system's reliability has also been affected by the submission of fake reviews by external users, such as false positive reviews submitted by a company to promote its own business or false negative reviews submitted about competing businesses – a practice sometimes known as "astroturfing" – which the company has tried to combat in various ways.
Company history
Origins (2004–2009)
Two former PayPal employees, Jeremy Stoppelman and Russel Simmons, founded Yelp at a business incubator, MRL Ventures, in 2004. Stoppelman and Simmons conceived the initial idea for Yelp as an email-based referral network, after Stoppelman caught the flu and had a difficult time finding an online recommendation for a local doctor. Max Levchin, the co-founders' former colleague as founding chief technology officer of PayPal and founder of MRL Ventures, provided $1 million in Angel financing. MRL co-founder David Galbraith, who instigated the local services project based on user reviews, came up with the name "Yelp". Stoppelman explained that they decided on "Yelp" for the company's name because "it was short, memorable, easy to spell, and was familiar with 'the help' and 'yellow pages'".
According to Fortune, Yelp's initial email-based system was "convoluted". The idea was rejected by investors and did not attract users beyond the cofounders' friends and family. Usage data showed that users were not answering requests for referrals, but were using the "Real Reviews" feature, which allowed them to write reviews unsolicited. According to The San Francisco Chronicle, "the site's popularity soared" after it was re-designed in late 2005 with the distinctive Burst logo. Yelp raised $5 million in funding in 2005 from Bessemer Venture Partners and $10 million in November 2006 from Benchmark Capital. The number of reviewers on the site grew from 12,000 in 2005, to 100,000 in 2006. By the summer of 2006, the site had one million monthly visitors. It raised $15 million in funding from DAG Ventures in February 2008. In 2010, Elevation Partners invested $100 million. $75 million was spent on purchasing equity from employees and investors, while $25 million was invested in sales staff and expansion. Yelp grew from 6 million monthly visitors in 2007 to 16.5 million in 2008 and from 12 to 24 cities during the same time period. By 2009, the site had 4.5 million reviews. By 2010, Yelp's revenues were estimated to be $30 million and it employed 300 people.
Private company (2009–2012)
Yelp introduced a site for the United Kingdom in January 2009 and one for Canada that August. The first non-English Yelp site was introduced in France in 2010; users had the option to read and write content in French or English. From 2010 to 2011, Yelp launched several more sites, in Austria, Germany, Spain, and the Netherlands. International website traffic doubled during the same time period. An Australian website went live in November 2011. It was supported through a partnership with Telstra, which provided one million initial business listings, and was initially glitchy. By the end of 2012, Yelp was publishing reviews for establishments in 20 countries, including Turkey and Denmark. Yelp's first site in Asia was introduced in September 2012 in Singapore, which was followed by Japan in 2014.
In December 2009, Google entered into negotiations with Yelp to acquire the company, but the two parties failed to reach an agreement. According to The New York Times, Google offered about $500 million, but the deal fell through after Yahoo offered $1 billion. TechCrunch reported that Google refused to match Yahoo's offer. Both offers were later abandoned following a disagreement between Yelp's management and board of directors about the offers. In June 2015, Yelp published a study alleging Google was altering search results to benefit its own online services.
Yelp began a service called Yelp Deals in April 2011, but by August it cut back on Deals due to increased competition and market saturation. That September, the Federal Trade Commission investigated Yelp's allegations that Google was using Yelp web content without authorization and that Google's search algorithms favored Google Places over similar services provided by Yelp. In order to avoid an FTC anti-trust lawsuit, in January 2014, Google agreed to allow services like Yelp the ability to opt out of having their data scraped and used on Google's websites.
Public entity (2012–present)
Having filed for an initial public offering (IPO) with the Securities Exchange Commission in November 2011, Yelp's stock began public trading on the New York Stock Exchange on March 2, 2012. In 2012, Yelp acquired its largest European rival, Qype, for $50 million. The following year, CEO Jeremy Stoppelman reduced his salary to $1. Yelp acquired start-up online reservation company SeatMe for $12.7 million in cash and stock in 2013. Yelp's second quarter 2013 revenue of $55 million "exceeded expectations", but the company was not yet profitable.
In 2012/13, Yelp moved into its new corporate headquarters, occupying about 150,000 square feet on 12 floors of 140 New Montgomery (the former PacBell building) in San Francisco. The company was profitable for the first time in the second quarter of 2014, as a result of increasing ad spending by business owners and possibly from changes in Google's local search algorithm. The algorithm dubbed Google Pigeon made authoritative local directory sites like Yelp and TripAdvisor more visible. Over the course of the year, Yelp websites were launched in Mexico, Japan, and Argentina. Also in 2014, Yelp expanded in Europe through the acquisitions of German-based restaurant review site Restaurant-Kritik and French-based CityVox.
In early February 2015, Yelp announced it bought Eat24, an online food-ordering service, for $134 million. Then in August 2017, Yelp sold Eat24 to Grubhub for $287.5 million. The acquisition resulted in a partnership to integrate Grubhub delivery into the Yelp profiles of restaurants.
In late 2015, a "Public Services & Government" section was introduced to Yelp, and the General Services Administration began encouraging government agencies to create and monitor official government pages. For example, the Transportation Security Administration created official TSA Yelp pages. Later that year Yelp began experimenting in San Francisco with consumer alerts that were added to pages about restaurants with poor hygiene scores in government inspections. Research conducted by the Boston Children's Hospital found that Yelp reviews with keywords associated with food poisoning correlates strongly with poor hygiene at the restaurant. Researchers at Columbia University used data from Yelp to identify three previously unreported restaurant-related food poisoning outbreaks.
On November 2, 2016, concurrent with its earnings report for Q3 2016, Yelp announced it would drastically scale back its operations outside North America and halt international expansion. This resulted in the termination of essentially all international employees across Yelp's 30+ international markets from the sales, marketing, public relations, business outreach, and government relations departments. Overseas employees now primarily consist of engineering and product management staff. These layoffs affected only 175 individuals or 4% of its total workforce.
In March 2017, Yelp acquired the restaurant reservation app Nowait for $40 million. In April 2017, Yelp acquired Wi-Fi marketing company Turnstyle Analytics for $20 million.
In early 2020, Yelp listed space at 55 Hawthorne Street, San Francisco, for 235 employees as available for sublease. Business closures and stay-at-home orders during the COVID-19 pandemic in the United States caused a massive decline in searches on Yelp (down 64-83% from March to April, depending on category) and company revenues. On April 9, the company announced it would lay off 1,000 employees, furlough about 1,100 with benefits, reduce hours for others, cut executive pay by 20–30%, and stop paying the CEO for the rest of 2020.
In September 2021, Yelp announced that it was relocating its corporate headquarters to a smaller space at 350 Mission Street to be subleased from Salesforce. On June 1, 2023, Yelp decided to close its offices in Phoenix, Arizona and Hamburg, Germany. According to an announcement made by the company, less than 6 percent of the available workstations in these offices were being utilized. This move comes after Yelp had already shut down its New York, Chicago, and Washington, D.C. offices. As of mid-2023, Yelp maintains a single remaining office in the United States in San Francisco. Additionally, the company will continue its operations in Toronto, Canada, and London, United Kingdom. The closure and downsizing of these offices are expected to result in approximately $27 million in annual cost savings for Yelp during the 2023–24 fiscal year. As of February 2024, its website listed reviews for establishments in 32 countries.
In November 2024, Yelp Inc. acquired RepairPal, an auto services platform, for $80 million. In January 2026, Yelp Inc. acquired Hatch, an AI-powered lead management and communication platform, for $270 million in cash with an additional $30 million of employee retention.
Features
Yelp's website, Yelp.com, is a crowd-sourced local business review and social networking site. The site has pages devoted to individual locations, such as restaurants or schools, where Yelp users can submit a review of their products or services using a one to five stars rating scale. Businesses can update contact information, hours, and other basic listing information or add special deals. In addition to writing reviews, users can react to reviews, plan events, or discuss their personal lives.
80% of businesses listed on the site had a rating of three stars or better, but some negative reviews were very personal or extreme. Some of the reviews are written entertainingly or creatively. As of 2014, users could give a "thumbs-up" to reviews they liked, which caused these reviews to be featured more prominently in the system. As of 2008, each day a "Review of the Day" was determined based on a vote by users.
The Yelp iPhone mobile app was introduced in December 2008. In August 2009, Yelp released an update to the iPhone app with a hidden Easter Egg augmented reality feature called Monocle, which allowed users looking through their iPhone camera to see Yelp data on businesses seen through the camera. Check-in features were added in 2010.
Yelp users can make restaurant reservations in Yelp through Yelp Reservations, a feature initially added in June 2010; in 2021 the service was consolidated with others into "Yelp Guest Manager". Yelp's reservation features have been done through SeatMe, which was acquired by Yelp in 2013. Prior to that, Yelp had offered reservation services through OpenTable. In 2013, features to have food ordered and delivered were added to Yelp as well as the ability to view hygiene inspection scores and make appointments at spas. Yelp's content was integrated into Apple Inc.'s Siri "virtual assistant" and the mapping and directions app of Apple's September 2012 release of the iOS 6 computer operating system.
In March 2014, Yelp added features for ordering and scheduling manicures, flower deliveries, golf games, and legal consultations, among other things. In October 2014, the company, working in collaboration with hotel search site Hipmunk, added features to book hotels through Yelp.
Yelp started a 7–10% cash-back program at some US restaurants in 2016 through a partnership with Empyr, which links credit card purchases to online advertising.
On February 14, 2017, Yelp launched Yelp Questions and Answers, a feature for users to ask venue-specific questions about businesses.
In June 2020, Yelp launched a COVID-19 section that enables businesses to update their health and safety measures as well as their service offering changes. Starting January 2021, users can provide detailed feedback regarding what health and safety measures the business has implemented through editing in the COVID-19 section on Yelp business pages.
In April 2023, Yelp introduced Yelp Guaranteed, which provides a refund of up to $2,500 if something goes wrong with a project. It also improved its search features with AI and added the option to add video to reviews. In April 2024, Yelp released Yelp Assistant, an AI chatbot that helps users find a professional for a project. It also updated an API with natural language search to answer conversational queries.
In December 2024, Yelp introduced AI-powered "Review Insights" filters for restaurant, food, and nightlife businesses on its iOS app. The feature uses AI to surface positive, neutral, and critical sentiment from user reviews so people can quickly scan what customers are saying about categories like food, service, and atmosphere. Yelp also said it planned to expand Review Insights to service categories in 2025.
Features for businesses
Yelp added the ability for business owners to respond to reviews in 2008. Businesses can respond privately by messaging the reviewer or publicly on their profile page. In some cases, Yelp users that had a bad experience have updated their reviews more favorably due to the business's efforts to resolve their complaints. In some other cases, disputes between reviewers and business owners have led to harassment and physical altercations. The system has led to criticisms that business owners can bribe reviewers with free food or discounts to increase their rating. However, Yelp users say this rarely occurs. A business owner can "claim" a profile, which allows them to respond to reviews and see traffic reports. Businesses can also offer discounts to Yelp users that visit often using a Yelp "check in" feature. In 2014, Yelp released an app for business owners to respond to reviews and manage their profiles from a mobile device. Business owners can also flag a review to be removed, if the review violates Yelp's content guidelines.
Yelp's revenues primarily come from selling ads and sponsored listings to small businesses. Advertisers can pay to have their listing appear at the top of search results or feature ads on the pages of their competitors. In 2016, advertising revenue grew at a rate of 30% year over year. Originally a sponsored "favorite review" could place a positive review above negative ones, but Yelp stopped offering this option in 2010 in an effort to deter the valid criticism that advertisers were able to obtain a more positive review appearance in exchange for pay.
On June 5, 2020, Yelp launched a tool to allow businesses on the platform to identify themselves as black-owned, allowing customers to search for black-owned companies they want to support. There were more than 2.5 million searches for black-owned businesses on Yelp from May 25 to July 10. Searches for black-owned businesses were up 2,400% in 2020. In August 2021 Yelp added a feature to let users filter businesses based on their COVID precautions.
Relationship with businesses
A Harvard Business School study published in 2011 found that each "star" in a Yelp rating affected the business owner's sales by 5–9%. A 2012 study by two University of California, Berkeley economists found that an increase from 3.5 to 4 stars on Yelp resulted in a 19% increase in the chances of the restaurant being booked during peak hours. A 2014 survey of 300 small business owners done by Yodle found that 78% were concerned about negative reviews. Also, 43% of respondents said they felt online reviews were unfair, because there is no verification that the review is written by a legitimate customer.
Controversy and litigation
Yelp has a complicated relationship with small businesses. Criticism of Yelp continues to focus on the legitimacy of reviews, public statements of Yelp manipulating and blocking reviews in order to increase ad spending, as well as concerns regarding the privacy of reviewers.
Astroturfing
As Yelp became more influential, the phenomenon of business owners and competitors writing fake reviews, known as "astroturfing", became more prevalent. A study from Harvard Associate Professor Michael Luca and Georgios Zervas of Boston University analyzed 316,415 reviews in Boston and found that the percentage of fake reviews rose from 6% of the site's reviews in 2006 to 20% in 2014. Yelp's own review filter identifies 18% of reviews as suspicious.
Yelp has a proprietary algorithm that attempts to evaluate whether a review is authentic and filters out reviews that it believes are not based on a patron's actual personal experiences, as required by the site's Terms of Use. The review filter was first developed two weeks after the site was founded and the company saw their "first obviously fake reviews". Filtered reviews are moved into a special area and not counted towards the businesses' star-rating. The filter sometimes filters legitimate reviews, leading to complaints from business owners. New York Attorney General Eric T. Schneiderman said Yelp has "the most aggressive" astroturfing filter out of the crowd-sourced websites it looked into. Yelp has also been criticized for not disclosing how the filter works, which it says would reveal information on how to defeat it.
Yelp also conducts "sting operations" to uncover businesses writing their own reviews. In October 2012, Yelp placed a 90-day "consumer alert" on 150 business listings believed to have paid for reviews. The alert read "We caught someone red-handed trying to buy reviews for this business". In June 2013, Yelp filed a lawsuit against BuyYelpReview/AdBlaze for allegedly writing fake reviews for pay. In 2013, Yelp sued a lawyer it alleged was part of a group of law firms that exchanged Yelp reviews, saying that many of the firm's reviews originated from their own office. The lawyer said Yelp was trying to get revenge for his legal disputes and activism against Yelp. An effort to win dismissal of the case was denied in December 2014. In September 2013, Yelp cooperated with Operation Clean Turf, a sting operation by the New York Attorney General that uncovered 19 astroturfing operations. In April 2017, a Norfolk, Massachusetts, jury awarded a jewelry store over $34,000 after it determined that its competitor's employee had filed a false negative Yelp review that knowingly caused emotional distress.
In December 2019, Yelp won a court case that challenged the company's explanation of how its review recommendation software worked. The court ruling stated that "None of the evidence presented at the trial showed anything nefarious or duplicitous on the part of Yelp in connection with the assertions made in the Challenged Statements." This was one of a number of court cases that ruled in favor of Yelp over the years.
Alleged unfair business practices
Yelp has a complicated relationship with small businesses. There have been allegations that Yelp has manipulated reviews based on participation in its advertising programs. Many business owners have said that Yelp salespeople have offered to remove or suppress negative reviews if they purchase advertising. Others report seeing negative reviews featured prominently and positive reviews buried, and then soon afterwards, they would receive calls from Yelp attempting to sell paid advertising.
Yelp staff acknowledged that they had allowed their advertising partners to move their favorite review to the top of the listings as a "featured review", but said the reviews were not otherwise manipulated to favor the partner businesses. Such featured reviews were shown with a strip above them that said "One of [Insert Business Here]'s Favorite Reviews" and "This business is a Yelp sponsor." The company also said it might have had some rogue salespeople that misrepresented their practices when selling advertising services. In response to the criticism of their allowing their advertising partners to manipulate the review listing, Yelp ceased its "featured review" practice in 2010.
Several lawsuits have been filed against Yelp accusing it of extorting businesses into buying advertising products. Each has been dismissed by a judge before reaching trial. In February 2010, a class-action lawsuit was filed against Yelp alleging it asked a Long Beach veterinary hospital to pay $300 a month for advertising services that included the suppression or deletion of disparaging customer reviews. The following month, nine additional businesses joined the class-action lawsuit, and two similar lawsuits were filed. That May the lawsuits were combined into one class-action lawsuit, which was dismissed by San Francisco U.S. District Judge Edward Chen in 2011. Chen said the reviews were protected by the Communications Decency Act of 1996 and that there was no evidence of manipulation by Yelp. The plaintiffs filed an appeal. In September 2014, the United States Court of Appeals for the Ninth Circuit upheld the dismissal, finding that even if Yelp did manipulate reviews to favor advertisers, this would not fall under the court's legal definition of extortion.
In August 2013, Yelp launched a series of town hall style meetings in 22 major American cities in an effort to address concerns among local business owners. Many attendees expressed frustration with seeing Yelp remove positive reviews after they declined to advertise, receiving reviews from users that never entered the establishment, and other issues. A 2011 "working paper" published by Harvard Business School from Harvard Associate Professor Michael Luca and Georgios Zervas of Boston University found that there was no significant statistical correlation between being a Yelp advertiser and having more favorable reviews. The Federal Trade Commission received 2,046 complaints about Yelp from 2008 to 2014, most from small businesses regarding allegedly unfair or fake reviews or negative reviews that appear after declining to advertise. According to Yelp, the Federal Trade Commission finished a second examination of Yelp's practices in 2015 and in both cases did not pursue an action against the company.
Journalist David Lazarus of the Los Angeles Times also criticized Yelp in 2014 for the practice of selling competitors' ads to run on top of business listings and then offering to have the ads removed as part of a paid feature.
The 2019 film Billion Dollar Bully documents Yelp's alleged business practices.
In 2018, in the case Hassell v. Bird, the California Supreme Court held by a narrow 4–3 margin that a business cannot force Yelp to remove a review, even if the review is defamatory of the business.
A 2019 investigation by Vice News and the podcast Underunderstood found that in some cases, Yelp was replacing restaurant's direct phone numbers with numbers that routed through GrubHub, which would then charge restaurants for the calls under marketing agreements GrubHub has with restaurants.
Political expression and politically motivated ratings
Eater reported that between 2012 and 2015, a number of users who review restaurants on the site have posted reviews that contained comments about the political activities and political views of businesses and their owners or have submitted ratings affected by political motivations. The article found that in some instances, the Yelp review area for a business has become flooded with such review submissions after a business was involved in politically sensitive action. Yelp has removed reviews of this nature and has tried to suppress their submission.
Litigation over review content
According to data compiled in 2014 by The Wall Street Journal, Yelp receives about six subpoenas a month asking for the names of anonymous reviewers, mostly from business owners seeking litigation against those writing negative reviews. In 2012, the Alexandria Circuit Court and the Virginia Court of Appeals held Yelp in contempt for refusing to disclose the identities of seven reviewers who anonymously criticized a carpet-cleaning business. In 2014, Yelp appealed to the Virginia Supreme Court. A popular public argument in favor of Yelp at the time was that a ruling against Yelp would negatively affect free speech online. The judge from an early ruling said that if the reviewers did not actually use the businesses' services, their communications would be false claims not protected by free speech laws. The Virginia Supreme Court ruled that Yelp, a non-resident company in the state of Virginia, could not be subpoenaed by a lower court. Also in 2014, a California state law was enacted that prohibits businesses from using "disparagement clauses" in their contracts or terms of use that allow them to sue or fine customers that write negatively about them online.
Investigations
A 2020 Business Insider investigation questioned the culture, ethics and practices within Yelp. An April 2022 Vice article highlighted that some Elite reviewers use their status to sell reviews.
Community
A 2010 article in Inc. Magazine described most reviewers (sometimes called "Yelpers") as "well-intentioned" people who write reviews in order to express themselves, improve their writing, or to be creative, and in some cases, to lash out at corporate interests or businesses they dislike. Reviewers may also be motivated by badges and honors, such as being the first to review a new location, or by praise and attention from other users. Many reviews are written in an entertaining or creative manner. Users can give a review a "thumbs-up" rating, which will cause it to be ranked higher in the review listings. Each day a "Review of the Day" is determined based on a vote by users. According to The Discourse of Online Consumer Reviews citing papers from 2008 and 2011, many Yelp reviewers are "internet-savvy young adults" aged 18–25 or "suburban baby boomers".
Reviewers are encouraged to use real names and photos. Each year members of the Yelp community are invited or self-nominated to the "Yelp Elite Squad" and some are accepted based on an evaluation of the quality and frequency of their reviews. Members may nominate other reviewers for elite status. Users must use their real name and photo on Yelp to qualify for the Elite Squad. To accept a nomination, members must not own a business. Elite Squad Yelpers are governed by a council and estimated to include several thousand members. Yelp does not disclose how the Yelp Elite are selected. Elite Squad members are given different color badges based on how long they've been an elite member. The Yelp Elite Squad originated with parties Yelp began throwing for members in 2005, and in 2006 it was formally codified; the name came from a joking reference to prolific reviewers that were invited to Yelp parties as the "Yelp Elite Squad"." Members are invited to special opening parties, given gifts, and receive other perks. As of 2017, there are over 80 local Elite Squads in North America.
As of 2017, Yelp employed a staff of over 80 community managers that organize parties for prolific reviewers, send encouraging messages to reviewers, and host classes for small business owners. Yelp reviewers are not required to disclose their identity, but Yelp encourages them to do so.
Source: Wikipedia, CC BY-SA 4.0 · View on Wikipedia ↗
10-Year Performance Revenue, net income, margins and EPS trends
Valuation P/E, P/S, P/B, EV/EBITDA ratios — is the stock expensive or cheap?
| Metric | 5Y trend | YELP | 5Y avg | Peer Median | Verdict |
|---|---|---|---|---|---|
| P/E (TTM) | 8.85Y avg ≈39.3 | ≈39.3 | 15.8 | Undervalued | |
| P/S (TTM) | 0.75Y avg ≈1.9 | ≈1.9 | 1.3 | Undervalued | |
| P/B (MRQ) | 1.65Y avg ≈3.3 | ≈3.3 | 2.1 | Fair value | |
| Price / FCF (TTM) | 3.45Y avg ≈10.7 | ≈10.7 | · | · | |
| Price / Cash Flow (TTM) | 2.95Y avg ≈9.3 | ≈9.3 | 12.3 | Undervalued | |
| Price / Tangible Book (MRQ) | 1.85Y avg ≈4.1 | ≈4.1 | · | · |
Peer median is calculated on a standardized basis per metric and may not always match the TTM/MRQ basis shown for this stock.
Profitability Gross, operating and net margins; ROE, ROA, ROIC
| Metric | 5Y trend | YELP | 5Y avg | Peer Median | Verdict |
|---|---|---|---|---|---|
| Operating Margin (TTM) | 11.7%5Y avg ≈7.4% | ≈7.4% | 8.6% | Top tier | |
| EBITDA Margin (TTM) | 15.8%5Y avg ≈11.2% | ≈11.2% | 8.6% | Top tier | |
| Pretax Margin (TTM) | 12.5%5Y avg ≈8.7% | ≈8.7% | 11.8% | In line | |
| Net Profit Margin (TTM) | 8.6%5Y avg ≈6.7% | ≈6.7% | 12.8% | Weak | |
| ROA (TTM) | 12.8%5Y avg ≈9.0% | ≈9.0% | 15.0% | In line | |
| ROE (TTM) | 18.2%5Y avg ≈12.3% | ≈12.3% | 20.0% | In line | |
| ROIC | 18.5%5Y avg ≈10.5% | ≈10.5% | 18.5% | In line |
Financial Health Debt, liquidity, solvency — balance sheet strength
| Metric | 5Y trend | YELP | 5Y avg | Peer Median | Verdict |
|---|---|---|---|---|---|
| Current Ratio (MRQ) | 1.75Y avg ≈3.4 | ≈3.4 | 1.8 | Low liquidity | |
| Quick Ratio (MRQ) | 1.55Y avg ≈3.1 | ≈3.1 | 1.5 | Low liquidity |
Growth Revenue, EPS and net income growth: YoY, 3Y CAGR, 5Y CAGR
| Metric | 5Y trend | YELP | 5Y avg | Peer Median | Verdict |
|---|---|---|---|---|---|
| Revenue YoY | 3.8%5Y avg ≈11.1% | ≈11.1% | · | · | |
| Revenue CAGR 3Y | 7.1%5Y avg ≈11.1% | ≈11.1% | · | · | |
| Revenue CAGR 5Y | 10.9% | · | · | · | |
| EPS YoY | 19.1%5Y avg ≈57.1% | ≈57.1% | · | · | |
| Net Income YoY | 9.6%5Y avg ≈52.0% | ≈52.0% | · | · | |
| EPS CAGR 3Y | 64.8% | · | · | · | |
| Net Income CAGR 3Y | 58.8% | · | · | · |
Capital Efficiency Asset turnover, inventory turnover, receivables turnover
| Metric | 5Y trend | YELP | 5Y avg | Peer Median | Verdict |
|---|---|---|---|---|---|
| Asset Turnover | 1.55Y avg ≈1.3 | ≈1.3 | 0.8 | Top tier | |
| Receivables Turnover | 9.55Y avg ≈9.8 | ≈9.8 | 8.0 | Top tier | |
| Revenue / Employee | ≈$283.5K | · | · | · |
value · ≈ 5Y avg · industry median · verdict relative to median
Earnings History EPS actual vs estimate, surprise %, beat rate, next earnings date
| Period | Report | EPS Actual | EPS Est | Surprise |
|---|---|---|---|---|
| June 30, 2026 | Aug 5, 2026 | $0.57 | $0.40 | 43.3% |
| March 31, 2026 | $0.30 | $0.27 | 11.7% | |
| Dec. 31, 2025 | $0.61 | $0.66 | -7.5% | |
| Sept. 30, 2025 | $0.61 | $0.53 | 15.8% | |
| June 30, 2025 | $0.67 | $0.59 | 13.7% | |
| March 31, 2025 | $0.42 | $0.39 | 7.1% |
Full Fundamentals All metrics by year — income statement, balance sheet, cash flow
Income Statement
| Metric | Trend | 2025 | 2024 | 2023 | 2022 | 2021 | 2020 | 2019 | 2018 | 2017 | 2016 | 2015 | 2014 |
|---|---|---|---|---|---|---|---|---|---|---|---|---|---|
| Revenue | $1.46B | $1.41B | $1.34B | $1.19B | $1.03B | $873M | $1.01B | $943M | $851M | $716M | $550M | $378M | |
| Cost of Revenue | · | · | · | $106M | $78M | $57M | $62M | $58M | $71M | $60M | $51M | $24M | |
| R&D Expense | $298M | $310M | $321M | $294M | $265M | $230M | $226M | $206M | $171M | $133M | $105M | $65M | |
| SG&A Expense | $182M | $185M | $212M | $164M | $136M | $130M | $136M | $121M | $110M | $100M | $81M | $58M | |
| Operating Expenses | $1.28B | $1.26B | $1.26B | $1.14B | $1.00B | $912M | $979M | $917M | $671M | $718M | $571M | $366M | |
| Operating Income | $185M | $151M | $79M | $58M | $32M | $-39M | $36M | $26M | $180M | $-2M | $-21M | $11M | |
| Interest Income | · | · | · | · | · | $2M | $13M | $14M | $4M | $2M | $622.0K | $375.0K | |
| Other Non-op | $6M | $8M | $6M | $3M | $2M | $1M | $901.0K | $375.0K | $417.0K | $145.0K | $451.0K | $-33.0K | |
| Pretax Income | $204M | $183M | $105M | $67M | $34M | $-35M | $50M | $40M | $184M | $-326.0K | $-21M | $11M | |
| Income Tax | $58M | $50M | $6M | $30M | $-6M | $-16M | $9M | $-15M | $31M | $1M | $12M | $-25M | |
| Net Income | $146M | $133M | $99M | $36M | $40M | $-19M | $41M | $55M | $153M | $-2M | $-33M | $36M | |
| EPS (Basic) | $2.30 | $1.97 | $1.43 | $0.51 | $0.53 | $-0.27 | $0.55 | $0.66 | $1.87 | $-0.02 | $-0.44 | $0.51 | |
| EPS (Diluted) | $2.24 | $1.88 | $1.35 | $0.50 | $0.50 | $-0.27 | $0.52 | $0.62 | $1.76 | $-0.02 | $-0.44 | $0.48 | |
| Shares (Basic) | 63,334,000 | 67,415,000 | 69,221,000 | 70,867,000 | 74,221,000 | 73,005,000 | 74,627,000 | 83,573,000 | 81,602,000 | 77,186,000 | 74,683,000 | 71,936,000 | |
| Shares (Diluted) | 65,090,000 | 70,611,000 | 73,596,000 | 73,402,000 | 78,616,000 | 73,005,000 | 77,969,000 | 88,709,000 | 87,170,000 | 77,186,000 | 74,683,000 | 76,712,000 | |
| EBITDA | $235M | $191M | $121M | $103M | $87M | $12M | · | $69M | $221M | $30M | $8M | $29M |
Balance Sheet
| Metric | Trend | 2025 | 2024 | 2023 | 2022 | 2021 | 2020 | 2019 | 2018 | 2017 | 2016 | 2015 | 2014 |
|---|---|---|---|---|---|---|---|---|---|---|---|---|---|
| Cash & Equivalents | $216M | $217M | $314M | $306M | $480M | $596M | $170M | $333M | $548M | $272M | $172M | $247M | |
| Short-term Investments | $103M | $101M | $127M | $94M | $0 | $0 | $242M | $423M | $273M | $207M | $199M | $118M | |
| Receivables | $153M | $155M | $146M | $132M | $107M | $88M | $107M | $87M | $76M | $69M | $53M | $36M | |
| Prepaid Expense | $42M | $44M | $37M | $63M | $58M | $28M | $14M | $17M | $16M | $13M | $20M | $19M | |
| Other Current Assets | $20M | $15M | $17M | $7M | $5M | $7M | $4M | $8M | · | · | · | · | |
| Current Assets | $515M | $517M | $624M | $596M | $645M | $713M | $533M | $860M | $913M | $561M | $443M | $421M | |
| PP&E (Net) | $92M | $76M | $69M | $77M | $84M | $102M | $111M | $115M | $104M | $92M | $80M | $63M | |
| PP&E (Gross) | $390M | $393M | $381M | $359M | $329M | $332M | $296M | $257M | $210M | $169M | $131M | $94M | |
| Accum. Depreciation | $298M | $317M | $312M | $282M | $245M | $230M | $185M | $143M | $106M | $76M | $50M | $31M | |
| Goodwill | $136M | $131M | $104M | $102M | $105M | $109M | $105M | $106M | $108M | $171M | $172M | $67M | |
| Intangibles | $49M | $59M | $8M | $9M | $11M | $14M | $10M | $13M | $17M | $33M | $39M | $6M | |
| Other Non-current Assets | $151M | $177M | $162M | $134M | $65M | $49M | $38M | $59M | $40M | $11M | $4M | · | |
| Total Assets | $958M | $984M | $1.01B | $1.02B | $1.05B | $1.15B | $1.07B | $1.18B | $1.23B | $885M | $755M | $630M | |
| Accounts Payable | $10M | $12M | $12M | $15M | $16M | $9M | $6M | $7M | $9M | $2M | $3M | $1M | |
| Accrued Liabilities | · | $131M | $133M | $138M | $120M | $88M | $72M | $61M | $74M | $37M | $43M | $30M | |
| Current Liabilities | $172M | $155M | $176M | $183M | $164M | $143M | $134M | $65M | $86M | $60M | $50M | $34M | |
| Capital Leases | $17M | $22M | $48M | $87M | $128M | $149M | $175M | $0 | · | · | · | · | |
| Other Non-current Liabilities | $58M | $62M | $41M | $36M | $7M | $8M | $7M | $4M | $4M | $725.0K | $706.0K | · | |
| Total Liabilities | $248M | $240M | $265M | $306M | $299M | $300M | $316M | $100M | $117M | $78M | $62M | $42M | |
| Total Debt | · | · | · | · | · | · | · | · | · | $18M | $12M | $8M | |
| Common Stock | $0 | $0 | $0 | $0 | $0 | $0 | $0 | $0 | $0 | $0 | · | · | |
| Paid-in Capital | $2.01B | $1.90B | $1.79B | $1.65B | $1.52B | $1.40B | $1.26B | $1.14B | $1.04B | $893M | $774M | $628M | |
| Retained Earnings | $-1.29B | $-1.14B | $-1.02B | $-924M | $-760M | $-534M | $-493M | $-53M | $79M | $-70M | $-67M | $-34M | |
| Treasury Stock | $999.0K | $4M | $282.0K | $0 | $0 | $3M | $0 | $0 | $46.0K | $0 | · | · | |
| AOCI | $-8M | $-15M | $-12M | $-16M | $-11M | $-7M | $-12M | $-11M | $-8M | $-16M | $-14M | $-6M | |
| Stockholders' Equity | $711M | $744M | $750M | $710M | $751M | $855M | $755M | $1.08B | $1.11B | $816M | $700M | $588M | |
| Liabilities + Equity | $958M | $984M | $1.01B | $1.02B | $1.05B | $1.15B | $1.07B | $1.18B | $1.23B | $885M | $755M | $630M | |
| Shares Outstanding | 59,954,000 | 65,792,000 | 68,864,000 | 69,797,000 | 72,171,000 | 75,371,000 | 71,185,000 | 81,997,000 | 83,724,916 | 79,429,833 | 75,982,802 | 72,920,582 |
Cash Flow
| Metric | Trend | 2025 | 2024 | 2023 | 2022 | 2021 | 2020 | 2019 | 2018 | 2017 | 2016 | 2015 | 2014 |
|---|---|---|---|---|---|---|---|---|---|---|---|---|---|
| D&A | $50M | $40M | $42M | $45M | $56M | $51M | $49M | $43M | $41M | $35M | $30M | $18M | |
| Stock-based Comp | $134M | $158M | $173M | $156M | $152M | $125M | $122M | $114M | $100M | $86M | $61M | $42M | |
| Deferred Tax | $25M | $-25M | $-22M | $-57M | $-9M | $-11M | $-3M | $-15M | $283.0K | $1M | $11M | $-27M | |
| Amort. of Intangibles | $10M | $3M | $1M | $2M | $3M | $3M | $3M | $4M | $7M | $7M | $6M | $2M | |
| Restructuring | · | · | $0 | $0 | $32.0K | $4M | $0 | $0 | · | · | · | · | |
| Other Non-cash | $17M | $-21M | $14M | $12M | $-25M | $32M | · | $-37M | $-127M | $9M | $-11M | $-11M | |
| Operating Cash Flow | $372M | $286M | $306M | $192M | $213M | $177M | $205M | $160M | $168M | $127M | $57M | $58M | |
| CapEx | $48M | $37M | $27M | $32M | $28M | $32M | $38M | $45M | $30M | $23M | $31M | $29M | |
| Investing Cash Flow | $-46M | $-77M | $-55M | $-126M | $-28M | $248M | $124M | $-164M | $81M | $-55M | $-159M | · | |
| Stock Repurchased | $291M | $251M | $200M | $200M | $263M | $24M | $481M | $187M | $13M | $0 | $482.0K | $1M | |
| Net Stock Activity | $-291M | $-251M | $-200M | $-200M | $-263M | $-24M | · | $-187M | $-13M | · | $-482.0K | $-1M | |
| Financing Cash Flow | $-330M | $-304M | $-247M | $-238M | $-300M | $-21M | $-492M | $-208M | $27M | $30M | $26M | · | |
| Net Change in Cash | $-1M | $-96M | $7M | $-174M | $-116M | $404M | $-163M | $-212M | $277M | $101M | $-76M | $-142M | |
| Taxes Paid | $34M | $58M | $31M | $50M | $3M | $214.0K | $7M | $29M | $530.0K | $813.0K | · | · | |
| Free Cash Flow | $324M | $248M | $279M | $160M | $184M | $145M | · | $135M | $152M | $104M | $26M | $29M |
Profitability
| Metric | Trend | 2025 | 2024 | 2023 | 2022 | 2021 | 2020 | 2019 | 2018 | 2017 | 2016 | 2015 | 2014 |
|---|---|---|---|---|---|---|---|---|---|---|---|---|---|
| Operating Margin | 12.6% | 10.7% | 5.9% | 4.9% | 3.0% | -4.4% | · | 2.8% | 21.2% | -0.70% | -3.9% | 2.9% | |
| Net Margin | 9.9% | 9.4% | 7.4% | 3.0% | 3.8% | -2.2% | · | 5.9% | 18.1% | -0.65% | -6.0% | 9.7% | |
| Pretax Margin | 13.9% | 13.0% | 7.9% | 5.6% | 3.3% | -4.0% | · | 4.2% | 21.8% | -0.46% | -3.8% | 3.0% | |
| EBITDA Margin | 16.0% | 13.6% | 9.1% | 8.6% | 8.5% | 1.4% | · | 7.3% | 26.1% | 4.3% | 1.5% | 7.6% | |
| ROA | 15.0% | 13.3% | 9.8% | 3.5% | 3.6% | -1.8% | · | 4.6% | 14.5% | -0.57% | -4.8% | 6.4% | |
| ROE | 20.0% | 17.9% | 13.3% | 5.1% | 5.2% | -2.3% | · | 5.0% | 16.0% | -0.62% | -5.1% | 6.8% | |
| ROIC | 18.5% | 14.7% | 10.0% | 4.5% | 4.9% | -2.5% | · | 3.3% | 13.5% | -0.86% | -4.8% | 6.0% |
Liquidity & Solvency
| Metric | Trend | 2025 | 2024 | 2023 | 2022 | 2021 | 2020 | 2019 | 2018 | 2017 | 2016 | 2015 | 2014 |
|---|---|---|---|---|---|---|---|---|---|---|---|---|---|
| Current Ratio | 3.0 | 3.3 | 3.5 | 3.3 | 3.9 | 5.0 | · | 13.3 | 10.6 | 9.3 | 8.9 | 12.4 | |
| Quick Ratio | 2.7 | 3.1 | 3.3 | 2.9 | 3.6 | 4.8 | · | 13.0 | 10.4 | 9.1 | 8.5 | 11.8 | |
| Debt / Equity | · | · | · | · | · | · | · | · | · | 0.0 | 0.0 | 0.0 | |
| LT Debt / Equity | · | · | · | · | · | · | · | · | · | 0.0 | 0.0 | 0.0 |
Efficiency
| Metric | Trend | 2025 | 2024 | 2023 | 2022 | 2021 | 2020 | 2019 | 2018 | 2017 | 2016 | 2015 | 2014 |
|---|---|---|---|---|---|---|---|---|---|---|---|---|---|
| Asset Turnover | 1.5 | 1.4 | 1.3 | 1.2 | 0.9 | 0.8 | · | 0.8 | 0.8 | 0.9 | 0.8 | 0.7 | |
| Receivables Turnover | 9.5 | 9.4 | 9.6 | 10.0 | 10.5 | 8.9 | · | 11.5 | 11.7 | 11.7 | 12.4 | 13.3 |
Per Share
| Metric | Trend | 2025 | 2024 | 2023 | 2022 | 2021 | 2020 | 2019 | 2018 | 2017 | 2016 | 2015 | 2014 |
|---|---|---|---|---|---|---|---|---|---|---|---|---|---|
| Book Value / Share | $11.86 | $11.31 | $10.88 | $10.18 | $10.41 | $11.35 | · | $13.12 | $13.13 | $10.16 | $9.13 | $8.07 | |
| Revenue / Share | $22.51 | $20.00 | $18.17 | $16.26 | $13.13 | $11.96 | · | $10.63 | $9.71 | $9.24 | $7.36 | $4.92 | |
| Cash Flow / Share | $5.72 | $4.05 | $4.16 | $2.62 | $2.71 | $2.42 | · | $1.81 | $1.92 | $1.64 | $0.77 | $0.76 | |
| Cash / Share | $3.60 | $3.30 | $4.56 | $4.39 | $6.65 | $7.92 | · | $4.06 | $6.54 | $3.43 | $2.26 | $3.39 | |
| EPS (TTM) | $2.24 | $1.88 | $1.35 | $0.50 | $0.50 | $-0.27 | $0.52 | $0.62 | $1.76 | $-0.02 | $-0.44 | $0.48 |
Growth Rates
| Metric | Trend | 2025 | 2024 | 2023 | 2022 | 2021 | 2020 | 2019 | 2018 | 2017 | 2016 | 2015 | 2014 |
|---|---|---|---|---|---|---|---|---|---|---|---|---|---|
| Revenue YoY | 3.8% | 5.6% | 12.0% | 15.7% | 18.2% | · | · | · | · | · | · | · | |
| Revenue CAGR 3Y | 7.1% | 11.0% | 15.3% | · | · | · | · | · | · | · | · | · | |
| Revenue CAGR 5Y | 10.9% | · | · | · | · | · | · | · | · | · | · | · | |
| EPS YoY | 19.1% | 39.3% | 170.0% | 0.00% | · | · | · | · | · | · | · | · | |
| EPS CAGR 3Y | 64.8% | 55.5% | · | · | · | · | · | · | · | · | · | · | |
| Net Income YoY | 9.6% | 34.0% | 172.8% | -8.4% | · | · | · | · | · | · | · | · | |
| Net Income CAGR 3Y | 58.8% | 49.6% | · | · | · | · | · | · | · | · | · | · |
Valuation (TTM)
| Metric | Trend | 2025 | 2024 | 2023 | 2022 | 2021 | 2020 | 2019 | 2018 | 2017 | 2016 | 2015 | 2014 |
|---|---|---|---|---|---|---|---|---|---|---|---|---|---|
| Revenue TTM | $1.46B | $1.41B | $1.34B | $1.19B | $1.03B | $873M | $1.01B | $943M | $851M | $716M | $550M | $378M | |
| Net Income TTM | $146M | $133M | $99M | $36M | $40M | $-19M | $41M | $55M | $153M | $-2M | $-33M | $36M | |
| Market Cap | $1.82B | $2.55B | $3.26B | $1.91B | $2.62B | $2.46B | · | $2.87B | $3.51B | $3.03B | $2.19B | $3.99B | |
| Enterprise Value | · | · | · | · | · | · | · | · | · | $2.57B | $1.83B | $3.63B | |
| P/E | 13.6 | 20.6 | 35.1 | 54.7 | 72.5 | -121.0 | 67.0 | 56.4 | 23.8 | -1906.5 | -65.5 | 114.0 | |
| P/S | 1.2 | 1.8 | 2.4 | 1.6 | 2.5 | 2.8 | · | 3.0 | 4.1 | 4.2 | 4.0 | 10.6 | |
| P/B | 2.6 | 3.4 | 4.3 | 2.7 | 3.5 | 2.9 | · | 2.7 | 3.2 | 3.8 | 3.2 | 6.8 | |
| P / Tangible Book | 3.5 | 4.6 | 5.1 | 3.2 | 4.1 | 3.4 | · | · | · | · | · | · | |
| P / Cash Flow | 4.9 | 8.9 | 10.6 | 9.9 | 12.3 | 13.9 | · | 17.9 | 21.0 | 23.9 | 38.1 | 68.9 | |
| P / FCF | 5.6 | 10.2 | 11.7 | 11.9 | 14.2 | 17.0 | · | 21.2 | 23.1 | 29.1 | 83.4 | 138.2 | |
| EV / EBITDA | · | · | · | · | · | · | · | · | · | 84.5 | 221.0 | 126.8 | |
| EV / FCF | · | · | · | · | · | · | · | · | · | 24.7 | 69.7 | 125.8 | |
| EV / Revenue | · | · | · | · | · | · | · | · | · | 3.6 | 3.3 | 9.6 | |
| Earnings Yield | 7.4% | 4.9% | 2.9% | 1.8% | 1.4% | -0.83% | 1.5% | 1.8% | 4.2% | -0.05% | -1.5% | 0.88% |
Income Statement
| Metric | Trend | Q2 2026 | Q1 2026 | Q4 2025 | Q3 2025 | Q2 2025 | Q1 2025 | Q4 2024 | Q3 2024 | Q2 2024 | Q1 2024 | Q4 2023 | Q3 2023 | Q2 2023 | Q1 2023 | Q4 2022 | Q3 2022 |
|---|---|---|---|---|---|---|---|---|---|---|---|---|---|---|---|---|---|
| Revenue | $376M | $361M | $360M | $376M | $370M | $359M | $362M | $360M | $357M | $333M | $342M | $345M | $337M | $312M | $309M | $309M | |
| SG&A Expense | $48M | $49M | $38M | $45M | $46M | $52M | $45M | $50M | $45M | $45M | $67M | $46M | $53M | $47M | $38M | $48M | |
| Operating Expenses | $332M | $334M | $311M | $323M | $317M | $329M | $309M | $314M | $317M | $322M | $317M | $303M | $318M | $319M | $276M | $295M | |
| Operating Income | $44M | $27M | $49M | $53M | $53M | $29M | $53M | $47M | $40M | $11M | $25M | $42M | $19M | $-7M | $33M | $13M | |
| Interest Income | $939.0K | · | · | · | $4M | · | · | · | · | · | · | · | · | · | · | · | |
| Other Non-op | $1M | $2M | $-371.0K | $2M | $2M | $2M | $2M | $2M | $2M | $2M | $3M | $1M | $1M | $1M | $168.0K | $897.0K | |
| Pretax Income | $44M | $30M | $52M | $58M | $59M | $35M | $60M | $54M | $50M | $19M | $34M | $48M | $25M | $-1M | $37M | $16M | |
| Income Tax | $13M | $12M | $14M | $19M | $15M | $11M | $18M | $15M | $12M | $5M | $6M | $-10M | $10M | $-197.0K | $17M | $7M | |
| Net Income | $32M | $18M | $38M | $39M | $44M | $24M | $42M | $38M | $38M | $14M | $27M | $58M | $15M | $-1M | $20M | $9M | |
| EPS (Basic) | $0.57 | $0.30 | $0.62 | $0.62 | $0.69 | $0.37 | $0.63 | $0.57 | $0.56 | $0.21 | $0.40 | $0.84 | $0.21 | $-0.02 | $0.28 | $0.13 | |
| EPS (Diluted) | $0.57 | $0.30 | $0.60 | $0.61 | $0.67 | $0.36 | $0.58 | $0.56 | $0.54 | $0.20 | $0.37 | $0.79 | $0.21 | $-0.02 | $0.27 | $0.13 | |
| Shares (Basic) | 55,305,000 | 58,816,000 | · | 63,025,000 | 64,145,000 | 65,261,000 | · | 67,219,000 | 67,815,000 | 68,559,000 | · | 69,030,000 | 69,256,000 | 69,821,000 | · | 70,630,000 | |
| Shares (Diluted) | 55,726,000 | 59,374,000 | · | 64,216,000 | 65,683,000 | 67,324,000 | · | 69,163,000 | 70,444,000 | 72,247,000 | · | 73,566,000 | 71,238,000 | 69,821,000 | · | 72,658,000 | |
| EBITDA | $62M | $44M | · | $65M | $66M | $42M | · | $56M | $49M | $21M | · | $52M | $29M | $4M | · | $25M |
Balance Sheet
| Metric | Trend | Q2 2026 | Q1 2026 | Q4 2025 | Q3 2025 | Q2 2025 | Q1 2025 | Q4 2024 | Q3 2024 | Q2 2024 | Q1 2024 | Q4 2023 | Q3 2023 | Q2 2023 | Q1 2023 | Q4 2022 | Q3 2022 |
|---|---|---|---|---|---|---|---|---|---|---|---|---|---|---|---|---|---|
| Cash & Equivalents | $94M | $110M | $216M | $231M | $198M | $222M | $217M | $262M | $252M | $296M | · | $305M | $270M | $289M | · | $331M | |
| Short-term Investments | $0 | $0 | $103M | $102M | $103M | $102M | $101M | $135M | $132M | $125M | · | $121M | $127M | $125M | · | $91M | |
| Receivables | $158M | $152M | $153M | $153M | $156M | $158M | $155M | $155M | $154M | $148M | · | $160M | $152M | $140M | · | $127M | |
| Prepaid Expense | $42M | $39M | $42M | $63M | $52M | $45M | $44M | $38M | $45M | $38M | · | $40M | $39M | $37M | · | $74M | |
| Other Current Assets | $21M | $17M | $20M | $32M | $21M | $14M | $15M | $14M | $20M | $14M | · | $9M | $9M | $7M | · | $48M | |
| Current Assets | $294M | $302M | $515M | $550M | $509M | $528M | $517M | $590M | $584M | $607M | · | $626M | $588M | $592M | · | $623M | |
| PP&E (Net) | $99M | $95M | $92M | $90M | $84M | $79M | $76M | $74M | $71M | $68M | · | $72M | $76M | $77M | · | $79M | |
| PP&E (Gross) | $376M | $361M | $390M | $396M | $397M | $404M | $393M | $385M | $395M | $386M | · | $374M | $367M | $361M | · | $350M | |
| Accum. Depreciation | $277M | $266M | $298M | $306M | $313M | $325M | $317M | $311M | $325M | $318M | · | $302M | $292M | $284M | · | $272M | |
| Goodwill | $355M | $356M | $136M | $136M | $137M | $134M | $131M | $104M | $102M | $103M | $104M | $102M | $103M | $103M | $102M | $98M | |
| Intangibles | $92M | $99M | $49M | $51M | $54M | $56M | $59M | $7M | $7M | $7M | · | $8M | $8M | $9M | · | $9M | |
| Other Non-current Assets | $135M | $144M | $151M | $145M | $176M | $167M | $177M | $177M | $161M | $164M | · | $147M | $179M | $154M | · | $115M | |
| Total Assets | $991M | $1.01B | $958M | $990M | $980M | $985M | $984M | $980M | $965M | $993M | · | $1.03B | $1.03B | $1.02B | · | $1.03B | |
| Accounts Payable | $9M | $7M | $10M | $12M | $12M | $13M | $12M | $7M | $12M | $6M | · | $7M | $12M | $18M | · | $10M | |
| Accrued Liabilities | · | · | · | $169M | $142M | $164M | · | $135M | $118M | $145M | · | $144M | $172M | $153M | · | $151M | |
| Current Liabilities | $168M | $174M | $172M | $184M | $156M | $182M | $155M | $170M | $158M | $191M | · | $190M | $216M | $199M | · | $199M | |
| Capital Leases | $16M | $18M | $17M | $19M | $21M | $20M | $22M | $26M | $33M | $38M | · | $58M | $68M | $77M | · | $95M | |
| Other Non-current Liabilities | $62M | $61M | $58M | $54M | $57M | $54M | $62M | $44M | $39M | $42M | · | $41M | $41M | $41M | · | $34M | |
| Total Liabilities | $346M | $382M | $248M | $257M | $234M | $257M | $240M | $241M | $230M | $272M | · | $288M | $325M | $318M | · | $329M | |
| Common Stock | $0 | $0 | $0 | $0 | $0 | $0 | $0 | $0 | $0 | $0 | · | $0 | $0 | $0 | · | $0 | |
| Paid-in Capital | $2.07B | $2.04B | $2.01B | $1.98B | $1.96B | $1.92B | $1.90B | $1.87B | $1.85B | $1.81B | · | $1.76B | $1.73B | $1.69B | · | $1.62B | |
| Retained Earnings | $-1.42B | $-1.39B | $-1.29B | $-1.24B | $-1.20B | $-1.18B | $-1.14B | $-1.12B | $-1.10B | $-1.07B | · | $-1.00B | $-1.01B | $-975M | · | $-894M | |
| Treasury Stock | $3M | $6M | $999.0K | $3M | $1M | $2M | $4M | $3M | $806.0K | $8M | · | $267.0K | $159.0K | $37.0K | · | · | |
| AOCI | $-10M | $-10M | $-8M | $-8M | $-7M | $-13M | $-15M | $-11M | $-14M | $-14M | · | $-15M | $-14M | $-14M | · | $-21M | |
| Stockholders' Equity | $645M | $631M | $711M | $733M | $746M | $728M | $744M | $740M | $735M | $722M | $750M | $740M | $709M | $704M | $710M | $701M | |
| Liabilities + Equity | $991M | $1.01B | $958M | $990M | $980M | $985M | $984M | $980M | $965M | $993M | · | $1.03B | $1.03B | $1.02B | · | $1.03B | |
| Shares Outstanding | 54,980,000 | 55,915,000 | 59,954,000 | 62,141,000 | 63,841,000 | 64,743,000 | 65,691,000 | 66,638,000 | 67,622,000 | 68,330,000 | 68,864,000 | 68,962,000 | 69,287,000 | 69,649,000 | 69,797,000 | 70,399,000 |
Cash Flow
| Metric | Trend | Q2 2026 | Q1 2026 | Q4 2025 | Q3 2025 | Q2 2025 | Q1 2025 | Q4 2024 | Q3 2024 | Q2 2024 | Q1 2024 | Q4 2023 | Q3 2023 | Q2 2023 | Q1 2023 | Q4 2022 | Q3 2022 |
|---|---|---|---|---|---|---|---|---|---|---|---|---|---|---|---|---|---|
| D&A | $18M | $16M | $13M | $13M | $12M | $12M | $12M | $9M | $10M | $10M | $10M | $10M | $11M | $11M | $11M | $11M | |
| Stock-based Comp | $26M | $31M | $29M | $33M | $35M | $37M | $35M | $39M | $41M | $43M | $40M | $43M | $44M | $46M | $36M | $39M | |
| Deferred Tax | $11M | $10M | $-5M | $33M | $-6M | $3M | $-8M | $-15M | $-133.0K | $-2M | $-13M | $33M | $-22M | $-20M | $-15M | $-17M | |
| Amort. of Intangibles | $7M | $5M | $2M | $2M | $2M | $2M | $2M | $300.0K | $400.0K | $300.0K | $400.0K | $300.0K | $400.0K | $300.0K | $400.0K | $300.0K | |
| Restructuring | · | · | · | · | · | · | · | · | · | · | · | · | · | · | · | $0 | |
| Other Non-cash | · | $-16M | · | · | · | $20M | · | · | · | $8M | · | · | · | $38M | · | · | |
| Operating Cash Flow | $76M | $58M | $84M | $132M | $58M | $98M | $71M | $102M | $40M | $73M | $79M | $105M | $48M | $74M | $44M | $70M | |
| CapEx | $15M | $13M | $12M | $13M | $13M | $11M | $11M | $10M | $10M | $7M | $6M | $6M | $8M | $8M | $12M | $6M | |
| Investing Cash Flow | $-15M | $-168M | $-8M | $-11M | $-15M | $-12M | $-43M | $-11M | $-17M | $-6M | $-8M | $420.0K | $-10M | $-37M | $-15M | $-97M | |
| Stock Repurchased | $50M | $124M | $87M | $75M | $66M | $62M | $62M | $66M | $60M | $62M | $50M | $50M | $50M | $50M | $50M | $50M | |
| Net Stock Activity | · | $-124M | · | · | · | $-62M | · | · | · | $-62M | · | · | · | $-50M | · | · | |
| Financing Cash Flow | $-77M | $5M | $-92M | $-86M | $-70M | $-82M | $-71M | $-83M | $-67M | $-84M | $-64M | $-70M | $-58M | $-55M | $-56M | $-61M | |
| Net Change in Cash | $-17M | $-105M | $-15M | $33M | $-24M | $5M | $-44M | $9M | $-43M | $-18M | $9M | $35M | $-19M | $-17M | $-25M | $-90M | |
| Taxes Paid | $3M | $3M | $6M | $2M | $30M | $-4M | $22M | $15M | $20M | $146.0K | $22M | $571.0K | $8M | $-181.0K | $10M | $16M | |
| Free Cash Flow | · | $45M | · | · | · | $87M | · | · | · | $66M | · | · | · | $67M | · | · |
Profitability
| Metric | Trend | Q2 2026 | Q1 2026 | Q4 2025 | Q3 2025 | Q2 2025 | Q1 2025 | Q4 2024 | Q3 2024 | Q2 2024 | Q1 2024 | Q4 2023 | Q3 2023 | Q2 2023 | Q1 2023 | Q4 2022 | Q3 2022 |
|---|---|---|---|---|---|---|---|---|---|---|---|---|---|---|---|---|---|
| Operating Margin | 11.7% | 7.5% | · | 14.1% | 14.4% | 8.2% | · | 13.0% | 11.1% | 3.4% | · | 12.1% | 5.6% | -2.1% | · | 4.3% | |
| Net Margin | 8.4% | 4.9% | · | 10.5% | 11.9% | 6.8% | · | 10.7% | 10.7% | 4.2% | · | 16.9% | 4.4% | -0.38% | · | 2.9% | |
| Pretax Margin | 11.8% | 8.3% | · | 15.5% | 15.9% | 9.8% | · | 14.9% | 14.0% | 5.7% | · | 13.9% | 7.3% | -0.44% | · | 5.2% | |
| EBITDA Margin | 16.5% | 12.0% | · | 17.4% | 17.7% | 11.7% | · | 15.5% | 13.8% | 6.4% | · | 15.2% | 8.7% | 1.4% | · | 8.0% | |
| ROA | 3.2% | 1.8% | · | 4.0% | 4.5% | 2.5% | · | 3.8% | 3.8% | 1.4% | · | 5.7% | 1.4% | -0.11% | · | 0.86% | |
| ROE | 4.5% | 2.6% | · | 5.3% | 5.9% | 3.4% | · | 5.2% | 5.3% | 2.0% | · | 8.1% | 2.1% | -0.16% | · | 1.2% | |
| ROIC | 4.8% | 2.6% | · | 4.9% | 5.3% | 2.8% | · | 4.5% | 4.1% | 1.2% | · | 6.9% | 1.6% | -0.80% | · | 1.1% |
Liquidity & Solvency
| Metric | Trend | Q2 2026 | Q1 2026 | Q4 2025 | Q3 2025 | Q2 2025 | Q1 2025 | Q4 2024 | Q3 2024 | Q2 2024 | Q1 2024 | Q4 2023 | Q3 2023 | Q2 2023 | Q1 2023 | Q4 2022 | Q3 2022 |
|---|---|---|---|---|---|---|---|---|---|---|---|---|---|---|---|---|---|
| Current Ratio | 1.7 | 1.7 | · | 3.0 | 3.3 | 2.9 | · | 3.5 | 3.7 | 3.2 | · | 3.3 | 2.7 | 3.0 | · | 3.1 | |
| Quick Ratio | 1.5 | 1.5 | · | 2.6 | 2.9 | 2.6 | · | 3.2 | 3.4 | 3.0 | · | 3.1 | 2.5 | 2.8 | · | 2.8 |
Efficiency
| Metric | Trend | Q2 2026 | Q1 2026 | Q4 2025 | Q3 2025 | Q2 2025 | Q1 2025 | Q4 2024 | Q3 2024 | Q2 2024 | Q1 2024 | Q4 2023 | Q3 2023 | Q2 2023 | Q1 2023 | Q4 2022 | Q3 2022 |
|---|---|---|---|---|---|---|---|---|---|---|---|---|---|---|---|---|---|
| Asset Turnover | 0.4 | 0.4 | · | 0.4 | 0.4 | 0.4 | · | 0.4 | 0.4 | 0.3 | · | 0.3 | 0.3 | 0.3 | · | 0.3 | |
| Receivables Turnover | 2.4 | 2.3 | · | 2.4 | 2.4 | 2.3 | · | 2.3 | 2.3 | 2.3 | · | 2.4 | 2.4 | 2.5 | · | 2.7 |
Per Share
| Metric | Trend | Q2 2026 | Q1 2026 | Q4 2025 | Q3 2025 | Q2 2025 | Q1 2025 | Q4 2024 | Q3 2024 | Q2 2024 | Q1 2024 | Q4 2023 | Q3 2023 | Q2 2023 | Q1 2023 | Q4 2022 | Q3 2022 |
|---|---|---|---|---|---|---|---|---|---|---|---|---|---|---|---|---|---|
| Book Value / Share | $11.72 | $11.29 | · | $11.80 | $11.69 | $11.24 | · | $11.10 | $10.87 | $10.57 | · | $10.72 | $10.23 | $10.11 | · | $9.96 | |
| Revenue / Share | $6.74 | $6.09 | · | $5.86 | $5.64 | $5.33 | · | $5.21 | $5.07 | $4.61 | · | $4.69 | $4.73 | $4.47 | · | $4.25 | |
| Cash Flow / Share | · | $0.97 | · | · | · | $1.46 | · | · | · | $1.01 | · | · | · | $1.06 | · | · | |
| Cash / Share | $1.71 | $1.97 | · | $3.72 | $3.10 | $3.43 | · | $3.93 | $3.73 | $4.33 | · | $4.42 | $3.90 | $4.15 | · | $4.70 | |
| EPS (TTM) | $2.08 | $2.18 | · | $2.22 | $2.17 | $2.04 | · | $1.67 | $1.90 | $1.57 | · | $1.25 | $0.59 | $0.49 | · | $0.53 |
Valuation (TTM)
| Metric | Trend | Q2 2026 | Q1 2026 | Q4 2025 | Q3 2025 | Q2 2025 | Q1 2025 | Q4 2024 | Q3 2024 | Q2 2024 | Q1 2024 | Q4 2023 | Q3 2023 | Q2 2023 | Q1 2023 | Q4 2022 | Q3 2022 |
|---|---|---|---|---|---|---|---|---|---|---|---|---|---|---|---|---|---|
| Revenue TTM | $1.47B | $1.47B | · | $1.47B | $1.45B | $1.44B | · | $1.39B | $1.38B | $1.36B | · | $1.30B | $1.27B | $1.23B | · | $1.16B | |
| Net Income TTM | $127M | $139M | · | $150M | $149M | $143M | · | $118M | $138M | $115M | · | $92M | $43M | $36M | · | $39M | |
| Market Cap | $1.35B | $1.38B | · | $1.94B | $2.19B | $2.40B | · | $2.34B | $2.50B | $2.69B | · | $2.87B | $2.52B | $2.14B | · | $2.39B | |
| P/E | 11.8 | 11.3 | · | 14.1 | 15.8 | 18.2 | · | 21.0 | 19.4 | 25.1 | · | 33.3 | 61.7 | 62.7 | · | 64.0 | |
| P/S | 0.9 | 0.9 | · | 1.3 | 1.5 | 1.7 | · | 1.7 | 1.8 | 2.0 | · | 2.2 | 2.0 | 1.7 | · | 2.1 | |
| P/B | 2.1 | 2.2 | · | 2.6 | 2.9 | 3.3 | · | 3.2 | 3.4 | 3.7 | · | 3.9 | 3.6 | 3.0 | · | 3.4 | |
| P / Tangible Book | 6.8 | 7.8 | · | 3.6 | 3.9 | 4.5 | · | 3.7 | 4.0 | 4.4 | · | 4.6 | 4.2 | 3.6 | · | 4.0 | |
| P / Cash Flow | · | 23.9 | · | · | · | 24.5 | · | · | · | 37.0 | · | · | · | 28.8 | · | · | |
| Earnings Yield | 8.5% | 8.8% | · | 7.1% | 6.3% | 5.5% | · | 4.8% | 5.1% | 4.0% | · | 3.0% | 1.6% | 1.6% | · | 1.6% |
Most recent period on the left · null values shown as ·
Financial Statements Income statement, balance sheet, cash flow — annual, last 5 years
| Metric | 2025-12-31 | 2024-12-31 | 2023-12-31 | 2022-12-31 | 2021-12-31 |
|---|---|---|---|---|---|
| Revenue | $1.46B | $1.41B | $1.34B | $1.19B | $1.03B |
| Operating Margin % | 12.6% | 10.7% | 5.9% | 4.9% | 3.0% |
| Net Income | $146M | $133M | $99M | $36M | $40M |
| Diluted EPS | $2.24 | $1.88 | $1.35 | $0.50 | $0.50 |
| Metric | 2025-12-31 | 2024-12-31 | 2023-12-31 | 2022-12-31 | 2021-12-31 |
|---|---|---|---|---|---|
| Current Ratio | 3.0 | 3.3 | 3.5 | 3.3 | 3.9 |
| Quick Ratio | 2.7 | 3.1 | 3.3 | 2.9 | 3.6 |
| Metric | 2025-12-31 | 2024-12-31 | 2023-12-31 | 2022-12-31 | 2021-12-31 |
|---|---|---|---|---|---|
| Free Cash Flow | $324M | $248M | $279M | $160M | $184M |
Institutional owners (13F) 322 filers · $1.6B total · As of Sept. 30, 2026
Institutions that report holding this stock in their quarterly SEC Form 13F. Long positions only; a single filer may appear twice for separate option legs. Large offsetting put/call legs typically reflect market-making or hedged inventory, not directional conviction.
| New positions | Exited positions | Increased | Decreased | Net shares change |
|---|---|---|---|---|
| 43 (-26 vs prior Q) | 53 (-7 vs prior Q) | 92 (-30 vs prior Q) | 126 (+34 vs prior Q) | -993K |
Compared to Q1 2026. SEC Form 13F filings are due within 45 days of quarter-end plus a short buffer for late filers — quarters still inside that window are skipped in favor of the most recent fully-reported pair.
| Institution | Value | Shares | % of tracked 13F | Type |
|---|---|---|---|---|
| VANGUARD GROUP INC | $250,294,288 | 8,236,074 | 15.77% | Shares |
| BlackRock, Inc. | $236,848,932 | 9,659,418 | 14.92% | Shares |
| VANGUARD PORTFOLIO MANAGEMENT LLC | $102,120,160 | 4,164,770 | 6.43% | Shares |
| DIMENSIONAL FUND ADVISORS LP | $76,948,270 | 3,138,146 | 4.85% | Shares |
| VANGUARD CAPITAL MANAGEMENT LLC | $57,939,951 | 2,362,967 | 3.65% | Shares |
| STATE STREET CORP | $55,526,423 | 2,264,536 | 3.50% | Shares |
| AMERICAN CENTURY COMPANIES INC | $45,554,237 | 1,857,840 | 2.87% | Shares |
| GEODE CAPITAL MANAGEMENT, LLC | $45,361,503 | 1,849,722 | 2.86% | Shares |
| Allianz Asset Management GmbH | $36,966,327 | 1,507,599 | 2.33% | Shares |
| FMR LLC | $30,814,203 | 1,256,697 | 1.94% | Shares |
| MORGAN STANLEY | $30,698,354 | 1,251,971 | 1.93% | Shares |
| JUPITER ASSET MANAGEMENT LTD | $29,282,961 | 1,194,248 | 1.84% | Shares |
| CHARLES SCHWAB INVESTMENT MANAGEMENT INC | $25,571,957 | 1,042,902 | 1.61% | Shares |
| GOLDMAN SACHS GROUP INC | $24,308,577 | 991,378 | 1.53% | Shares |
| Optimus Prime Fund Management Co., Ltd. | $20,842,000 | 850,000 | 1.31% | Shares |
| RENAISSANCE TECHNOLOGIES LLC | $20,700,618 | 844,234 | 1.30% | Shares |
| MILLENNIUM MANAGEMENT LLC | $20,442,422 | 833,704 | 1.29% | Shares |
| Man Group plc | $19,991,426 | 815,311 | 1.26% | Shares |
| Robeco Institutional Asset Management B.V. | $19,328,454 | 788,273 | 1.22% | Shares |
| BANK OF AMERICA CORP /DE/ | $16,479,426 | 672,081 | 1.04% | Shares |
| NORTHERN TRUST CORP | $15,479,794 | 631,313 | 0.98% | Shares |
| UBS Group AG | $15,182,416 | 619,185 | 0.96% | Shares |
| VICTORY CAPITAL MANAGEMENT INC | $13,924,589 | 567,887 | 0.88% | Shares |
| PRINCIPAL FINANCIAL GROUP INC | $12,693,612 | 517,684 | 0.80% | Shares |
| ROYAL BANK OF CANADA | $10,827,000 | 441,582 | 0.68% | Shares |
| AQR CAPITAL MANAGEMENT LLC | $10,573,088 | 431,203 | 0.67% | Shares |
| Nuveen, LLC | $10,205,739 | 416,221 | 0.64% | Shares |
| Cambria Investment Management, L.P. | $9,848,605 | 401,656 | 0.62% | Shares |
| Empowered Funds, LLC | $9,730,075 | 396,822 | 0.61% | Shares |
| Bank of New York Mellon Corp | $9,277,804 | 378,377 | 0.58% | Shares |
| VANGUARD FIDUCIARY TRUST CO | $8,751,360 | 356,907 | 0.55% | Shares |
| BRIDGEWAY CAPITAL MANAGEMENT, LLC | $8,476,564 | 345,700 | 0.53% | Shares |
| Creative Planning | $7,922,824 | 323,117 | 0.50% | Shares |
| Invesco Ltd. | $6,915,621 | 282,040 | 0.44% | Shares |
| Quinn Opportunity Partners LLC | $6,676,771 | 272,299 | 0.42% | Shares |
| Balyasny Asset Management L.P. | $6,402,098 | 261,097 | 0.40% | Shares |
| CITADEL ADVISORS LLC | $6,362,376 | 259,477 | 0.40% | Shares |
| WELLS FARGO & COMPANY/MN | $6,264,002 | 255,465 | 0.39% | Shares |
| JANE STREET GROUP, LLC | $6,115,288 | 249,400 | 0.39% | Call option |
| BNP PARIBAS FINANCIAL MARKETS | $5,996,072 | 244,538 | 0.38% | Shares |
| Edgestream Partners, L.P. | $5,979,325 | 243,855 | 0.38% | Shares |
| Public Sector Pension Investment Board | $5,722,281 | 233,372 | 0.36% | Shares |
| MARSHALL WACE, LLP | $5,664,587 | 231,019 | 0.36% | Shares |
| SEI INVESTMENTS CO | $5,418,994 | 221,002 | 0.34% | Shares |
| Quantedge Capital Pte Ltd | $5,141,844 | 209,700 | 0.32% | Shares |
| FIRST TRUST ADVISORS LP | $5,015,737 | 204,557 | 0.32% | Shares |
| Point72 Asset Management, L.P. | $4,975,402 | 202,912 | 0.31% | Shares |
| Universal- Beteiligungs- und Servicegesellschaft mbH | $4,967,138 | 202,575 | 0.31% | Shares |
| JACOBS LEVY EQUITY MANAGEMENT, INC | $4,860,624 | 198,231 | 0.31% | Shares |
| SEB Asset Management AB | $4,841,073 | 197,434 | 0.30% | Shares |
Company insiders 36 insiders · 17 officers · 15 directors
| Insider | Role | Last activity | Shares owned | Buys 12m | Sells 12m | Net 12m |
|---|---|---|---|---|---|---|
| Jeremy Stoppelman | Chief Executive Officer | Aug. 20, 2026 F | 918,455 | 0 | 14 | $-10,127,041 |
| David A Schwarzbach | Chief Financial Officer | Aug. 21, 2026 S | 180,466 | 0 | 7 | $-1,869,314 |
| James Miln | Interim CFO | Feb. 3, 2020 S | 36,690 | 0 | 0 | $0 |
| Charles Baker | Chief Financial Officer | Aug. 20, 2019 F | 121,627 | 0 | 0 | $0 |
| Robert J Krolik | Chief Financial Officer | Feb. 23, 2016 S | 35,863 | 0 | 0 | $0 |
| Joseph R Nachman | Chief Operating Officer | Aug. 20, 2026 F | 250,993 | 0 | 9 | $-1,982,588 |
| Carmen Amara | Chief People Officer | Sept. 1, 2026 S | 100,536 | 0 | 10 | $-862,386 |
| Alexander Coleman Levy | Chief Technology Officer | Aug. 24, 2026 S | 54,124 | 0 | 1 | $-89,599 |
| Craig Saldanha | Chief Product Officer | May 20, 2026 F | 260,895 | 0 | 7 | $-232,920 |
| Sam Eaton | Chief Technology Officer | May 20, 2026 F | 208,882 | 0 | 1 | $-5,626 |
| YELP INC | Chief Technology Officer | Nov. 20, 2022 F | 186,273 | 0 | 0 | $0 |
| Miriam Warren | Chief Diversity Officer | March 10, 2022 A | 40,209 | 0 | 0 | $0 |
| Vivek Patel | Chief Product Officer | Nov. 23, 2021 S | 98,387 | 0 | 0 | $0 |
| Laurence Wilson | Chief Administrative Officer | Nov. 22, 2021 F | 160,049 | 0 | 0 | $0 |
| Carolyn Patterson | Chief People Officer | May 28, 2021 M | 69,785 | 0 | 0 | $0 |
| Alan Ramsay | Chief Accounting Officer | May 20, 2019 F | 28,966 | 0 | 0 | $0 |
| Michael Stoppelman | Sr VP, Engineering | Feb. 21, 2017 M | 117,647 | 0 | 0 | $0 |
| Dan Jedda | Director | June 5, 2026 A | 27,746 | 0 | 1 | $-30,773 |
| Christine Barone | Director | June 5, 2026 A | 26,574 | 0 | 2 | $-805,886 |
| Sharon Rothstein | Director | June 5, 2026 A | 53,071 | 0 | 0 | $0 |
| Logan Green | Director | June 5, 2026 A | 23,777 | 0 | 0 | $0 |
| Royce A. Wells | Director | June 5, 2026 A | 45,833 | 0 | 0 | $0 |
| Robert Lane Gibbs | Director | June 5, 2026 A | 64,749 | 0 | 0 | $0 |
| Diane M Irvine | Director | June 5, 2026 A | 101,803 | 0 | 0 | $0 |
| Fred D Anderson | Director | June 5, 2026 A | 64,164 | 0 | 0 | $0 |
| Brian Sharples | Director | June 3, 2021 A | 18,193 | 0 | 0 | $0 |
| Mariam Naficy | Director | March 1, 2019 A | 1,136 | 0 | 0 | $0 |
| Geoffrey L Donaker | Director | Feb. 26, 2019 S | 341,940 | 0 | 0 | $0 |
| Jeremy S. Levine | Director | March 1, 2018 A | 100,887 | 0 | 0 | $0 |
| Peter H. Fenton | Director | March 1, 2018 A | 2,970 | 0 | 0 | $0 |
| Keith Rabois | Director | June 28, 2013 A | 0 | 0 | 0 | $0 |
| Max R Levchin | 10% owner | Sept. 22, 2016 C | 2,691,757 | 0 | 0 | $0 |
| Bruce W. Dunlevie | 10% owner | March 15, 2013 G | 0 | 0 | 0 | $0 |
| Mitchell H. Lasky | 10% owner | Feb. 28, 2013 S | 0 | 0 | 0 | $0 |
| Chris Terrill | · | June 13, 2024 A | 24,329 | 0 | 0 | $0 |
| George Hu | · | June 9, 2023 A | 30,974 | 0 | 0 | $0 |
Insiders from SEC Form 3/4/5 filings; net = open-market P/S only
ETF ownership Held by 71 ETFs
Weight reflects direct equity holdings (N-PORT) only; leveraged or derivative-based funds may hold additional swap exposure not shown.
| Fund | Weight | Units | As of | Source |
|---|---|---|---|---|
| RNIN · EA Series Trust | 1.28% | 88,336 NS | July 31, 2026 | N-PORT |
| SYLD · Cambria ETF Trust | 1.08% | 405,044 NS | July 31, 2026 | N-PORT |
| PSCU · Invesco Exchange-Traded Fund Trust … | 0.98% | 7,626 SH | Oct. 1, 2026 | Daily |
| SCOW · Pacer Funds Trust | 0.76% | 492 NS | July 31, 2026 | N-PORT |
| SOCL · Global X Funds | 0.67% | 23,174 NS | July 31, 2026 | N-PORT |
| ROSC · Lattice Strategies Trust | 0.66% | 15,247 NS | July 31, 2026 | N-PORT |
| CAFG · Pacer Funds Trust | 0.56% | 6,384 NS | July 31, 2026 | N-PORT |
| FYT · First Trust Exchange-Traded AlphaDE… | 0.53% | 38,989 NS | July 31, 2026 | N-PORT |
| VFMV · VANGUARD WELLINGTON FUND | 0.42% | 70,978 SH | Aug. 19, 2026 | Daily |
| FYX · First Trust Exchange-Traded AlphaDE… | 0.34% | 177,883 NS | July 31, 2026 | N-PORT |
| EBIT · Harbor ETF Trust | 0.33% | 1,504 NS | July 31, 2026 | N-PORT |
| CALF · Pacer Funds Trust | 0.31% | 427,310 NS | July 31, 2026 | N-PORT |
| XSHQ · Invesco Exchange-Traded Fund Trust … | 0.29% | 44,911 SH | Oct. 1, 2026 | Daily |
| JPSE · J.P. Morgan Exchange-Traded Fund Tr… | 0.15% | 34,119 NS | July 31, 2026 | N-PORT |
| LSVD · ADVISORS' INNER CIRCLE FUND | 0.15% | 37,041 NS | July 31, 2026 | N-PORT |
| FSMD · FIDELITY COVINGTON TRUST | 0.13% | 118,644 NS | July 31, 2026 | N-PORT |
| VFMF · VANGUARD WELLINGTON FUND | 0.12% | 33,832 SH | Aug. 19, 2026 | Daily |
| FAB · First Trust Exchange-Traded AlphaDE… | 0.11% | 6,743 NS | July 31, 2026 | N-PORT |
| DFSV · Dimensional ETF Trust | 0.10% | 296,244 NS | July 31, 2026 | N-PORT |
| RWJ · Invesco Exchange-Traded Fund Trust … | 0.09% | 91,126 SH | Oct. 1, 2026 | Daily |
| FCOM · FIDELITY COVINGTON TRUST | 0.08% | 54,601 NS | July 31, 2026 | N-PORT |
| VIOG · VANGUARD ADMIRAL FUNDS | 0.08% | 36,066 SH | Aug. 19, 2026 | Daily |
| VOX · VANGUARD WORLD FUND | 0.08% | 184,416 SH | Aug. 19, 2026 | Daily |
| DFAT · Dimensional ETF Trust | 0.07% | 388,457 NS | July 31, 2026 | N-PORT |
| VIOO · VANGUARD ADMIRAL FUNDS | 0.07% | 182,155 SH | Aug. 19, 2026 | Daily |
| QVMS · Invesco Exchange-Traded Fund Trust … | 0.07% | 8,608 SH | Oct. 1, 2026 | Daily |
| OMFS · Invesco Exchange-Traded Self-Indexe… | 0.07% | 9,352 SH | Oct. 1, 2026 | Daily |
| VIOV · VANGUARD ADMIRAL FUNDS | 0.06% | 46,558 SH | Aug. 19, 2026 | Daily |
| ESML · iShares Trust | 0.06% | 74,247 SH | Sept. 11, 2026 | Daily |
| BBSC · J.P. Morgan Exchange-Traded Fund Tr… | 0.05% | 13,961 NS | July 31, 2026 | N-PORT |
| VTWV · VANGUARD SCOTTSDALE FUNDS | 0.05% | 28,285 SH | Aug. 19, 2026 | Daily |
| RSSL · Global X Funds | 0.05% | 25,651 NS | July 31, 2026 | N-PORT |
| VTWO · VANGUARD SCOTTSDALE FUNDS | 0.04% | 309,142 SH | Aug. 19, 2026 | Daily |
| IWM · iShares Trust | 0.04% | 1,363,423 SH | Sept. 11, 2026 | Daily |
| DFAS · Dimensional ETF Trust | 0.04% | 207,255 NS | July 31, 2026 | N-PORT |
| VBK · VANGUARD INDEX FUNDS | 0.03% | 687,236 SH | Aug. 19, 2026 | Daily |
| VTWG · VANGUARD SCOTTSDALE FUNDS | 0.03% | 22,634 SH | Aug. 19, 2026 | Daily |
| RILA · Spinnaker ETF Series | 0.03% | 544 NS | July 31, 2026 | N-PORT |
| IWO · iShares Trust | 0.03% | 197,628 SH | Sept. 11, 2026 | Daily |
| PNQI · Invesco Exchange-Traded Fund Trust | 0.03% | 8,248 SH | Oct. 1, 2026 | Daily |
| PKW · Invesco Exchange-Traded Fund Trust | 0.03% | 24,936 SH | Oct. 1, 2026 | Daily |
| DXUV · Dimensional ETF Trust | 0.02% | 4,396 NS | July 31, 2026 | N-PORT |
| VB · VANGUARD INDEX FUNDS | 0.02% | 1,197,408 SH | Aug. 19, 2026 | Daily |
| ISCG · iShares Trust | 0.01% | 6,423 SH | Sept. 11, 2026 | Daily |
| VXF · VANGUARD INDEX FUNDS | 0.01% | 600,077 SH | Aug. 19, 2026 | Daily |
| PRF · Invesco Exchange-Traded Fund Trust | 0.01% | 46,933 SH | Oct. 1, 2026 | Daily |
| DFUV · Dimensional ETF Trust | 0.01% | 49,934 NS | July 31, 2026 | N-PORT |
| WSML · iShares Trust | 0.01% | 2,372 SH | Sept. 11, 2026 | Daily |
| DFAC · Dimensional ETF Trust | 0.01% | 121,410 NS | July 31, 2026 | N-PORT |
| DCOR · Dimensional ETF Trust | 0.01% | 6,366 NS | July 31, 2026 | N-PORT |
| IGM · iShares Trust | 0.00% | 24,553 SH | Sept. 11, 2026 | Daily |
| DFSU · Dimensional ETF Trust | 0.00% | 2,411 NS | July 31, 2026 | N-PORT |
| IWV · iShares Trust | 0.00% | 19,303 SH | Sept. 8, 2026 | Daily |
| ITOT · iShares Trust | 0.00% | 79,282 SH | Sept. 11, 2026 | Daily |
| DFAU · Dimensional ETF Trust | 0.00% | 7,943 NS | July 31, 2026 | N-PORT |
| DFUS · Dimensional ETF Trust | 0.00% | 5,529 NS | July 31, 2026 | N-PORT |
| TILT · FlexShares Trust | 0.00% | 316 NS | July 31, 2026 | N-PORT |
| VTI · VANGUARD INDEX FUNDS | 0.00% | 1,662,874 SH | Aug. 19, 2026 | Daily |
| VT · VANGUARD INTERNATIONAL EQUITY INDEX… | 0.00% | 43,355 SH | Aug. 19, 2026 | Daily |
| VTHR · VANGUARD SCOTTSDALE FUNDS | 0.00% | 4,702 SH | Aug. 19, 2026 | Daily |
| ESGV · VANGUARD WORLD FUND | 0.00% | 11,866 SH | Aug. 19, 2026 | Daily |
| IJR · iShares Trust | · | 3,184,620 SH | Sept. 10, 2026 | Daily |
| IJT · iShares Trust | · | 287,481 SH | Sept. 9, 2026 | Daily |
| IJS · iShares Trust | · | 196,944 SH | Sept. 8, 2026 | Daily |
| IWN · iShares Trust | · | 304,919 SH | Sept. 11, 2026 | Daily |
| XJR · iShares Trust | · | 7,248 SH | Aug. 31, 2026 | Daily |
| SVAL · iShares Trust | · | 22,000 SH | Sept. 3, 2026 | Daily |
| ISCB · iShares Trust | · | 2,274 SH | Sept. 11, 2026 | Daily |
| ISCV · iShares Trust | · | 7,017 SH | Sept. 11, 2026 | Daily |
| SMLF · iShares Trust | · | 47,681 SH | Sept. 11, 2026 | Daily |
| SMMV · iShares Trust | · | 21,611 SH | Sept. 1, 2026 | Daily |
YELP Analyst Consensus Bullish and bearish analyst opinions, 12-month price target, upside
12-Month Price Target
8 analysts · 2026-09-27Mean target $25.12 +37.6%
Peer comparison (GICS sub-industry) Key metrics vs sector peers
FY basis, prices as of each company's last fiscal year-end close.
| Ticker | Market Cap | P/E | Rev YoY | Net Margin | ROE | Gross Margin |
|---|---|---|---|---|---|---|
| YELP | $1.82B | 13.6 | 3.8% | 9.9% | 20.0% | · |
| PPLI | · | · | · | · | · | · |
| CARG | · | 24.7 | 13.7% | 17.2% | 38.5% | 92.8% |
| DJT | · | -4.7 | · | · | · | · |
| GRND | $2.51B | 31.5 | 27.6% | 21.5% | 80.7% | · |
| ZD | $1.35B | 30.6 | 3.5% | 3.3% | 2.6% | · |
| WBTN | $1.70B | -4.9 | 2.5% | -25.0% | -26.2% | · |
| GTM | $3.13B | 26.8 | 2.9% | 9.9% | 8.1% | 84.0% |
| TRIP | $1.67B | 47.0 | 3.0% | 2.1% | 6.3% | · |
| FUBO | $5.13B | -28.0 | 18.6% | -10.6% | -31.6% | · |
| NXDR | · | -15.0 | 4.2% | -21.0% | -12.6% | · |
My Metrics Your personal watchlist — selected rows from Full Fundamentals
Pick the metrics that matter to you — click the + next to any row in Full Fundamentals above.
Your selection is saved and follows you across all tickers.