
ALB Albemarle Corporation Common Stock
NYSE · Chemicals · Auf SEC EDGAR ansehen ↗ 10-K/10-Q Aug 5, 2026ALB Aktien-Snapshot Kurs, Marktkapitalisierung, P/E, EPS, ROE, Schulden/Eigenkapital, 52-Wochen-Spanne
ALB Aktienkurs-Chart Täglich OHLCV mit technischen Indikatoren — Schwenken, Zoom und Ansicht anpassen
Die Balkengranularität passt sich der ausgewählten Periode an – bewegen Sie den Mauszeiger über das Diagramm, um Eröffnungs-/Höchst-/Tiefst-/Schlusskurse für einen Balken anzuzeigen.
| Ex-Datum | Split | Typ |
|---|---|---|
| 2. März 2007 | 2-for-1 | Vorwärts |
Über Albemarle Corporation Common Stock Unternehmensübersicht von Wikipedia
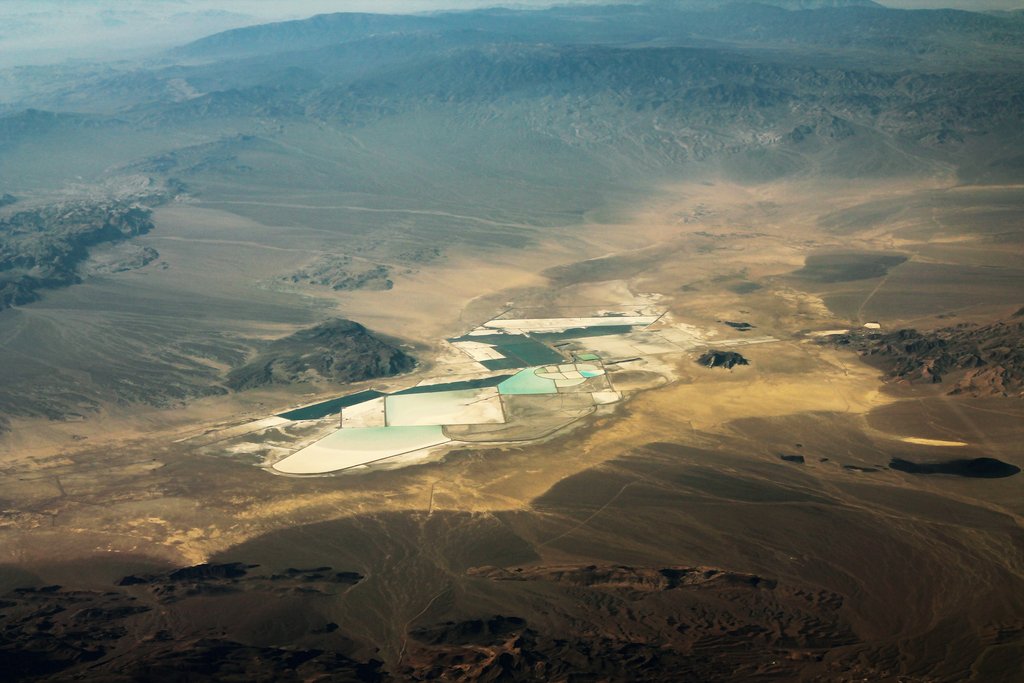
Die Albemarle Corporation ist ein US-amerikanischer Spezialchemiekonzern mit Sitz in Charlotte, North Carolina und einer der weltweit größten Produzenten von Lithium und Lithiumverbindungen.
Geschichte
1887 wurde die Albemarle Paper Manufacturing Company gegründet. Durch die im Jahr 1962 mit Fremdkapital finanzierte Übernahme der wesentlich größeren Ethyl Corporation wurde Albemarle ein Chemiekonzern. Dieser benannte sich um in Ethyl Corporation; nach seinem Hauptprodukt, dem Antiklopfmittel Tetraethylblei. 1976 wurden die Aktivitäten im Bereich der Papierherstellung verkauft. 1987 wurde das Brom-Geschäft von Dow Chemical übernommen. Seit 1994 heißt der Konzern wieder Albemarle.
Im Januar 2015 wurde die Übernahme von Rockwood Holdings abgeschlossen. Dadurch kamen die Standorte in Langelsheim (Niedersachsen) und Frankfurt am Main zur Albemarle. Das Werk in Langelsheim geht auf die Hans-Heinrich-Hütte zurück und gehörte mehrere Jahrzehnte zur Metallgesellschaft.
Im Jahr 2016 verkaufte Albemarle Chemetall für rund 3,2 Milliarden Dollar (2,8 Milliarden Euro) an die BASF.
Geschäftsbereiche
Die Albemarle Corporation ist in die drei Geschäftsbereiche Lithium, Bromine Specialties und Catalysts aufgeteilt. Der Bereich Lithium verfügt über eigene Minen zur Förderung von Lithiumsalzen. Es werden beispielsweise Lithiumcarbonat und Lithiumhydroxid als Grundstoffe und für Lithium-Ionen-Akkus hergestellt. Weitere Batterieprodukte sind Lithiumsulfid und Lithiumbis(oxalato)borat. Daneben werden lithiumorganische Verbindungen wie Butyllithium hergestellt. Zudem werden verschiedene weitere Salze, Metalle und Metallhydride produziert.
Im Bereich Bromine Specialties werden unter anderem elementares Brom und Bromwasserstoffsäure produziert sowie Bromide und bromhaltige Flammschutzmittel. Der Geschäftsbereich Catalysts stellt Katalysatoren für Raffinerien her, unter anderem FFC-Katalysatoren.
Quelle: Wikipedia, CC BY-SA 4.0 · Auf Wikipedia ansehen ↗
10-Jahres-Performance Umsatz-, Nettoergebnis-, Margen- und EPS-Trends
Bewertung P/E-, P/S-, P/B-, EV/EBITDA-Verhältnisse — ist die Aktie teuer oder günstig?
| Kennzahl | 5-Jahres-Trend | ALB | 5-Jahres-Durchschnitt | Peer-Median | Fazit |
|---|---|---|---|---|---|
| P/E (TTM) | 359.35-Jahres-Durchschnitt ≈41.7 | ≈41.7 | 34.6 | Überbewertet | |
| P/S (TTM) | 1.9 | · | 2.7 | Überbewertet | |
| K/B (MRQ) | 1.1 | · | 3.8 | Unterbewertet | |
| Kurs / FCF (TTM) | 8.2 | · | · | · | |
| Kurs / Cashflow (TTM) | 6.1 | · | 15.1 | Unterbewertet | |
| Kurs / Materieller Buchwert (MRQ) | 1.15-Jahres-Durchschnitt ≈3.4 | ≈3.4 | · | · |
Der Median der Vergleichsgruppe wird pro Kennzahl standardisiert berechnet und stimmt möglicherweise nicht immer mit der für diese Aktie angezeigten TTM/MRQ-Basis überein.
Rentabilität Brutto-, Betriebs- und Nettomargen; ROE, ROA, ROIC
| Kennzahl | 5-Jahres-Trend | ALB | 5-Jahres-Durchschnitt | Peer-Median | Fazit |
|---|---|---|---|---|---|
| Bruttogewinnmarge (TTM) | 23.8% | · | 34.2% | Schwach | |
| Betriebsgewinnmarge (TTM) | 4.3% | · | 17.2% | Spitzenklasse | |
| EBITDA-Marge (TTM) | 15.1% | · | 14.1% | Spitzenklasse | |
| Vorgewinnmarge (TTM) | 2.9% | · | 14.9% | Spitzenklasse | |
| Nettogewinnmarge (TTM) | 3.8% | · | 10.6% | Spitzenklasse | |
| ROA (TTM) | 1.4% | · | 5.7% | Schwach | |
| ROE (TTM) | 2.2% | · | 14.7% | Schwach |
Finanzielle Gesundheit Verschuldung, Liquidität, Solvenz — Bilanzstärke
| Kennzahl | 5-Jahres-Trend | ALB | 5-Jahres-Durchschnitt | Peer-Median | Fazit |
|---|---|---|---|---|---|
| Fremdkapital / Eigenkapital (MRQ) | 0.2 | · | 0.4 | Geringe Verschuldung | |
| Liquiditätsgrad (MRQ) | 2.1 | · | 2.0 | Im Einklang | |
| Langfristige Schulden / Eigenkapital (MRQ) | 0.2 | · | 0.6 | Geringe Verschuldung |
Wachstum Umsatz-, EPS- und Nettoergebniswachstum: YoY, 3-Jahres-CAGR, 5-Jahres-CAGR
| Kennzahl | 5-Jahres-Trend | ALB | 5-Jahres-Durchschnitt | Peer-Median | Fazit |
|---|---|---|---|---|---|
| Revenue YoY (Umsatz YoY) | -4.4%5-Jahres-Durchschnitt ≈21.9% | ≈21.9% | · | · | |
| Revenue CAGR 3Y (Umsatz CAGR 3J) | -11.1%5-Jahres-Durchschnitt ≈17.2% | ≈17.2% | · | · | |
| Revenue CAGR 5Y (Umsatz CAGR 5J) | 10.4% | · | · | · | |
| EPS YoY (EPS VjV) | -41.5%5-Jahres-Durchschnitt ≈647.8% | ≈647.8% | · | · | |
| Net Income YoY (Nettogewinn YoY) | -41.5%5-Jahres-Durchschnitt ≈655.5% | ≈655.5% | · | · | |
| EPS CAGR 3Y (EPS CAGR 3J) | 56.0% | · | · | · | |
| Net Income CAGR 3Y (Nettoergebnis CAGR 3J) | 61.2% | · | · | · |
Kapitaleffizienz Umsatz pro Vermögenswert, Lagerumschlag, Forderungsumschlag
| Kennzahl | 5-Jahres-Trend | ALB | 5-Jahres-Durchschnitt | Peer-Median | Fazit |
|---|---|---|---|---|---|
| Revenue / Employee (Umsatz / Mitarbeiter) | ≈$659.3K | · | · | · |
Wert · ≈ 5-Jahres-Durchschnitt · Branchenmedian · Urteil relativ zum Median
Dividenden Rendite, Ausschüttungsquote, Dividendenhistorie, 5-Jahres-CAGR
| Ex-Datum | Betrag | Währung | Rendite |
|---|---|---|---|
| Sep 11, 2026 | $0,41 | USD | ≈1.4% |
| Jun 12, 2026 | $0,41 | USD | ≈0.95% |
| Mär 13, 2026 | $0,41 | USD | ≈1.0% |
| Dez 12, 2025 | $0,41 | USD | ≈1.2% |
| Sep 12, 2025 | $0,41 | USD | ≈2.1% |
| Jun 13, 2025 | $0,41 | USD | ≈2.7% |
| Mär 14, 2025 | $0,41 | USD | ≈2.1% |
| Dez 13, 2024 | $0,41 | USD | ≈1.6% |
| Sep 13, 2024 | $0,41 | USD | ≈1.8% |
| Jun 14, 2024 | $0,40 | USD | ≈1.5% |
| Mär 14, 2024 | $0,40 | USD | ≈1.3% |
| Dez 14, 2023 | $0,40 | USD | ≈1.1% |
| Sep 14, 2023 | $0,40 | USD | ≈0.86% |
| Jun 15, 2023 | $0,40 | USD | ≈0.69% |
| Mär 16, 2023 | $0,40 | USD | ≈0.74% |
| Dez 15, 2022 | $0,40 | USD | ≈0.66% |
| Sep 15, 2022 | $0,40 | USD | ≈0.55% |
| Jun 9, 2022 | $0,40 | USD | ≈0.65% |
| Mär 17, 2022 | $0,40 | USD | ≈0.80% |
| Dez 16, 2021 | $0,39 | USD | ≈0.68% |
Ergebnisverlauf EPS Ist vs. Schätzung, Überraschung %, Beat-Rate, nächstes Ergebnisdatum
| Zeitraum | Bericht | EPS Actual | EPS est. | Überraschung |
|---|---|---|---|---|
| 30. Juni 2026 | Jul 28, 2026 | $3.75 | $3.27 | 14.7% |
| 31. März 2026 | $2.95 | $1.11 | 166.8% | |
| 31. Dezember 2025 | $-0.53 | $-0.41 | -28.5% | |
| 30. September 2025 | $-0.19 | $-0.79 | 75.9% | |
| 30. Juni 2025 | $0.11 | $-0.83 | 113.2% | |
| 31. März 2025 | $-0.18 | $-0.59 | 69.7% |
Vollständige Fundamentaldaten Alle Kennzahlen nach Jahr — Gewinn- und Verlustrechnung, Bilanz, Cashflow
Gewinn- und Verlustrechnung
| Kennzahl | Trend | 2025 | 2024 | 2023 | 2022 | 2021 | 2020 | 2019 | 2018 | 2017 | 2016 | 2015 | 2014 |
|---|---|---|---|---|---|---|---|---|---|---|---|---|---|
| Revenue | $5.14B | $5.38B | $9.62B | $7.32B | $3.33B | $3.13B | $3.59B | $3.37B | $3.07B | $2.68B | $2.83B | $2.45B | |
| Cost of Revenue | $4.47B | $5.31B | $8.43B | $4.25B | $2.33B | $2.13B | $2.33B | $2.16B | $1.97B | $1.71B | $1.97B | $1.67B | |
| Gross Profit | $669M | $63M | $1.19B | $3.07B | $998M | $995M | $1.26B | $1.22B | $1.11B | $970M | $860M | $771M | |
| R&D Expense | $51M | $87M | $86M | $72M | $54M | $59M | $58M | $70M | $84M | $80M | $89M | $88M | |
| SG&A Expense | $550M | $618M | $910M | $524M | $441M | $430M | $533M | $446M | $450M | $354M | $300M | $355M | |
| Operating Income | $-367M | $-1.78B | $252M | $2.47B | $798M | $506M | $666M | $912M | $572M | $601M | $345M | $271M | |
| Other Non-op | $23M | $178M | $111M | $86M | $-603M | $-59M | $-45M | $-64M | $-10M | $-21M | $47M | $-17M | |
| Pretax Income | $-552M | $-1.76B | $247M | $2.43B | $134M | $374M | $563M | $795M | $447M | $515M | $311M | $213M | |
| Income Tax | $157M | $87M | $430M | $391M | $29M | $54M | $88M | $145M | $432M | $96M | $11M | $18M | |
| Net Income | $-511M | $-1.18B | $1.57B | $2.69B | $124M | $376M | $533M | $694M | $55M | $644M | $335M | $133M | |
| EPS (Basic) | $-5.76 | $-11.20 | $13.41 | $22.97 | $1.07 | $3.53 | $5.03 | $6.40 | $0.49 | $5.73 | $3.01 | $1.69 | |
| EPS (Diluted) | $-5.76 | $-11.20 | $13.36 | $22.84 | $1.06 | $3.52 | $5.02 | $6.34 | $0.49 | $5.68 | $3.00 | $1.69 | |
| Shares (Basic) | 117,664,000 | 117,516,000 | 117,317,000 | 117,120,000 | 115,841,000 | 106,402,000 | 105,949,000 | 108,427,000 | 110,914,000 | 112,379,000 | 111,182,000 | 78,696,000 | |
| Shares (Diluted) | 117,664,000 | 117,516,000 | 117,766,000 | 117,793,000 | 116,536,000 | 106,808,000 | 106,321,000 | 109,458,000 | 112,380,000 | 113,239,000 | 111,556,000 | 79,102,000 | |
| EBITDA | · | · | · | · | · | $738M | · | $1.11B | $785M | $801M | $703M | $271M |
Bilanz
| Kennzahl | Trend | 2025 | 2024 | 2023 | 2022 | 2021 | 2020 | 2019 | 2018 | 2017 | 2016 | 2015 | 2014 |
|---|---|---|---|---|---|---|---|---|---|---|---|---|---|
| Cash & Equivalents | $1.62B | $1.19B | $890M | $1.50B | $439M | $747M | $613M | $555M | $1.14B | $2.27B | $214M | $2.49B | |
| Receivables | $594M | $742M | $1.21B | $1.19B | $557M | $531M | $613M | $606M | $534M | $486M | $398M | $385M | |
| Inventory | $1.18B | $1.50B | $2.16B | $2.08B | $799M | $750M | $769M | $701M | $593M | $450M | $440M | $358M | |
| Prepaid Expense | $56M | $77M | $116M | $59M | $37M | $58M | $84M | $43M | $86M | $42M | $39M | $41M | |
| Other Current Assets | $140M | $167M | $443M | $235M | $133M | $116M | $163M | $85M | $136M | $59M | $63M | $66M | |
| Current Assets | $4.01B | $3.84B | $5.22B | $5.19B | $1.99B | $2.21B | $2.23B | $2.00B | $2.48B | $3.31B | $1.83B | $3.35B | |
| PP&E (Net) | $8.61B | $9.33B | $9.50B | $6.96B | $5.91B | $5.35B | $4.91B | $3.02B | $2.49B | $2.36B | $2.32B | $1.23B | |
| PP&E (Gross) | $11.77B | $12.52B | $12.23B | $9.35B | $8.07B | $7.43B | $6.82B | $4.80B | $4.12B | $3.91B | $3.70B | $2.62B | |
| Accum. Depreciation | $3.16B | $3.19B | $2.74B | $2.39B | $2.17B | $2.07B | $1.91B | $1.78B | $1.63B | $1.55B | $1.38B | $1.39B | |
| Goodwill | $1.50B | $1.58B | $1.63B | $1.62B | $1.60B | $1.67B | $1.58B | $1.57B | $1.61B | $1.54B | $1.46B | $243M | |
| Intangibles | $214M | $231M | $262M | $288M | $309M | $349M | $355M | $386M | $422M | $355M | $384M | $44M | |
| Other Non-current Assets | $647M | $505M | $297M | $251M | $252M | $219M | $213M | $80M | $74M | $142M | $194M | $161M | |
| Total Assets | $16.37B | $16.61B | $18.27B | $15.46B | $10.97B | $10.45B | $9.86B | $7.58B | $7.75B | $8.16B | $9.60B | $5.20B | |
| Accounts Payable | · | · | · | $1.53B | $600M | $483M | $574M | $523M | $419M | $282M | $240M | $232M | |
| Accrued Liabilities | $522M | $468M | $545M | $506M | $763M | $441M | $576M | $257M | $268M | $322M | $313M | $166M | |
| Short-term Debt | · | · | · | · | · | · | · | · | · | · | · | $367M | |
| Current Liabilities | $1.80B | $1.97B | $3.56B | $2.74B | $1.87B | $1.80B | $1.41B | $1.18B | $1.20B | $1.14B | $1.62B | $1.14B | |
| Capital Leases | $103M | $100M | $114M | $99M | $127M | $117M | $115M | $0 | · | · | · | · | |
| Deferred Tax | $368M | $358M | $558M | $481M | $353M | $395M | $398M | $383M | $370M | $413M | $385M | $57M | |
| Other Non-current Liabilities | $1.08B | $819M | $769M | $637M | $664M | $629M | $755M | $527M | $599M | $195M | $239M | $88M | |
| Long-term Debt | $3.19B | $3.52B | $4.17B | $3.22B | $2.39B | $3.57B | $3.05B | $1.71B | $1.84B | $2.37B | $3.82B | $2.93B | |
| Total Debt | · | · | · | · | · | $3.57B | · | $1.71B | $1.84B | $2.37B | · | $3.30B | |
| Common Stock | $1M | $1M | $1M | $1M | $1M | $1M | $1M | $1M | $1M | $1M | $1M | $780.0K | |
| Retained Earnings | $4.61B | $5.48B | $6.99B | $5.60B | $3.10B | $3.16B | $2.94B | $2.57B | $2.04B | $2.12B | $1.62B | $1.41B | |
| AOCI | $-335M | $-742M | $-529M | $-561M | $-392M | $-326M | $-396M | $-351M | $-226M | $-412M | $-421M | $-62M | |
| Stockholders' Equity | $9.53B | $9.96B | $9.41B | $7.98B | $5.63B | $4.27B | $3.93B | $3.59B | $3.67B | $3.80B | $3.25B | $1.36B | |
| Liabilities + Equity | $16.37B | $16.61B | $18.27B | $15.46B | $10.97B | $10.45B | $9.86B | $7.58B | $7.75B | $8.16B | $9.60B | $5.22B | |
| Shares Outstanding | 117,716,000 | 117,560,000 | 117,356,000 | 117,168,000 | 117,015,000 | 106,842,000 | 106,040,000 | 105,616,000 | 110,547,000 | 112,524,000 | 112,219,000 | 78,031,000 |
Cashflow
| Kennzahl | Trend | 2025 | 2024 | 2023 | 2022 | 2021 | 2020 | 2019 | 2018 | 2017 | 2016 | 2015 | 2014 |
|---|---|---|---|---|---|---|---|---|---|---|---|---|---|
| D&A | $659M | $589M | $430M | $301M | $254M | $232M | $213M | $201M | $197M | $226M | $260M | $104M | |
| Stock-based Comp | $40M | $32M | $37M | $30M | $20M | $23M | $20M | $15M | $19M | $17M | $15M | $14M | |
| Deferred Tax | $81M | $-230M | $101M | $93M | $-38M | $-2M | $14M | $49M | $-42M | $23M | $-123M | $-47M | |
| Amort. of Intangibles | $22M | $23M | $28M | $25M | $25M | $25M | $27M | $28M | $25M | $19M | $17M | $6M | |
| Other Non-cash | · | · | · | · | · | $170M | · | $-412M | $75M | $-177M | $-113M | · | |
| Operating Cash Flow | $1.28B | $688M | $1.33B | $1.91B | $344M | $799M | $719M | $546M | $304M | $736M | $361M | $493M | |
| CapEx | $590M | $1.68B | $2.15B | $1.26B | $954M | $850M | $852M | $700M | $318M | $197M | $228M | $111M | |
| Investing Cash Flow | $-146M | $-1.58B | $-2.56B | $-1.45B | $-667M | $-864M | $-1.66B | $-304M | $-358M | $2.92B | $-2.16B | $-46M | |
| Debt Issued | $57M | $112M | $356M | $1.96B | $0 | $452M | $1.60B | $0 | $27M | $0 | $2.25B | $0 | |
| Net Debt Issued | · | · | · | · | · | $202M | · | $0 | $-751M | $-1.25B | $-376M | $-6M | |
| Stock Issued | · | · | $0 | $0 | $1.45B | $0 | $0 | · | · | · | · | · | |
| Stock Repurchased | · | · | · | · | · | $0 | $0 | $500M | $250M | $0 | $0 | $150M | |
| Net Stock Activity | · | · | · | · | · | $0 | · | $-500M | $-250M | $0 | $0 | $-150M | |
| Dividends Paid | $191M | $189M | $187M | $184M | $178M | $162M | $152M | $145M | $141M | $135M | $119M | $84M | |
| Financing Cash Flow | $-834M | $1.24B | $624M | $612M | $50M | $177M | $1.04B | $-787M | $-1.09B | $-1.58B | $-478M | $1.61B | |
| Net Change in Cash | $426M | $302M | $-609M | $1.06B | $-307M | $134M | $58M | $-582M | $-1.13B | $2.06B | $-2.28B | $2.01B | |
| Taxes Paid | $152M | $263M | $319M | $248M | $131M | $52M | $170M | $158M | $320M | $143M | $162M | $56M | |
| Free Cash Flow | · | · | · | · | · | $-52M | · | $-154M | $-14M | $537M | $133M | $382M |
Rentabilität
| Kennzahl | Trend | 2025 | 2024 | 2023 | 2022 | 2021 | 2020 | 2019 | 2018 | 2017 | 2016 | 2015 | 2014 |
|---|---|---|---|---|---|---|---|---|---|---|---|---|---|
| Gross Margin | · | · | · | · | · | 31.8% | · | 36.1% | 36.1% | 36.2% | 32.8% | 31.5% | |
| Operating Margin | · | · | · | · | · | 16.2% | · | 27.0% | 19.1% | 21.5% | 12.1% | 11.1% | |
| Net Margin | · | · | · | · | · | 12.0% | · | 20.5% | 1.8% | 24.0% | 9.2% | 5.5% | |
| Pretax Margin | · | · | · | · | · | 11.9% | · | 23.5% | 14.5% | 19.2% | 9.8% | 22.1% | |
| EBITDA Margin | · | · | · | · | · | 23.6% | · | 33.0% | 25.5% | 29.9% | 19.2% | 11.1% | |
| ROA | · | · | · | · | · | 3.7% | · | 9.0% | 0.69% | 7.2% | 4.5% | 3.0% | |
| ROE | · | · | · | · | · | 9.2% | · | 19.1% | 1.5% | 18.3% | 14.5% | 8.9% | |
| ROIC | · | · | · | · | · | 5.5% | · | 14.1% | 0.36% | 7.6% | 12.5% | 5.6% |
Liquidität & Solvenz
| Kennzahl | Trend | 2025 | 2024 | 2023 | 2022 | 2021 | 2020 | 2019 | 2018 | 2017 | 2016 | 2015 | 2014 |
|---|---|---|---|---|---|---|---|---|---|---|---|---|---|
| Current Ratio | · | · | · | · | · | 1.2 | · | 1.7 | 2.1 | 2.9 | 1.1 | 2.9 | |
| Quick Ratio | · | · | · | · | · | 0.3 | · | 1.0 | 1.4 | 2.4 | 0.5 | 2.5 | |
| Debt / Equity | · | · | · | · | · | 0.8 | · | 0.5 | 0.5 | 0.6 | · | 2.4 | |
| LT Debt / Equity | · | · | · | · | · | 0.6 | · | 0.4 | 0.4 | 0.6 | · | 1.6 |
Effizienz
| Kennzahl | Trend | 2025 | 2024 | 2023 | 2022 | 2021 | 2020 | 2019 | 2018 | 2017 | 2016 | 2015 | 2014 |
|---|---|---|---|---|---|---|---|---|---|---|---|---|---|
| Asset Turnover | · | · | · | · | · | 0.3 | · | 0.4 | 0.4 | 0.3 | 0.5 | 0.6 | |
| Inventory Turnover | · | · | · | · | · | 2.8 | · | 3.3 | 3.8 | 3.8 | 5.7 | 4.2 | |
| Receivables Turnover | · | · | · | · | · | 5.5 | · | 5.9 | 6.0 | 6.1 | 7.8 | 5.9 |
Pro Aktie
| Kennzahl | Trend | 2025 | 2024 | 2023 | 2022 | 2021 | 2020 | 2019 | 2018 | 2017 | 2016 | 2015 | 2014 |
|---|---|---|---|---|---|---|---|---|---|---|---|---|---|
| Book Value / Share | · | · | · | · | · | $39.95 | · | $33.95 | $33.24 | $33.73 | $29.00 | $17.42 | |
| Revenue / Share | · | · | · | · | · | $29.29 | · | $30.83 | $27.34 | $23.64 | $32.73 | $30.92 | |
| Cash Flow / Share | · | · | · | · | · | $7.48 | · | $4.99 | $2.70 | $6.48 | $3.23 | $6.23 | |
| Cash / Share | · | · | · | · | · | · | · | $5.26 | $10.29 | $20.17 | $1.90 | $31.91 | |
| Dividend / Share | $1.62 | $1.61 | $1.60 | $1.58 | $1.56 | $1.54 | $1.47 | $1.34 | $1.28 | $1.22 | $1.16 | $1.10 | |
| EPS (TTM) | $-5.76 | $-11.20 | $13.36 | $22.84 | $1.06 | $3.52 | $5.02 | $6.34 | $0.49 | $5.68 | $3.00 | $1.69 |
Wachstumsraten
| Kennzahl | Trend | 2025 | 2024 | 2023 | 2022 | 2021 | 2020 | 2019 | 2018 | 2017 | 2016 | 2015 | 2014 |
|---|---|---|---|---|---|---|---|---|---|---|---|---|---|
| Revenue YoY | -4.4% | -44.1% | 31.4% | 120.0% | 6.4% | · | · | · | · | · | · | · | |
| Revenue CAGR 3Y | -11.1% | 17.3% | 45.4% | · | · | · | · | · | · | · | · | · | |
| Revenue CAGR 5Y | 10.4% | · | · | · | · | · | · | · | · | · | · | · | |
| EPS YoY | · | · | -41.5% | 2054.7% | -69.9% | · | · | · | · | · | · | · | |
| EPS CAGR 3Y | · | · | 56.0% | · | · | · | · | · | · | · | · | · | |
| Net Income YoY | · | · | -41.5% | 2075.0% | -67.1% | · | · | · | · | · | · | · | |
| Net Income CAGR 3Y | · | · | 61.2% | · | · | · | · | · | · | · | · | · | |
| Dividends Paid CAGR 5Y | 3.3% | · | · | · | · | · | · | · | · | · | · | · |
Bewertung (TTM)
| Kennzahl | Trend | 2025 | 2024 | 2023 | 2022 | 2021 | 2020 | 2019 | 2018 | 2017 | 2016 | 2015 | 2014 |
|---|---|---|---|---|---|---|---|---|---|---|---|---|---|
| Revenue TTM | $5.14B | $5.38B | $9.62B | $7.32B | $3.33B | $3.13B | $3.59B | $3.37B | $3.07B | $2.68B | $2.83B | $2.45B | |
| Net Income TTM | $-511M | $-1.18B | $1.57B | $2.69B | $124M | $376M | $533M | $694M | $55M | $644M | $335M | $133M | |
| Market Cap | · | · | · | · | · | $15.76B | · | $8.14B | $14.14B | $9.69B | $6.29B | $4.69B | |
| Enterprise Value | · | · | · | · | · | · | · | $9.29B | $14.84B | $9.79B | · | $5.50B | |
| P/E | -24.6 | -7.7 | 10.8 | 9.5 | 220.5 | 41.9 | 14.5 | 12.2 | 261.0 | 15.2 | 18.7 | 35.6 | |
| P/S | · | · | · | · | · | 5.0 | · | 2.4 | 4.6 | 3.6 | 2.2 | 1.9 | |
| P/B | · | · | · | · | · | 3.7 | · | 2.3 | 3.8 | 2.6 | 1.9 | 3.5 | |
| P / Tangible Book | 2.1 | 1.2 | 2.3 | 4.2 | 7.4 | 7.0 | · | · | · | · | · | · | |
| P / Cash Flow | · | · | · | · | · | 19.7 | · | 14.9 | 46.5 | 13.2 | 17.4 | 9.5 | |
| P / FCF | · | · | · | · | · | -305.7 | · | -52.9 | -1030.2 | 18.0 | 47.2 | 12.3 | |
| EV / EBITDA | · | · | · | · | · | · | · | 8.4 | 18.9 | 12.2 | · | 20.3 | |
| EV / FCF | · | · | · | · | · | · | · | -60.4 | -1081.2 | 18.2 | · | 14.4 | |
| EV / Revenue | · | · | · | · | · | · | · | 2.8 | 4.8 | 3.7 | · | 2.3 | |
| Dividend Yield | · | · | · | · | · | 1.0% | · | 1.8% | 0.99% | 1.4% | 1.9% | 1.8% | |
| Earnings Yield | -4.1% | -13.0% | 9.2% | 10.5% | 0.45% | 2.4% | 6.9% | 8.2% | 0.38% | 6.6% | 5.4% | 2.8% | |
| Payout Ratio | · | · | · | · | · | 43.1% | · | 20.8% | 256.3% | 21.0% | 35.6% | 0.00% | |
| Annual Payout | $191M | $189M | $187M | $184M | $178M | $162M | $152M | $145M | $141M | $135M | $119M | $84M |
Gewinn- und Verlustrechnung
| Kennzahl | Trend | Q2 2026 | Q1 2026 | Q4 2025 | Q3 2025 | Q2 2025 | Q1 2025 | Q4 2024 | Q3 2024 | Q2 2024 | Q1 2024 | Q4 2023 | Q3 2023 | Q2 2023 | Q1 2023 | Q4 2022 | Q3 2022 |
|---|---|---|---|---|---|---|---|---|---|---|---|---|---|---|---|---|---|
| Revenue | $1.74B | $1.43B | $1.43B | $1.31B | $1.33B | $1.08B | $1.23B | $1.35B | $1.43B | $1.36B | $2.36B | $2.31B | $2.37B | $2.58B | $2.62B | $2.09B | |
| Cost of Revenue | $1.15B | $928M | $1.23B | $1.19B | $1.13B | $921M | $1.09B | $1.46B | $1.44B | $1.32B | $3.06B | $2.26B | $1.81B | $1.30B | $1.62B | $1.05B | |
| Gross Profit | $590M | $501M | $198M | $118M | $197M | $156M | $138M | $-104M | $-11M | $39M | $-704M | $55M | $558M | $1.28B | $1.00B | $1.04B | |
| R&D Expense | $4M | $9M | $12M | $13M | $12M | $14M | $20M | $22M | $21M | $24M | $23M | $21M | $21M | $20M | $20M | $18M | |
| SG&A Expense | $126M | $137M | $156M | $139M | $132M | $124M | $136M | $154M | $166M | $161M | $187M | $172M | $397M | $154M | $148M | $134M | |
| Operating Income | $453M | $234M | $-217M | $-217M | $48M | $20M | $4M | $-1.11B | $-493M | $-180M | $-850M | $-140M | $140M | $1.10B | $833M | $891M | |
| Other Non-op | $20M | $54M | $-10M | $29M | $-7M | $10M | $117M | $-22M | $34M | $50M | $-37M | $11M | $54M | $82M | $54M | $8M | |
| Pretax Income | $442M | $254M | $-285M | $-239M | $-9M | $-19M | $77M | $-1.18B | $-494M | $-168M | $-921M | $-158M | $168M | $1.16B | $863M | $869M | |
| Income Tax | $94M | $22M | $157M | $-31M | $34M | $-4M | $11M | $111M | $-31M | $-4M | $119M | $-9M | $43M | $277M | $24M | $197M | |
| Net Income | $480M | $319M | $-414M | $-161M | $23M | $41M | $75M | $-1.07B | $-188M | $2M | $-618M | $303M | $650M | $1.24B | $1.13B | $897M | |
| EPS (Basic) | $3.72 | $2.35 | $-3.88 | $-1.72 | $-0.16 | $0.00 | $0.29 | $-9.45 | $-1.96 | $-0.08 | $-5.28 | $2.58 | $5.54 | $10.57 | $9.68 | $7.66 | |
| EPS (Diluted) | $3.52 | $2.34 | $-3.88 | $-1.72 | $-0.16 | $0.00 | $0.29 | $-9.45 | $-1.96 | $-0.08 | $-5.24 | $2.57 | $5.52 | $10.51 | $9.62 | $7.61 | |
| Shares (Basic) | 117,961,000 | 117,854,000 | · | 117,685,000 | 117,665,000 | 117,603,000 | · | 117,535,000 | 117,528,000 | 117,451,000 | · | 117,349,000 | 117,332,000 | 117,232,000 | · | 117,136,000 | |
| Shares (Diluted) | 136,212,000 | 118,607,000 | · | 117,685,000 | 117,665,000 | 117,603,000 | · | 117,535,000 | 117,528,000 | 117,451,000 | · | 117,783,000 | 117,769,000 | 117,841,000 | · | 117,869,000 | |
| EBITDA | $609M | $391M | · | $-53M | $216M | $182M | · | $-945M | $-354M | $-56M | · | $-35M | $233M | $1.19B | · | $969M |
Bilanz
| Kennzahl | Trend | Q2 2026 | Q1 2026 | Q4 2025 | Q3 2025 | Q2 2025 | Q1 2025 | Q4 2024 | Q3 2024 | Q2 2024 | Q1 2024 | Q4 2023 | Q3 2023 | Q2 2023 | Q1 2023 | Q4 2022 | Q3 2022 |
|---|---|---|---|---|---|---|---|---|---|---|---|---|---|---|---|---|---|
| Cash & Equivalents | $1.63B | $1.09B | · | $1.93B | $1.81B | $1.52B | · | $1.66B | $1.83B | $2.06B | · | $1.60B | $1.60B | $1.59B | · | $1.38B | |
| Receivables | $604M | $523M | $594M | $733M | $766M | $671M | $742M | $750M | $786M | $874M | · | $1.18B | $1.34B | $1.35B | · | $1.04B | |
| Inventory | $1.38B | $1.35B | $1.18B | $1.53B | $1.64B | $1.66B | $1.50B | $1.66B | $1.80B | $1.90B | · | $3.40B | $3.66B | $3.18B | · | $1.61B | |
| Prepaid Expense | · | · | $56M | · | · | · | $77M | $72M | · | · | · | · | · | · | · | · | |
| Other Current Assets | $200M | $163M | $140M | $249M | $178M | $125M | $167M | $329M | $398M | $550M | · | $412M | $425M | $226M | · | $129M | |
| Current Assets | $3.94B | $3.26B | $4.01B | $4.55B | $4.51B | $4.11B | $3.84B | $4.67B | $5.23B | $5.82B | · | $7.13B | $7.45B | $6.66B | · | $4.30B | |
| PP&E (Net) | $8.46B | $8.53B | · | $9.22B | $9.25B | $9.30B | · | $9.26B | $9.84B | $9.76B | · | $8.31B | $7.85B | $7.35B | · | $6.43B | |
| PP&E (Gross) | $11.90B | $11.82B | · | $12.90B | $12.79B | $12.66B | · | $12.38B | $12.79B | $12.59B | · | $10.93B | $10.40B | $9.83B | · | $8.71B | |
| Accum. Depreciation | $3.44B | $3.30B | · | $3.68B | $3.54B | $3.36B | · | $3.12B | $2.95B | $2.83B | · | $2.62B | $2.54B | $2.48B | · | $2.29B | |
| Goodwill | $1.48B | $1.49B | $1.50B | $1.49B | $1.67B | $1.61B | $1.58B | $1.64B | $1.60B | $1.61B | $1.63B | $1.61B | $1.63B | $1.63B | $1.62B | $1.47B | |
| Intangibles | $202M | $208M | $214M | $230M | $235M | $230M | $231M | $246M | $243M | $252M | · | $261M | $274M | $285M | · | $263M | |
| Other Non-current Assets | $708M | $637M | $647M | $736M | $738M | $628M | $505M | $464M | $321M | $329M | · | $329M | $270M | $243M | · | $217M | |
| Total Assets | $15.91B | $15.14B | $16.37B | $17.15B | $17.29B | $17.00B | $16.61B | $17.46B | $18.39B | $19.03B | $18.27B | $18.88B | $19.11B | $17.56B | $15.46B | $13.83B | |
| Accounts Payable | · | · | · | · | · | · | · | · | · | · | · | · | · | $1.76B | · | $1.65B | |
| Accrued Liabilities | $508M | $453M | $522M | $501M | $415M | $380M | $468M | $513M | $508M | $455M | · | $689M | $673M | $403M | · | $385M | |
| Current Liabilities | $1.89B | $1.58B | $1.80B | $2.00B | $1.95B | $1.94B | $1.97B | $1.91B | $1.96B | $2.05B | · | $3.94B | $4.29B | $3.51B | · | $2.49B | |
| Capital Leases | $96M | $100M | $103M | $109M | $95M | $101M | $100M | $108M | $108M | $114M | · | $116M | $112M | $102M | · | $102M | |
| Deferred Tax | $369M | $369M | $368M | $407M | $367M | $378M | $358M | $526M | $501M | $657M | · | $290M | $328M | $486M | · | $429M | |
| Other Non-current Liabilities | $1.16B | $1.12B | $1.08B | $1.14B | $1.14B | $1.13B | $819M | $792M | $758M | $834M | · | $807M | $701M | $687M | · | $598M | |
| Long-term Debt | $1.88B | $1.88B | $3.19B | $3.63B | $3.62B | $3.54B | $3.52B | $3.57B | $3.52B | $3.52B | · | $3.66B | $3.52B | $3.24B | · | $3.37B | |
| Total Debt | $1.88B | $1.88B | · | $3.63B | $3.62B | $3.54B | · | $3.57B | $3.52B | $3.52B | · | $3.66B | $3.52B | $3.24B | · | $3.37B | |
| Common Stock | $1M | $1M | $1M | $1M | $1M | $1M | $1M | $1M | $1M | $1M | · | $1M | $1M | $1M | · | $1M | |
| Retained Earnings | $5.23B | $4.84B | $4.61B | $5.12B | $5.37B | $5.43B | $5.48B | $5.50B | $6.65B | $6.93B | · | $7.65B | $7.40B | $6.79B | · | $4.52B | |
| AOCI | $-244M | $-259M | $-335M | $-369M | $-365M | $-633M | $-742M | $-470M | $-638M | $-597M | · | $-701M | $-518M | $-513M | · | $-717M | |
| Stockholders' Equity | $10.28B | $9.85B | $9.53B | $10.00B | $10.24B | $10.03B | $9.96B | $10.24B | $11.22B | $11.53B | · | $9.90B | $9.82B | $9.21B | · | $6.73B | |
| Liabilities + Equity | $15.91B | $15.14B | $16.37B | $17.15B | $17.29B | $17.00B | $16.61B | $17.46B | $18.39B | $19.03B | · | $18.88B | $19.11B | $17.56B | · | $13.83B | |
| Shares Outstanding | 117,994,000 | 117,886,000 | 117,716,000 | 117,692,000 | 117,669,000 | 117,651,000 | 117,560,000 | 117,538,000 | 117,528,000 | 117,527,000 | · | 117,352,000 | 117,340,000 | 117,299,000 | · | 117,145,000 |
Cashflow
| Kennzahl | Trend | Q2 2026 | Q1 2026 | Q4 2025 | Q3 2025 | Q2 2025 | Q1 2025 | Q4 2024 | Q3 2024 | Q2 2024 | Q1 2024 | Q4 2023 | Q3 2023 | Q2 2023 | Q1 2023 | Q4 2022 | Q3 2022 |
|---|---|---|---|---|---|---|---|---|---|---|---|---|---|---|---|---|---|
| D&A | $156M | $158M | $164M | $164M | $169M | $162M | $163M | $164M | $138M | $124M | $144M | $105M | $93M | $87M | $86M | $78M | |
| Stock-based Comp | $7M | $8M | $12M | $11M | $10M | $7M | $8M | $9M | $6M | $9M | $7M | $9M | $9M | $11M | $6M | $9M | |
| Deferred Tax | $-19M | $-1M | $71M | $49M | $-33M | $-6M | $-118M | $16M | $-246M | $116M | $284M | $-38M | $-159M | $14M | $15M | $38M | |
| Amort. of Intangibles | $5M | $5M | $5M | $6M | $6M | $5M | $6M | $6M | $6M | $6M | $6M | $7M | $7M | $7M | $7M | $6M | |
| Other Non-cash | · | $-282M | · | · | · | $319M | · | · | · | $-206M | · | · | · | $-1.39B | · | · | |
| Operating Cash Flow | $710M | $346M | $388M | $356M | $-7M | $547M | $-4M | $231M | $367M | $97M | $-97M | $629M | $74M | $721M | $952M | $895M | |
| CapEx | $72M | $99M | $155M | $132M | $120M | $183M | $343M | $311M | $455M | $583M | $689M | $546M | $504M | $416M | $446M | $313M | |
| Investing Cash Flow | $-80M | $541M | $-177M | $-153M | $363M | $-129M | $-329M | $-312M | $-445M | $-480M | $-849M | $-663M | $-514M | $-539M | $-609M | $-313M | |
| Debt Issued | $18M | $18M | $18M | $19M | $19M | $0 | $28M | $28M | $27M | $29M | $56M | $0 | $300M | $0 | $0 | $0 | |
| Net Debt Issued | · | $-1.28B | · | · | · | $-10M | · | · | · | $0 | · | · | · | $0 | · | · | |
| Stock Issued | · | · | · | · | · | · | · | · | · | · | · | · | · | · | · | $0 | |
| Dividends Paid | $48M | $48M | $48M | $48M | $48M | $48M | $48M | $47M | $47M | $47M | $47M | $47M | $47M | $46M | $46M | $46M | |
| Financing Cash Flow | $-80M | $-1.41B | $-533M | $-91M | $-91M | $-120M | $-93M | $-110M | $-113M | $1.56B | $397M | $100M | $246M | $-119M | $-299M | $-65M | |
| Net Change in Cash | $542M | $-528M | $-314M | $125M | $288M | $326M | $-472M | $-166M | $-226M | $1.17B | $-712M | $2M | $13M | $88M | $116M | $452M | |
| Free Cash Flow | · | $248M | · | · | · | $363M | · | · | · | $-481M | · | · | · | $305M | · | · |
Rentabilität
| Kennzahl | Trend | Q2 2026 | Q1 2026 | Q4 2025 | Q3 2025 | Q2 2025 | Q1 2025 | Q4 2024 | Q3 2024 | Q2 2024 | Q1 2024 | Q4 2023 | Q3 2023 | Q2 2023 | Q1 2023 | Q4 2022 | Q3 2022 |
|---|---|---|---|---|---|---|---|---|---|---|---|---|---|---|---|---|---|
| Gross Margin | 33.9% | 35.1% | · | 9.0% | 14.8% | 14.5% | · | -7.7% | -0.74% | 2.9% | · | 2.4% | 23.6% | 49.5% | · | 49.9% | |
| Operating Margin | 26.0% | 16.3% | · | -16.6% | 3.6% | 1.8% | · | -81.8% | -34.4% | -13.2% | · | -6.1% | 5.9% | 42.7% | · | 42.6% | |
| Net Margin | 27.5% | 22.3% | · | -12.3% | 1.7% | 3.8% | · | -78.9% | -13.2% | 0.18% | · | 13.1% | 27.4% | 48.0% | · | 42.9% | |
| Pretax Margin | 25.3% | 17.8% | · | -18.3% | -0.67% | -1.8% | · | -87.0% | -34.5% | -12.3% | · | -6.9% | 7.1% | 44.9% | · | 41.6% | |
| EBITDA Margin | 34.9% | 27.4% | · | -4.0% | 16.3% | 16.9% | · | -69.8% | -24.8% | -4.1% | · | -1.5% | 9.8% | 46.1% | · | 46.3% | |
| ROA | 2.9% | 2.0% | · | -0.93% | 0.13% | 0.23% | · | -5.9% | -1.0% | 0.01% | · | 1.8% | 4.1% | 8.6% | · | 7.3% | |
| ROE | 4.7% | 3.2% | · | -1.6% | 0.21% | 0.38% | · | -10.6% | -1.8% | 0.02% | · | 3.6% | 8.2% | 16.5% | · | 14.4% | |
| ROIC | 2.9% | 1.8% | · | -1.4% | 1.7% | 0.12% | · | -8.8% | -3.1% | -1.2% | · | -0.98% | 0.78% | 6.7% | · | 6.8% |
Liquidität & Solvenz
| Kennzahl | Trend | Q2 2026 | Q1 2026 | Q4 2025 | Q3 2025 | Q2 2025 | Q1 2025 | Q4 2024 | Q3 2024 | Q2 2024 | Q1 2024 | Q4 2023 | Q3 2023 | Q2 2023 | Q1 2023 | Q4 2022 | Q3 2022 |
|---|---|---|---|---|---|---|---|---|---|---|---|---|---|---|---|---|---|
| Current Ratio | 2.1 | 2.1 | · | 2.3 | 2.3 | 2.1 | · | 2.4 | 2.7 | 2.8 | · | 1.8 | 1.7 | 1.9 | · | 1.7 | |
| Quick Ratio | 1.2 | 1.0 | · | 1.3 | 1.3 | 1.1 | · | 1.3 | 1.3 | 1.4 | · | 0.7 | 0.7 | 0.8 | · | 1.0 | |
| Debt / Equity | 0.2 | 0.2 | · | 0.4 | 0.4 | 0.4 | · | 0.3 | 0.3 | 0.3 | · | 0.4 | 0.4 | 0.4 | · | 0.5 | |
| LT Debt / Equity | 0.2 | 0.2 | · | 0.3 | 0.3 | 0.3 | · | 0.3 | 0.3 | 0.3 | · | 0.4 | 0.4 | 0.4 | · | 0.5 |
Effizienz
| Kennzahl | Trend | Q2 2026 | Q1 2026 | Q4 2025 | Q3 2025 | Q2 2025 | Q1 2025 | Q4 2024 | Q3 2024 | Q2 2024 | Q1 2024 | Q4 2023 | Q3 2023 | Q2 2023 | Q1 2023 | Q4 2022 | Q3 2022 |
|---|---|---|---|---|---|---|---|---|---|---|---|---|---|---|---|---|---|
| Asset Turnover | 0.1 | 0.1 | · | 0.1 | 0.1 | 0.1 | · | 0.1 | 0.1 | 0.1 | · | 0.1 | 0.1 | 0.2 | · | 0.2 | |
| Inventory Turnover | 0.8 | 0.6 | · | 0.7 | 0.7 | 0.5 | · | 0.6 | 0.5 | 0.5 | · | 0.9 | 0.7 | 0.6 | · | 0.9 | |
| Receivables Turnover | 2.5 | 2.4 | · | 1.8 | 1.7 | 1.4 | · | 1.4 | 1.3 | 1.2 | · | 2.1 | 2.1 | 2.6 | · | 2.7 |
Pro Aktie
| Kennzahl | Trend | Q2 2026 | Q1 2026 | Q4 2025 | Q3 2025 | Q2 2025 | Q1 2025 | Q4 2024 | Q3 2024 | Q2 2024 | Q1 2024 | Q4 2023 | Q3 2023 | Q2 2023 | Q1 2023 | Q4 2022 | Q3 2022 |
|---|---|---|---|---|---|---|---|---|---|---|---|---|---|---|---|---|---|
| Book Value / Share | $87.08 | $83.56 | · | $84.93 | $87.03 | $85.24 | · | $87.13 | $95.49 | $98.13 | · | $84.34 | $83.65 | $78.54 | · | $57.47 | |
| Revenue / Share | $12.80 | $12.05 | · | $11.11 | $11.30 | $9.16 | · | $11.53 | $12.17 | $11.59 | · | $19.62 | $20.13 | $21.90 | · | $17.75 | |
| Cash Flow / Share | · | $2.92 | · | · | · | $4.64 | · | · | · | $0.83 | · | · | · | $6.12 | · | · | |
| Cash / Share | $13.83 | $9.24 | · | $16.41 | $15.36 | $12.91 | · | $14.16 | $15.57 | $17.49 | · | $13.65 | $13.63 | $13.53 | · | $11.80 | |
| Dividend / Share | $0.41 | $0.41 | $0.41 | $0.41 | $0.41 | $0.41 | $0.41 | $0.41 | $0.40 | $0.40 | $0.40 | $0.40 | $0.40 | $0.40 | $0.40 | $0.40 | |
| EPS (TTM) | $0.26 | $-3.42 | · | $-1.59 | $-9.32 | $-11.12 | · | $-16.73 | $-4.71 | $2.77 | · | $28.22 | $33.26 | $31.20 | · | $13.18 |
Bewertung (TTM)
| Kennzahl | Trend | Q2 2026 | Q1 2026 | Q4 2025 | Q3 2025 | Q2 2025 | Q1 2025 | Q4 2024 | Q3 2024 | Q2 2024 | Q1 2024 | Q4 2023 | Q3 2023 | Q2 2023 | Q1 2023 | Q4 2022 | Q3 2022 |
|---|---|---|---|---|---|---|---|---|---|---|---|---|---|---|---|---|---|
| Revenue TTM | $5.91B | $5.49B | · | $4.95B | $4.99B | $5.09B | · | $6.50B | $7.46B | $8.40B | · | $9.88B | $9.66B | $8.77B | · | $5.59B | |
| Net Income TTM | $224M | $-233M | · | $-21M | $-929M | $-1.14B | · | $-1.87B | $-501M | $337M | · | $3.32B | $3.92B | $3.68B | · | $1.55B | |
| Market Cap | $15.93B | $21.16B | · | $9.54B | $7.37B | $8.47B | · | $11.13B | $11.23B | $15.48B | · | $19.95B | $26.18B | $25.93B | · | $30.98B | |
| Enterprise Value | $16.18B | $21.96B | · | $11.24B | $9.19B | $10.49B | · | $13.04B | $12.92B | $16.95B | · | $22.01B | $28.09B | $27.58B | · | $32.96B | |
| P/E | 519.3 | -52.5 | · | -51.0 | -6.7 | -6.5 | · | -5.7 | -20.3 | 47.6 | · | 6.0 | 6.7 | 7.1 | · | 20.1 | |
| P/S | 2.7 | 3.9 | · | 1.9 | 1.5 | 1.7 | · | 1.7 | 1.5 | 1.8 | · | 2.0 | 2.7 | 3.0 | · | 5.5 | |
| P/B | 1.6 | 2.1 | · | 1.0 | 0.7 | 0.8 | · | 1.1 | 1.0 | 1.3 | · | 2.0 | 2.7 | 2.8 | · | 4.6 | |
| P / Tangible Book | 1.9 | 2.6 | · | 1.2 | 0.9 | 1.0 | · | 1.3 | 1.2 | 1.6 | · | 2.5 | 3.3 | 3.6 | · | 6.2 | |
| P / Cash Flow | · | 61.1 | · | · | · | 15.5 | · | · | · | 158.1 | · | · | · | 36.0 | · | · | |
| EV / Revenue | 2.7 | 4.0 | · | 2.3 | 1.8 | 2.1 | · | 2.0 | 1.7 | 2.0 | · | 2.2 | 2.9 | 3.1 | · | 5.9 | |
| Dividend Yield | 1.2% | 0.90% | · | 2.0% | 2.6% | 2.2% | · | 1.7% | 1.7% | 1.2% | · | 0.93% | 0.71% | 0.71% | · | 0.59% | |
| Earnings Yield | 0.19% | -1.9% | · | -2.0% | -14.9% | -15.4% | · | -17.7% | -4.9% | 2.1% | · | 16.6% | 14.9% | 14.1% | · | 5.0% | |
| Payout Ratio | · | 14.9% | · | · | · | 115.1% | · | · | · | 1916.2% | · | · | · | 3.7% | · | · | |
| Annual Payout | $191M | $191M | · | $190M | $190M | $189M | · | $188M | $188M | $188M | · | $187M | $186M | $185M | · | $184M |
Aktuellster Zeitraum links · fehlende Werte werden als · angezeigt
Finanzberichte Gewinn- und Verlustrechnung, Bilanz, Cashflow — jährlich, letzte 5 Jahre
| Kennzahl | 2025-12-31 | 2024-12-31 | 2023-12-31 | 2022-12-31 | 2021-12-31 |
|---|---|---|---|---|---|
| Umsatz | $5.14B | $5.38B | $9.62B | $7.32B | $3.33B |
| Nettoergebnis | $-511M | $-1.18B | $1.57B | $2.69B | $124M |
| Verwässerte EPS | $-5.76 | $-11.20 | $13.36 | $22.84 | $1.06 |
Noch nicht genügend Fundamentaldaten vorhanden, um diese Aufstellung zu erstellen.
Noch nicht genügend Fundamentaldaten vorhanden, um diese Aufstellung zu erstellen.
Institutionelle Eigentümer (13F) 1.030 Einreicher · $19.4B gesamt · Stand 30. September 2026
Institutionen, die diese Aktie in ihrer vierteljährlichen SEC-Formular 13F melden. Nur Long-Positionen; ein einzelner Einreicher kann für separate Optionsscheine zweimal erscheinen. Große gegenläufige Put/Call-Positionen spiegeln typischerweise Market-Making oder abgesicherte Bestände wider, nicht die gerichtete Überzeugung.
| Neue Positionen | Geschlossene Positionen | Erhöht | Abgenommen | Nettoveränderung der Aktien |
|---|---|---|---|---|
| 143 (-84 vs. Vorquartal) | 156 (+51 vs. Vorquartal) | 327 (+7 vs. Vorquartal) | 378 (+45 vs. Vorquartal) | +8.1M |
Verglichen mit Q1 2026. SEC-Formular 13F-Einreichungen sind innerhalb von 45 Tagen nach Quartalsende fällig, zuzüglich einer kurzen Pufferzeit für verspätete Einreicher — Quartale, die noch in diesem Fenster liegen, werden zugunsten des letzten vollständig berichteten Paares übersprungen.
| Institution | Wert | Aktien | % der verfolgten 13F | Typ |
|---|---|---|---|---|
| VANGUARD GROUP INC | $2.055.062.805 | 14.529.573 | 10,57% | Aktien |
| Capital World Investors | $1.337.023.292 | 9.901.852 | 6,87% | Aktien |
| BlackRock, Inc. | $1.282.999.248 | 9.501.587 | 6,60% | Aktien |
| VANGUARD CAPITAL MANAGEMENT LLC | $1.040.137.710 | 7.703.012 | 5,35% | Aktien |
| VANGUARD PORTFOLIO MANAGEMENT LLC | $869.178.658 | 6.436.930 | 4,47% | Aktien |
| STATE STREET CORP | $744.807.928 | 5.500.062 | 3,83% | Aktien |
| BARCLAYS PLC | $445.133.284 | 3.296.551 | 2,29% | Aktien |
| GEODE CAPITAL MANAGEMENT, LLC | $421.870.561 | 3.129.997 | 2,17% | Aktien |
| MORGAN STANLEY | $391.032.489 | 2.895.892 | 2,01% | Aktien |
| JANE STREET GROUP, LLC | $374.168.130 | 2.771.000 | 1,92% | Verkaufsoption |
| FMR LLC | $362.677.312 | 2.685.901 | 1,86% | Aktien |
| PRIMECAP MANAGEMENT CO/CA/ | $358.100.776 | 2.652.009 | 1,84% | Aktien |
| BANK OF AMERICA CORP /DE/ | $343.425.124 | 2.543.325 | 1,77% | Aktien |
| SUSQUEHANNA INTERNATIONAL GROUP, LLP | $325.975.923 | 2.414.100 | 1,68% | Verkaufsoption |
| VAN ECK ASSOCIATES CORP | $293.662.838 | 2.174.797 | 1,51% | Aktien |
| JANE STREET GROUP, LLC | $269.695.419 | 1.997.300 | 1,39% | Kaufoption |
| Invesco Ltd. | $250.213.290 | 1.853.020 | 1,29% | Aktien |
| Qube Research & Technologies Ltd | $224.740.016 | 1.664.371 | 1,16% | Aktien |
| GOLDMAN SACHS GROUP INC | $224.566.568 | 1.663.086 | 1,15% | Aktien |
| TORONTO DOMINION BANK | $206.922.132 | 1.532.416 | 1,06% | Aktien |
| JPMORGAN CHASE & CO | $205.202.602 | 1.576.429 | 1,06% | Aktien |
| TWO SIGMA INVESTMENTS, LP | $197.242.372 | 1.460.730 | 1,01% | Aktien |
| EARNEST PARTNERS LLC | $193.353.238 | 1.431.928 | 0,99% | Aktien |
| NORGES BANK | $188.275.570 | 1.394.324 | 0,97% | Aktien |
| SUSQUEHANNA INTERNATIONAL GROUP, LLP | $186.246.879 | 1.379.300 | 0,96% | Kaufoption |
| NORTHERN TRUST CORP | $164.484.364 | 1.218.132 | 0,85% | Aktien |
| DIMENSIONAL FUND ADVISORS LP | $155.496.229 | 1.151.642 | 0,80% | Aktien |
| AQR CAPITAL MANAGEMENT LLC | $154.621.607 | 1.155.790 | 0,79% | Aktien |
| CHARLES SCHWAB INVESTMENT MANAGEMENT INC | $152.166.522 | 1.126.909 | 0,78% | Aktien |
| DEUTSCHE BANK AG\ | $131.048.775 | 970.516 | 0,67% | Aktien |
| CITADEL ADVISORS LLC | $127.927.422 | 947.400 | 0,66% | Verkaufsoption |
| Grantham, Mayo, Van Otterloo & Co. LLC | $121.123.665 | 897.013 | 0,62% | Aktien |
| CITADEL ADVISORS LLC | $118.160.837 | 875.071 | 0,61% | Aktien |
| ProShare Advisors LLC | $114.279.939 | 846.330 | 0,59% | Aktien |
| Amundi | $111.783.833 | 827.874 | 0,57% | Aktien |
| MIRAE ASSET GLOBAL ETFS HOLDINGS Ltd. | $108.101.892 | 803.423 | 0,56% | Aktien |
| Bank of New York Mellon Corp | $103.267.572 | 764.775 | 0,53% | Aktien |
| VANGUARD FIDUCIARY TRUST CO | $89.419.837 | 662.222 | 0,46% | Aktien |
| TWO SIGMA ADVISERS, LP | $86.858.304 | 614.100 | 0,45% | Aktien |
| CITADEL ADVISORS LLC | $85.325.457 | 631.900 | 0,44% | Kaufoption |
| TORONTO DOMINION BANK | $82.098.240 | 608.000 | 0,42% | Kaufoption |
| Empower Advisory Group, LLC | $81.968.250 | 607.037 | 0,42% | Aktien |
| UBS Group AG | $79.746.557 | 590.584 | 0,41% | Aktien |
| JACOBS LEVY EQUITY MANAGEMENT, INC | $78.554.378 | 581.755 | 0,40% | Aktien |
| ALLIANCEBERNSTEIN L.P. | $77.611.717 | 432.305 | 0,40% | Aktien |
| SEI INVESTMENTS CO | $76.322.518 | 565.171 | 0,39% | Aktien |
| BANK OF MONTREAL /CAN/ | $75.105.577 | 556.214 | 0,39% | Aktien |
| Altshuler Shaham Ltd | $71.410.075 | 528.846 | 0,37% | Aktien |
| Walleye Trading LLC | $69.175.869 | 512.300 | 0,36% | Verkaufsoption |
| UBS Group AG | $69.148.863 | 512.100 | 0,36% | Kaufoption |
Aktivisten & 5%+-Eigentümer 6 Beteiligungen
Investoren mit SEC Schedule 13D — wirtschaftliches Eigentum über 5% mit der Absicht, Einfluss auf den Emittenten zu nehmen (aktivistische Beteiligungen, Board-Kampagnen, M&A). Jede Zeile zeigt den zuletzt bekannten Stand der Position dieses Melders.
| Anmelder | Eingereicht | Beteiligung | Status | Zweck | Einreichung |
|---|---|---|---|---|---|
| Floyd D. Gottwald, Jr., William M. Gottwald, John D. Gottwald, James T. Gottwald ×5 Einreichungen | 14. Februar 2008 | · | Erste Einreichung | Passive Anlage | SEC |
| Nicht offengelegter meldender Beteiligter, Nicht offengelegter meldender Beteiligter, Nicht offengelegter meldender Beteiligter, Nicht offengelegter meldender Beteiligter | 31. März 2003 | · | Erste Einreichung | Passive Anlage | SEC |
| Nicht offengelegter meldender Beteiligter | 18. Juli 2002 | · | Erste Einreichung | · | SEC |
| Nicht offengelegter meldender Beteiligter | 20. Februar 2002 | · | Erste Einreichung | · | SEC |
| Nicht offengelegter meldender Beteiligter | 23. Februar 2001 | · | Erste Einreichung | Passive Anlage | SEC |
| Nicht offengelegter meldender Beteiligter, Nicht offengelegter meldender Beteiligter, Nicht offengelegter meldender Beteiligter, Nicht offengelegter meldender Beteiligter | 23. Februar 2001 | · | Erste Einreichung | Passive Anlage | SEC |
Purpose is an automated classification of the filer's own stated purpose (SEC Item 4) — not investment advice. "—" means no clear purpose was stated or the text could not be classified.
Unternehmensinsider 72 Insider · 42 Führungskräfte · 31 Direktoren
| Insider | Rolle | Letzte Aktivität | Gehaltene Aktien | Käufe 12m | Verkäufe 12m | Netto 12m |
|---|---|---|---|---|---|---|
| Kent J Masters | Chairman & CEO | 15. Mai 2026 S | 87.519 | 0 | 6 | $-5.024.455 |
| Neal Ravi Sheorey | Chief Financial Officer | 2. März 2026 A | 20.931 | 0 | 0 | $0 |
| Scott Tozier | EVP & CFO | 3. März 2023 S | 69.503 | 0 | 0 | $0 |
| Richard J Diemer JR | Senior Vice President, CFO | 15. August 2010 F | 144.624 | 0 | 0 | $0 |
| Raphael Goszcz Crawford | President, Catalysts | 28. Februar 2023 A | 22.117 | 0 | 0 | $0 |
| John M Steitz | President and COO | 22. August 2012 M | 0 | 0 | 0 | $0 |
| Autumn M. Gagarinas | Chief People Officer | 14. September 2026 A | 10.610 | 0 | 0 | $0 |
| Mark Richard Mummert | Chief Operations Officer | 14. September 2026 A | 23.601 | 0 | 0 | $0 |
| Eric Norris | Chief Commercial Officer | 14. September 2026 A | 64.310 | 0 | 1 | $-941.741 |
| Max Hood | Chief Accounting Officer | 1. September 2026 A | 1.476 | 0 | 0 | $0 |
| Ander C. Krupa | General Counsel & Sec | 2. März 2026 A | 13.184 | 0 | 1 | $-18.060 |
| Cynthia Renee Lima | SVP, Ext. Affairs & Comm. | 2. März 2026 A | 14.438 | 0 | 0 | $0 |
| Melissa H. Anderson | Chief Bus..Transformation Off. | 2. März 2026 A | 14.002 | 0 | 1 | $-1.384.004 |
| Donald J. Labauve Jr. | VP, Corporate Controller & CAO | 2. März 2026 A | 10.402 | 0 | 0 | $0 |
| Stacy Goto Grant | General Counsel & Sec | 27. Februar 2025 A | 9.542 | 0 | 0 | $0 |
| Netha N. Johnson | Chief Operations Officer | 27. Februar 2025 A | 50.029 | 0 | 0 | $0 |
| John Clarence Barichivich III | VP, Controller & CAO | 13. Mai 2024 S | 4.743 | 0 | 0 | $0 |
| Jacobus G. Fourie | Chief Capital Projects Officer | 28. Februar 2024 M | 16.517 | 0 | 0 | $0 |
| Kristin M Coleman | EVP, General Counsel | 26. Februar 2024 F | 2.593 | 0 | 0 | $0 |
| Karen G Narwold | EVP, Chief Admin Officer | 28. Februar 2023 A | 15.013 | 0 | 0 | $0 |
| David Terrence Ryan | VP, Corp. Strategy & IR | 12. Mai 2020 M | 3.653 | 0 | 0 | $0 |
| Deeanne J Marlow | SVP, Chief HR Officer | 28. Februar 2020 A | 1.000 | 0 | 0 | $0 |
| Matthew Juneau | EVP, Corp Strategy & IR | 23. Februar 2018 M | 8.066 | 0 | 0 | $0 |
| Susan M. Kelliher | VP - Human Resources | 26. Februar 2016 A | 6.200 | 0 | 0 | $0 |
| Michael D Wilson | Sr VP,Pres, Catalyst Solutions | 24. Februar 2015 A | 11.680 | 0 | 0 | $0 |
| Ronald C Zumstein | Sr VP, Mfg & Supply Chain | 24. Februar 2015 A | 4.612 | 0 | 0 | $0 |
| Scott A. Martin | Vice President, Fine Chemistry | 18. Oktober 2013 A | 5.700 | 0 | 0 | $0 |
| Anthony Stephen Parnell | VP - Global Supply Chain | 12. März 2013 M | 6.122 | 0 | 0 | $0 |
| Amy Motto | Vice President, Catalysts | 27. Februar 2013 S | 1.448 | 0 | 0 | $0 |
| Ronald Roy Gardner | Vice President | 22. Februar 2013 M | 7.513 | 0 | 0 | $0 |
| John J Nicols | Sr VP, Strat Dev & Catalysts | 20. April 2012 M | 0 | 0 | 0 | $0 |
| Mark C Rohr | Executive Chairman of the Brd | 7. Dezember 2011 G | 262.777 | 0 | 0 | $0 |
| Richard G. Fishman | VP, Treasurer & Chief Tax Coun | 14. Oktober 2011 M | 16.921 | 0 | 0 | $0 |
| William M Gottwald | Vice Chairman of the Board | 13. Mai 2009 A | 2.896.977 | 0 | 0 | $0 |
| Luc Van Muylem | Vice Pres - Polymer Additives | 1. Januar 2009 M | 16.203 | 0 | 0 | $0 |
| John G Dabkowski | VP Business Development | 1. Januar 2009 M | 37.173 | 0 | 0 | $0 |
| Raymond Hurley | VP Alterntiv Fuel Technologies | 5. Februar 2008 M | 42.163 | 0 | 0 | $0 |
| George A Newbill | Sr VP Manufacturing Operations | 5. Februar 2008 M | 20.234 | 0 | 0 | $0 |
| Michael D Whitlow | VP Investor Relations | 12. Februar 2004 M | 14.112 | 0 | 0 | $0 |
| Jack P Harsh | VP Human Resources | 29. Januar 2004 D | 2.352 | 0 | 0 | $0 |
| Whitehead E Elmore | Executive Vice President | 29. Januar 2004 D | 102.582 | 0 | 0 | $0 |
| Robert G Kirchhoefer | Treas. & Chief Acctg. Officer | 21. August 2003 S | 534 | 0 | 0 | $0 |
| Alejandro Daniel Wolff | Direktor | 1. Oktober 2026 A | 13.089 | 0 | 0 | $0 |
| Bartolomeo Eduardo Desalles | Direktor | 21. Juli 2026 A | 1.375 | 0 | 0 | $0 |
| Michelle T Collins | Direktor | 1. Juli 2026 A | 1.577 | 0 | 0 | $0 |
| Ralf Hans Cramer | Direktor | 1. Juli 2026 F | 5.723 | 0 | 0 | $0 |
| Diarmuid B. Oconnell | Direktor | 1. Juli 2026 A | 8.626 | 0 | 0 | $0 |
| Holly Van Deursen | Direktor | 1. Juli 2026 A | 1.650 | 0 | 0 | $0 |
| Mark R Widmar | Direktor | 1. Juli 2026 A | · | 0 | 0 | $0 |
| Glenda J Minor | Direktor | 1. Juli 2026 A | 5.893 | 0 | 0 | $0 |
| Laurie Brlas | Direktor | 1. Juli 2026 A | 7.289 | 0 | 0 | $0 |
| Gerald A Steiner | Direktor | 1. Juli 2026 A | 13.232 | 0 | 0 | $0 |
| Dean Seavers | Direktor | 1. Juli 2025 A | 12.021 | 0 | 0 | $0 |
| OBRIEN JAMES J /KY | Direktor | 1. Juli 2025 A | 8.085 | 0 | 0 | $0 |
| Luther C Kissam IV | Direktor | 3. März 2021 S | 106.505 | 0 | 0 | $0 |
| Harriett Tee Taggart | Direktor | 1. Juli 2019 A | 13.686 | 0 | 0 | $0 |
| Douglas L Maine | Direktor | 1. Juli 2019 A | 28.550 | 0 | 0 | $0 |
| William H Hernandez | Direktor | 1. Juli 2019 A | 1.850 | 0 | 0 | $0 |
| Jim W Nokes | Direktor | 3. Juli 2017 A | 16.811 | 0 | 0 | $0 |
| Barry W Perry | Direktor | 3. Juli 2017 A | · | 0 | 0 | $0 |
| John Sherman JR | Direktor | 6. März 2017 J | 10.000 | 0 | 0 | $0 |
| Joseph M Mahady | Direktor | 1. Juli 2014 A | · | 0 | 0 | $0 |
| Anne M Whittemore | Direktor | 1. Juli 2014 A | 17.854 | 0 | 0 | $0 |
| William R Ide III | Direktor | 1. Oktober 2012 A | 0 | 0 | 0 | $0 |
| Richard L Morrill | Direktor | 27. April 2012 S | 12.637 | 0 | 0 | $0 |
| Alfred J Broaddus Jr | Direktor | 2. April 2012 A | 3.225 | 0 | 0 | $0 |
| Charles E Stewart | Direktor | 5. November 2010 G | 27.486 | 0 | 0 | $0 |
| Seymour S Preston III | Direktor | 1. April 2008 A | 33.862 | 0 | 0 | $0 |
| John D. Gottwald | Direktor | 8. Februar 2008 D | 0 | 0 | 0 | $0 |
| Lloyd B Andrew | Direktor | 4. Juni 2004 G | 10.287 | 0 | 0 | $0 |
| William B Allen JR | · | 17. Januar 2013 A | 19.557 | 0 | 0 | $0 |
| GOTTWALD FLOYD D JR | · | 12. Februar 2008 M | 1.402.784 | 0 | 0 | $0 |
Insider aus SEC-Einreichungen Form 3/4/5; Netto = nur P/S aus offenen Märkten
ETF-Besitz Gehalten von 110 ETFs
Gewichtung spiegelt nur direkte Aktienbestände (N-PORT) wider; gehebelte oder derivatbasierte Fonds können zusätzliche Swap-Exposure halten, die hier nicht angezeigt wird.
| Fonds | Gewicht | Anteile | Stand | Quelle |
|---|---|---|---|---|
| ILIT · iShares Trust | 7,80% | 9.276 SH | 11. September 2026 | Täglich |
| IDRV · iShares Trust | 3,63% | 44.078 SH | 11. September 2026 | Täglich |
| MINY · Tidal Trust II | 3,31% | 1.248 NS | 31. Juli 2026 | N-PORT |
| RSPM · Invesco Exchange-Traded Fund Trust | 3,07% | 59.254 SH | 23. Oktober 2026 | Täglich |
| NRES · DBX ETF Trust | 1,62% | 4.497 NS | 31. August 2026 | N-PORT |
| EPMB · Harbor ETF Trust | 1,42% | 552 NS | 31. Juli 2026 | N-PORT |
| IYM · iShares Trust | 1,42% | 137.237 SH | 11. September 2026 | Täglich |
| PBW · Invesco Exchange-Traded Fund Trust | 1,39% | 42.762 SH | 23. Oktober 2026 | Täglich |
| KNG · First Trust Exchange-Traded Fund IV | 1,38% | 413.478 NS | 31. Juli 2026 | N-PORT |
| CVAR · ETF Opportunities Trust | 1,14% | 4.145 NS | 31. Juli 2026 | N-PORT |
| PFF · iShares Trust | 1,12% | 2.811.818 SH | 11. September 2026 | Täglich |
| EPSB · Harbor ETF Trust | 1,09% | 442 NS | 31. Juli 2026 | N-PORT |
| VAW · VANGUARD WORLD FUND | 1,04% | 345.791 SH | 19. August 2026 | Täglich |
| EPMV · Harbor ETF Trust | 1,02% | 405 NS | 31. Juli 2026 | N-PORT |
| FMAT · FIDELITY COVINGTON TRUST | 0,93% | 45.978 NS | 31. Juli 2026 | N-PORT |
| ICAP · Series Portfolios Trust | 0,82% | 7.239 NS | 31. August 2026 | N-PORT |
| FXZ · First Trust Exchange-Traded AlphaDE… | 0,74% | 23.211 NS | 31. Juli 2026 | N-PORT |
| SPHB · Invesco Exchange-Traded Fund Trust … | 0,59% | 51.600 SH | 23. Oktober 2026 | Täglich |
| ALTL · Pacer Funds Trust | 0,53% | 4.175 NS | 31. Juli 2026 | N-PORT |
| IQSM · New York Life Investments ETF Trust | 0,51% | 14.290 NS | 31. Juli 2026 | N-PORT |
| BRNY · EA Series Trust | 0,48% | 23.706 NS | 31. Juli 2026 | N-PORT |
| BRES · EA Series Trust | 0,48% | 27.730 NS | 31. Juli 2026 | N-PORT |
| MXI · iShares Trust | 0,45% | 14.996 SH | 11. September 2026 | Täglich |
| PALC · Pacer Funds Trust | 0,39% | 6.891 NS | 31. Juli 2026 | N-PORT |
| HIBL · Direxion Shares ETF Trust | 0,36% | 2.307 NS | 31. Juli 2026 | N-PORT |
| BKMC · BNY Mellon ETF Trust | 0,35% | 19.304 NS | 31. Juli 2026 | N-PORT |
| BBMC · J.P. Morgan Exchange-Traded Fund Tr… | 0,30% | 51.428 NS | 31. Juli 2026 | N-PORT |
| SNPD · DBX ETF Trust | 0,28% | 63 NS | 31. August 2026 | N-PORT |
| XT · iShares Trust | 0,27% | 84.754 SH | 11. September 2026 | Täglich |
| LGDX · Tidal Trust III | 0,25% | 2.970 NS | 31. Juli 2026 | N-PORT |
| ESML · iShares Trust | 0,23% | 51.784 SH | 11. September 2026 | Täglich |
| VBK · VANGUARD INDEX FUNDS | 0,22% | 781.843 SH | 19. August 2026 | Täglich |
| JPME · J.P. Morgan Exchange-Traded Fund Tr… | 0,21% | 8.272 NS | 31. Juli 2026 | N-PORT |
| SMMD · iShares Trust | 0,20% | 62.840 SH | 11. September 2026 | Täglich |
| VB · VANGUARD INDEX FUNDS | 0,19% | 2.704.870 SH | 19. August 2026 | Täglich |
| EQAL · Invesco Exchange-Traded Fund Trust … | 0,18% | 15.658 SH | 23. Oktober 2026 | Täglich |
| VBR · VANGUARD INDEX FUNDS | 0,17% | 858.513 SH | 19. August 2026 | Täglich |
| RSP · Invesco Exchange-Traded Fund Trust | 0,14% | 1.559.278 SH | 23. Oktober 2026 | Täglich |
| IWS · iShares Trust | 0,14% | 175.747 SH | 11. September 2026 | Täglich |
| VFMO · VANGUARD WELLINGTON FUND | 0,14% | 20.763 SH | 19. August 2026 | Täglich |
| WSML · iShares Trust | 0,13% | 7.367 SH | 11. September 2026 | Täglich |
| IWR · iShares Trust | 0,11% | 483.026 SH | 11. September 2026 | Täglich |
| IMCG · iShares Trust | 0,11% | 34.531 SH | 11. September 2026 | Täglich |
| IMCB · iShares Trust | 0,10% | 13.701 SH | 11. September 2026 | Täglich |
| IMCV · iShares Trust | 0,09% | 8.921 SH | 11. September 2026 | Täglich |
| FDMO · FIDELITY COVINGTON TRUST | 0,09% | 6.903 NS | 31. Juli 2026 | N-PORT |
| DFAS · Dimensional ETF Trust | 0,08% | 107.653 NS | 31. Juli 2026 | N-PORT |
| XOEF · iShares Trust | 0,08% | 147 SH | 11. September 2026 | Täglich |
| VIG · VANGUARD SPECIALIZED FUNDS | 0,07% | 666.264 SH | 19. August 2026 | Täglich |
| VYM · VANGUARD WHITEHALL FUNDS | 0,07% | 469.731 SH | 19. August 2026 | Täglich |
| DFUV · Dimensional ETF Trust | 0,06% | 75.712 NS | 31. Juli 2026 | N-PORT |
| VOOV · VANGUARD ADMIRAL FUNDS | 0,05% | 27.238 SH | 19. August 2026 | Täglich |
| IVE · iShares Trust | 0,05% | 195.426 SH | 11. September 2026 | Täglich |
| IUSV · iShares Trust | 0,05% | 103.384 SH | 11. September 2026 | Täglich |
| DFSU · Dimensional ETF Trust | 0,04% | 8.381 NS | 31. Juli 2026 | N-PORT |
| DFAC · Dimensional ETF Trust | 0,04% | 175.480 NS | 31. Juli 2026 | N-PORT |
| DSI · iShares Trust | 0,04% | 17.841 SH | 11. September 2026 | Täglich |
| VONV · VANGUARD SCOTTSDALE FUNDS | 0,04% | 71.125 SH | 19. August 2026 | Täglich |
| MNZL · EA Series Trust | 0,04% | 88 NS | 31. Juli 2026 | N-PORT |
| IWD · iShares Trust | 0,04% | 263.696 SH | 11. September 2026 | Täglich |
| PFM · Invesco Exchange-Traded Fund Trust | 0,04% | 3.347 SH | 23. Oktober 2026 | Täglich |
| SNPE · DBX ETF Trust | 0,04% | 8.367 NS | 31. August 2026 | N-PORT |
| DXUV · Dimensional ETF Trust | 0,03% | 1.594 NS | 31. Juli 2026 | N-PORT |
| DCOR · Dimensional ETF Trust | 0,03% | 8.662 NS | 31. Juli 2026 | N-PORT |
| ESG · FlexShares Trust | 0,03% | 330 NS | 31. Juli 2026 | N-PORT |
| DFLV · Dimensional ETF Trust | 0,03% | 15.160 NS | 31. Juli 2026 | N-PORT |
| TOPC · iShares Trust | 0,03% | 70 SH | 11. September 2026 | Täglich |
| DFAU · Dimensional ETF Trust | 0,03% | 26.909 NS | 31. Juli 2026 | N-PORT |
| XVV · iShares Trust | 0,02% | 1.357 SH | 11. September 2026 | Täglich |
| ILCG · iShares Trust | 0,02% | 6.127 SH | 11. September 2026 | Täglich |
| PRF · Invesco Exchange-Traded Fund Trust | 0,02% | 24.507 SH | 23. Oktober 2026 | Täglich |
| IVV · iShares Trust | 0,02% | 1.486.214 SH | 11. September 2026 | Täglich |
| ILCB · iShares Trust | 0,02% | 2.269 SH | 11. September 2026 | Täglich |
| PTLC · Pacer Funds Trust | 0,02% | 5.966 NS | 31. Juli 2026 | N-PORT |
| VOTE · TCW ETF Trust | 0,02% | 1.982 NS | 31. Juli 2026 | N-PORT |
| RWL · Invesco Exchange-Traded Fund Trust … | 0,02% | 23.732 SH | 23. Oktober 2026 | Täglich |
| IUS · Invesco Exchange-Traded Self-Indexe… | 0,02% | 2.277 SH | 23. Oktober 2026 | Täglich |
| DFUS · Dimensional ETF Trust | 0,02% | 36.586 NS | 31. Juli 2026 | N-PORT |
| IWB · iShares Trust | 0,02% | 81.415 SH | 11. September 2026 | Täglich |
| IYY · iShares Trust | 0,02% | 5.018 SH | 11. September 2026 | Täglich |
| VOO · VANGUARD INDEX FUNDS | 0,02% | 3.061.467 SH | 19. August 2026 | Täglich |
| VTI · VANGUARD INDEX FUNDS | 0,02% | 3.745.035 SH | 19. August 2026 | Täglich |
| VONE · VANGUARD SCOTTSDALE FUNDS | 0,02% | 19.311 SH | 19. August 2026 | Täglich |
| VTHR · VANGUARD SCOTTSDALE FUNDS | 0,02% | 9.940 SH | 19. August 2026 | Täglich |
| TOV · EA Series Trust | 0,02% | 471 NS | 31. Juli 2026 | N-PORT |
| IWV · iShares Trust | 0,02% | 32.778 SH | 11. September 2026 | Täglich |
| SPUU · Direxion Shares ETF Trust | 0,02% | 445 NS | 31. Juli 2026 | N-PORT |
| ITOT · iShares Trust | 0,02% | 153.136 SH | 11. September 2026 | Täglich |
| QDPL · Pacer Funds Trust | 0,02% | 2.833 NS | 31. Juli 2026 | N-PORT |
| QVML · Invesco Exchange-Traded Fund Trust … | 0,02% | 3.584 SH | 23. Oktober 2026 | Täglich |
| ILCV · iShares Trust | 0,02% | 2.106 SH | 11. September 2026 | Täglich |
| VOXP · Advisors Series Trust | 0,02% | 9 NS | 31. Juli 2026 | N-PORT |
| TILT · FlexShares Trust | 0,02% | 3.318 NS | 31. Juli 2026 | N-PORT |
| HCMT · Direxion Shares ETF Trust | 0,02% | 826 NS | 31. Juli 2026 | N-PORT |
| DEUS · DBX ETF Trust | 0,02% | 385 NS | 31. August 2026 | N-PORT |
| PBP · Invesco Exchange-Traded Fund Trust | 0,02% | 707 SH | 23. Oktober 2026 | Täglich |
| SPXL · Direxion Shares ETF Trust | 0,02% | 9.220 NS | 31. Juli 2026 | N-PORT |
| PHDG · Invesco Actively Managed Exchange-T… | 0,01% | 94 SH | 23. Oktober 2026 | Täglich |
| SPXD · DBX ETF Trust | 0,01% | 6 NS | 31. August 2026 | N-PORT |
| VT · VANGUARD INTERNATIONAL EQUITY INDEX… | 0,01% | 99.956 SH | 19. August 2026 | Täglich |
| DYNF · BlackRock ETF Trust | 0,01% | 33.740 SH | 11. September 2026 | Täglich |
| ACVF · ETF Opportunities Trust | 0,01% | 114 NS | 31. Juli 2026 | N-PORT |
| OMFL · Invesco Exchange-Traded Self-Indexe… | 0,01% | 2.916 SH | 22. Oktober 2026 | Täglich |
| BSMQ · Invesco Exchange-Traded Self-Indexe… | 0,00% | 5.000 | 21. Oktober 2026 | Täglich |
| BIV · VANGUARD BOND INDEX FUNDS | · | · | 15. Juli 2026 | Täglich |
| BND · VANGUARD BOND INDEX FUNDS | · | · | 15. Juli 2026 | Täglich |
| VCIT · VANGUARD SCOTTSDALE FUNDS | · | · | 15. Juli 2026 | Täglich |
| VTC · VANGUARD SCOTTSDALE FUNDS | · | · | 30. Juli 2026 | Täglich |
| BNDW · VANGUARD SCOTTSDALE FUNDS | · | · | 14. Juli 2026 | Täglich |
| SMLF · iShares Trust | · | 56.630 SH | 11. September 2026 | Täglich |
ALB Analysten-Konsens Bullische und bärische Analystenmeinungen, 12-Monats-Kursziel, Aufwärtspotenzial
12-Monats-Kursziel
21 Analysten · 2026-10-27Mittelwert-Ziel $156.35 +67,4%
Peer-Vergleich (GICS-Subbranche) Wichtige Kennzahlen im Vergleich zu Branchenkollegen
FY-Basis, Kurse zum Schlusskurs am Ende des letzten Geschäftsjahres jedes Unternehmens.
| Ticker | Marktkapitalisierung | P/E | Umsatz Vj. | Nettomarge | ROE | Bruttogewinnmarge |
|---|---|---|---|---|---|---|
| ALB | · | -24.6 | -4.4% | · | · | · |
| SHW | $80.26B | 31.6 | 2.1% | 10.9% | 57.1% | 48.9% |
| ECL | $74.03B | 36.1 | 2.2% | 12.9% | 22.4% | · |
| PPG | $22.89B | 14.8 | 0.19% | 9.9% | 21.4% | · |
| IFF | $17.23B | -47.8 | -5.2% | -3.3% | -2.6% | 36.2% |
| RPM | $13.53B | 20.5 | 6.7% | 8.4% | 21.3% | 41.4% |
| SOLS | $7.71B | 32.6 | 3.1% | 6.1% | 10.2% | · |
| ESI | $6.74B | 31.6 | 3.8% | 7.5% | 7.5% | 42.0% |
| NEU | $6.46B | 15.5 | -2.2% | 15.4% | 24.7% | 31.5% |
| EMN | $14.29B | 15.6 | -6.7% | 5.4% | 8.1% | 21.1% |
| AXTA | $6.89B | 18.6 | -3.0% | 7.4% | 17.8% | · |
Neueste Nachrichten Aktuelle Schlagzeilen über dieses Unternehmen
Meine Kennzahlen Ihre persönliche Watchlist — ausgewählte Zeilen aus den vollständigen Fundamentaldaten
Wählen Sie die Kennzahlen, die für Sie wichtig sind — klicken Sie auf das + neben jeder Zeile in den vollständigen Fundamentaldaten oben.
Ihre Auswahl wird gespeichert und begleitet Sie über alle Ticker hinweg.