
NSC Norfolk Southern Corporation Common Stock
NYSE · Road & Rail · Auf SEC EDGAR ansehen ↗ 10-K/10-Q Okt 22, 2026NSC Aktien-Snapshot Kurs, Marktkapitalisierung, P/E, EPS, ROE, Schulden/Eigenkapital, 52-Wochen-Spanne
NSC Aktienkurs-Chart Täglich OHLCV mit technischen Indikatoren — Schwenken, Zoom und Ansicht anpassen
Die Balkengranularität passt sich der ausgewählten Periode an – bewegen Sie den Mauszeiger über das Diagramm, um Eröffnungs-/Höchst-/Tiefst-/Schlusskurse für einen Balken anzuzeigen.
| Ex-Datum | Split | Typ |
|---|---|---|
| 10. Oktober 1997 | 3-for-1 | Vorwärts |
| 7. April 1987 | 3-for-1 | Vorwärts |
Über Norfolk Southern Corporation Common Stock Unternehmensübersicht von Wikipedia
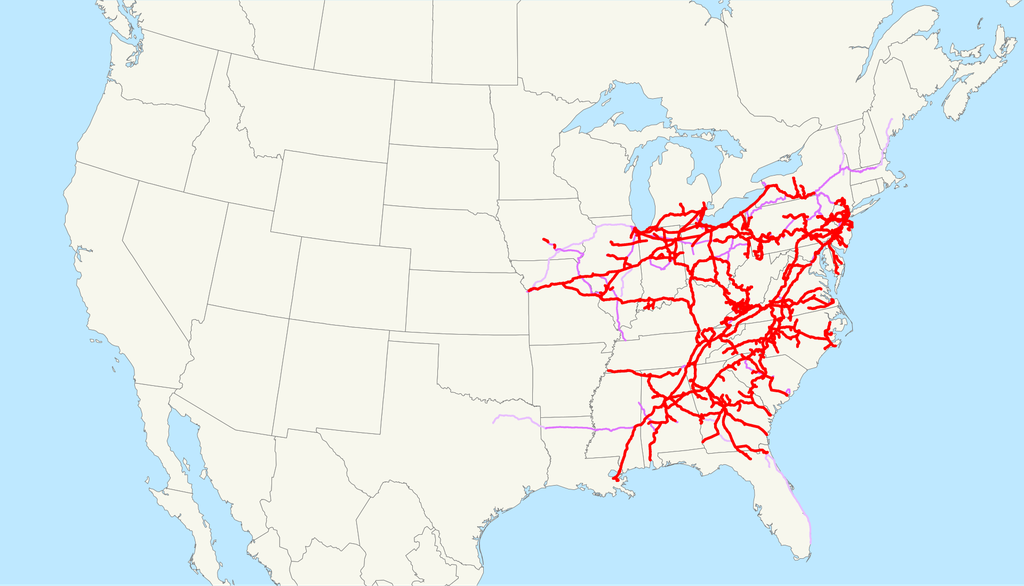
Die Norfolk Southern Corporation ist eine amerikanische Holdinggesellschaft im Bereich des Schienenverkehrs. Sitz des Unternehmens ist Norfolk (Virginia).
Geschichte
Ende der 1970er Jahre begann eine Konsolidierung im Schienenverkehr im Osten der Vereinigten Staaten. Aus der Penn Central und weiteren bankrotten Bahngesellschaften war die staatliche Conrail gebildet worden. Anderseits ging das Chessie System mit Seaboard Coast Line Industries zusammen. Die beiden verbliebenen großen Bahngesellschaften Norfolk and Western Railway und Southern Railway begannen deshalb ebenfalls eine Fusion ins Auge zu fassen. Am 23. Juli 1980 wurde dann die Norfolk Southern Corporation gegründet. Mit Wirkung vom 1. Juni 1982 übernahm das Unternehmen durch einen Aktientausch die Mehrheit an den Bahnunternehmen Norfolk and Western Railway und Southern Railway. Dabei erhielten die Aktionäre der N&W für jede N&W-Aktie eine NSC-Aktie und die SR-Aktionäre für jede Aktie 1,9 NSC-Aktien. Die Vorzugsaktien der Southern Railway wurden nicht umgetauscht.
Mit Wirkung vom 31. Dezember 1990 wurde die Norfolk and Western eine Tochtergesellschaft der Southern Railway und es erfolgte die Umbenennung in Norfolk Southern Railway. Nach Abschluss dieser Transaktion befinden sich alle Stammaktien und 7,1 % der Vorzugsaktien der Norfolk Southern Railway im Besitz der Norfolk Southern Corporation. Damit hat sie eine Stimmmehrheit von 94,3 %.
Am 21. Juni 1985 übernahm Norfolk Southern für 369 Millionen Dollar die Mehrheit am Güterkraftverkehrskonzern North American Van Lines Inc. (NAVL) von PepsiCo. Ziel war der Aufbau eines integrierten Transportunternehmens, dass umfassende Transportlösungen anbieten konnte. Dazu wurde dann 1986 das Tochterunternehmen Triple Crown Services Company gegründet. Dieses Unternehmen spezialisierte sich auf den Schienentransport von Lastkraftwagen und Aufliegern. North American Van Lines erwies sich nicht so profitabel wie erwartet, deshalb wurde 1993 Teile des Unternehmens und 1998 das ganze Unternehmen wieder veräußert.
1997/1998 erfolgte die Aufspaltung von Conrail zwischen Norfolk Southern und der CSX Corporation. Seitdem sind diese beiden Bahngesellschaften marktbeherrschend im Schienenverkehr östlich des Mississippi.
1999 erfolgte die Gründung des Tochterunternehmens Thoroughbred Technology and Telecommunications Inc. Unter dem Markennamen T-Cubed werden Telekommunikationsdienstleistungen angeboten. Dafür nutzt das Unternehmen eigene Glasfasernetze die entlang der Bahnstrecken verlegt wurden.
Im Juli 2025 vereinbarte die Norfolk Southern Corporation ihre Übernahme durch die größere Union Pacific Corporation im Wege einer Fusion für 85 Milliarden US-Dollar, zahlbar teils in von Union Pacific neu ausgegebenen Aktien, teils in bar. Falls die Kontrollbehörde Surface Transportation Board diese bisher größte Übernahme in der Geschichte der nordamerikanischen Eisenbahnbranche genehmigt, entstünde der erste Güterbahnbetreiber der USA, der die Ost- und Westküste der Vereinigten Staaten verbindet. Über diese Fusion werden als Mitglieder des Boards Patrick J. Fuchs, Michelle A. Schultz, Richard J. Kloster und Karen Hedlund entscheiden.
Unternehmensstruktur
Zum Zeitpunkt der Gründung der Norfolk Southern Corporation verfügten beide Bahngesellschaften über eine umfangreiche Anzahl von Tochtergesellschaften. Die meisten davon waren Bahngesellschaften, die aus den verschiedensten Gründen nicht mit der Muttergesellschaft verschmolzen wurden. Auch heute noch verfügt die Gesellschaft über einen hohen Bestand an solchen Bahngesellschaften, die noch auf dem Papier existieren und in den Konzernabschluss einbezogen werden, aber keine selbstständige Außenwirkung mehr entfalten.
Unternehmensleitung
Präsident und Chief Executive Officer
1982–1987: Robert B. Claytor
1987–1992: Arnold B. McKinnon
1992–2005: David R. Goode (ab 1991 Präsident)
-
November 2005 – 1. Juni 2015: Charles W. Moorman (ab 2004 Präsident)
-
Juni 2015–1. Mai 2022: James A. Squires (seit 2013 Präsident)
-
Mai 2022–11. September 2024: Alan H. Shaw (ab 1. Dezember 2021 Präsident)
seit 11. September 2024: Mark R. George (ab 11. September 2024 Präsident)
Chairman of the Board
1982–1987: Robert B. Claytor
1987–1992: Arnold B. McKinnon
1992–2006: David R. Goode
-
Februar 2006–1. Oktober 2015: Charles W. Moorman
-
Oktober 2015–1. Mai 2022: James A. Squires
-
Mai 2022-9. Mai 2024: Amy E. Miles
-
Mai 2024–3. Juni 2025: Claude Mongeau
Quelle: Wikipedia, CC BY-SA 4.0 · Auf Wikipedia ansehen ↗
10-Jahres-Performance Umsatz-, Nettoergebnis-, Margen- und EPS-Trends
Bewertung P/E-, P/S-, P/B-, EV/EBITDA-Verhältnisse — ist die Aktie teuer oder günstig?
| Kennzahl | 5-Jahres-Trend | NSC | 5-Jahres-Durchschnitt | Peer-Median | Fazit |
|---|---|---|---|---|---|
| P/E (TTM) | 28.35-Jahres-Durchschnitt ≈22.9 | ≈22.9 | · | · | |
| P/S (TTM) | 5.85-Jahres-Durchschnitt ≈5.0 | ≈5.0 | 5.5 | Fairer Wert | |
| K/B (MRQ) | 4.55-Jahres-Durchschnitt ≈4.3 | ≈4.3 | · | · | |
| Kurs / FCF (TTM) | 46.05-Jahres-Durchschnitt ≈35.3 | ≈35.3 | · | · | |
| Kurs / Cashflow (TTM) | 20.05-Jahres-Durchschnitt ≈15.0 | ≈15.0 | · | · | |
| Price / Tangible Book (Kurs / Materieller Buchwert) | 4.95-Jahres-Durchschnitt ≈4.3 | ≈4.3 | · | · | |
| PEG Ratio (PEG-Ratio) | ≈2.8 | · | · | · |
Der Median der Vergleichsgruppe wird pro Kennzahl standardisiert berechnet und stimmt möglicherweise nicht immer mit der für diese Aktie angezeigten TTM/MRQ-Basis überein.
Rentabilität Brutto-, Betriebs- und Nettomargen; ROE, ROA, ROIC
| Kennzahl | 5-Jahres-Trend | NSC | 5-Jahres-Durchschnitt | Peer-Median | Fazit |
|---|---|---|---|---|---|
| Betriebsgewinnmarge (TTM) | 31.5%5-Jahres-Durchschnitt ≈34.1% | ≈34.1% | · | · | |
| EBITDA-Marge (TTM) | 42.5%5-Jahres-Durchschnitt ≈44.8% | ≈44.8% | 36.8% | Schwach | |
| Vorgewinnmarge (TTM) | 26.4%5-Jahres-Durchschnitt ≈28.8% | ≈28.8% | 31.2% | Schwach | |
| Nettogewinnmarge (TTM) | 20.7%5-Jahres-Durchschnitt ≈22.6% | ≈22.6% | 23.9% | Schwach | |
| ROA (TTM) | 5.9%5-Jahres-Durchschnitt ≈6.7% | ≈6.7% | 6.6% | Schwach | |
| ROE (TTM) | 16.8%5-Jahres-Durchschnitt ≈19.8% | ≈19.8% | 20.8% | Schwach | |
| ROIC | 22.0%5-Jahres-Durchschnitt ≈23.4% | ≈23.4% | · | · |
Finanzielle Gesundheit Verschuldung, Liquidität, Solvenz — Bilanzstärke
| Kennzahl | 5-Jahres-Trend | NSC | 5-Jahres-Durchschnitt | Peer-Median | Fazit |
|---|---|---|---|---|---|
| Liquiditätsgrad (MRQ) | 0.95-Jahres-Durchschnitt ≈0.9 | ≈0.9 | 0.9 | Im Einklang | |
| Quick Ratio | 0.75-Jahres-Durchschnitt ≈0.8 | ≈0.8 | 0.6 | Starke Liquidität |
Wachstum Umsatz-, EPS- und Nettoergebniswachstum: YoY, 3-Jahres-CAGR, 5-Jahres-CAGR
| Kennzahl | 5-Jahres-Trend | NSC | 5-Jahres-Durchschnitt | Peer-Median | Fazit |
|---|---|---|---|---|---|
| Revenue YoY (Umsatz YoY) | 0.47%5-Jahres-Durchschnitt ≈4.8% | ≈4.8% | · | · | |
| Revenue CAGR 3Y (Umsatz CAGR 3J) | -1.5%5-Jahres-Durchschnitt ≈2.9% | ≈2.9% | · | · | |
| Revenue CAGR 5Y (Umsatz CAGR 5J) | 4.5% | · | · | · | |
| EPS YoY (EPS VjV) | 10.2%5-Jahres-Durchschnitt ≈16.3% | ≈16.3% | · | · | |
| Net Income YoY (Nettogewinn YoY) | 9.6%5-Jahres-Durchschnitt ≈13.4% | ≈13.4% | · | · | |
| EPS CAGR 3Y (EPS CAGR 3J) | -2.8%5-Jahres-Durchschnitt ≈-1.2% | ≈-1.2% | · | · | |
| EPS CAGR 5Y (EPS CAGR 5J) | 10.2% | · | · | · | |
| Net Income CAGR 3Y (Nettoergebnis CAGR 3J) | -4.2%5-Jahres-Durchschnitt ≈-3.9% | ≈-3.9% | · | · | |
| Net Income CAGR 5Y (Nettoergebnis CAGR 5J) | 7.4% | · | · | · |
Kapitaleffizienz Umsatz pro Vermögenswert, Lagerumschlag, Forderungsumschlag
| Kennzahl | 5-Jahres-Trend | NSC | 5-Jahres-Durchschnitt | Peer-Median | Fazit |
|---|---|---|---|---|---|
| Asset Turnover (Umsatz / Vermögenswerte) | 0.35-Jahres-Durchschnitt ≈0.3 | ≈0.3 | 0.3 | Schwach | |
| Receivables Turnover (Forderungsumschlag) | 11.85-Jahres-Durchschnitt ≈11.5 | ≈11.5 | · | · | |
| Revenue / Employee (Umsatz / Mitarbeiter) | ≈$631.1K | · | · | · |
Wert · ≈ 5-Jahres-Durchschnitt · Branchenmedian · Urteil relativ zum Median
Dividenden Rendite, Ausschüttungsquote, Dividendenhistorie, 5-Jahres-CAGR
| Ex-Datum | Betrag | Währung | Rendite |
|---|---|---|---|
| Aug 7, 2026 | $1,35 | USD | ≈1.6% |
| Mai 8, 2026 | $1,35 | USD | ≈1.7% |
| Feb 6, 2026 | $1,35 | USD | ≈1.8% |
| Nov 7, 2025 | $1,35 | USD | ≈1.9% |
| Aug 1, 2025 | $1,35 | USD | ≈2.0% |
| Mai 2, 2025 | $1,35 | USD | ≈2.4% |
| Feb 7, 2025 | $1,35 | USD | ≈2.2% |
| Nov 1, 2024 | $1,35 | USD | ≈2.2% |
| Aug 2, 2024 | $1,35 | USD | ≈2.2% |
| Mai 2, 2024 | $1,35 | USD | ≈2.3% |
| Feb 1, 2024 | $1,35 | USD | ≈2.1% |
| Nov 2, 2023 | $1,35 | USD | ≈2.8% |
| Aug 3, 2023 | $1,35 | USD | ≈2.3% |
| Mai 4, 2023 | $1,35 | USD | ≈2.5% |
| Feb 2, 2023 | $1,35 | USD | ≈2.0% |
| Nov 3, 2022 | $1,24 | USD | ≈2.2% |
| Aug 5, 2022 | $1,24 | USD | ≈1.9% |
| Mai 5, 2022 | $1,24 | USD | ≈1.8% |
| Feb 3, 2022 | $1,24 | USD | ≈1.6% |
| Nov 4, 2021 | $1,09 | USD | ≈1.5% |
Ergebnisverlauf EPS Ist vs. Schätzung, Überraschung %, Beat-Rate, nächstes Ergebnisdatum
| Zeitraum | Bericht | EPS Actual | EPS est. | Überraschung |
|---|---|---|---|---|
| 30. September 2026 | Okt 21, 2026 | $3.62 | $3.51 | 3.3% |
| 30. Juni 2026 | Jul 27, 2026 | $3.52 | $3.34 | 5.3% |
| 31. März 2026 | $2.65 | $2.54 | 4.5% | |
| 31. Dezember 2025 | $3.22 | $2.79 | 15.4% | |
| 30. September 2025 | $3.30 | $3.22 | 2.5% | |
| 30. Juni 2025 | $3.29 | $3.34 | -1.4% | |
| 31. März 2025 | $2.69 | $2.72 | -0.99% |
Vollständige Fundamentaldaten Alle Kennzahlen nach Jahr — Gewinn- und Verlustrechnung, Bilanz, Cashflow
Gewinn- und Verlustrechnung
| Kennzahl | Trend | 2025 | 2024 | 2023 | 2022 | 2021 | 2020 | 2019 | 2018 | 2017 | 2016 | 2015 | 2014 |
|---|---|---|---|---|---|---|---|---|---|---|---|---|---|
| Revenue | $12.18B | $12.12B | $12.16B | $12.74B | $11.14B | $9.79B | $11.30B | $11.46B | $10.55B | $9.89B | $10.51B | $11.62B | |
| Operating Expenses | $7.82B | $8.05B | $9.30B | $7.94B | $6.70B | $6.79B | $7.31B | $7.50B | $7.03B | $6.88B | $7.63B | $8.05B | |
| Operating Income | $4.36B | $4.07B | $2.85B | $4.81B | $4.45B | $3.00B | $3.99B | $3.96B | $3.52B | $3.01B | $2.88B | $3.58B | |
| Interest Expense | · | $807M | $722M | $692M | $646M | $625M | $604M | $557M | $550M | $563M | $545M | $545M | |
| Interest Income | · | · | · | · | · | · | · | · | $13M | $10M | $8M | $9M | |
| Other Non-op | $101M | $65M | $191M | $13M | $77M | $153M | $106M | $67M | $156M | $136M | $103M | $104M | |
| Pretax Income | $3.67B | $3.33B | $2.32B | $4.13B | $3.88B | $2.53B | $3.49B | $3.47B | $3.13B | $2.58B | $2.44B | $3.13B | |
| Income Tax | $792M | $707M | $493M | $860M | $873M | $517M | $769M | $803M | $-2.28B | $914M | $886M | $1.13B | |
| Net Income | $2.87B | $2.62B | $1.83B | $3.27B | $3.00B | $2.01B | $2.72B | $2.67B | $5.40B | $1.67B | $1.56B | $2.00B | |
| EPS (Basic) | $12.76 | $11.58 | $8.04 | $13.92 | $12.16 | $7.88 | $10.32 | $9.58 | $18.76 | $5.66 | $5.13 | $6.44 | |
| EPS (Diluted) | $12.75 | $11.57 | $8.02 | $13.88 | $12.11 | $7.84 | $10.25 | $9.51 | $18.61 | $5.62 | $5.10 | $6.39 | |
| Shares (Basic) | 225,000,000 | 226,100,000 | 226,900,000 | 234,800,000 | 246,900,000 | 255,100,000 | 263,300,000 | 277,700,000 | 287,900,000 | 293,900,000 | 301,900,000 | 309,400,000 | |
| Shares (Diluted) | 225,300,000 | 226,400,000 | 227,400,000 | 235,600,000 | 248,100,000 | 256,600,000 | 265,600,000 | 280,200,000 | 290,300,000 | 296,000,000 | 304,400,000 | 312,500,000 | |
| EBITDA | $5.75B | $5.42B | $4.15B | $6.03B | $5.63B | $4.16B | $5.13B | $5.06B | $3.59B | $3.07B | $2.88B | $3.58B |
Bilanz
| Kennzahl | Trend | 2025 | 2024 | 2023 | 2022 | 2021 | 2020 | 2019 | 2018 | 2017 | 2016 | 2015 | 2014 |
|---|---|---|---|---|---|---|---|---|---|---|---|---|---|
| Cash & Equivalents | $1.53B | $1.64B | $1.57B | $456M | $839M | $1.11B | $580M | $358M | $690M | $956M | $1.10B | $973M | |
| Short-term Investments | · | · | · | · | · | · | · | · | · | · | · | $0 | |
| Receivables | $988M | $1.07B | $1.15B | $1.15B | $976M | $848M | $920M | $1.01B | $955M | $945M | $946M | $1.05B | |
| Other Current Assets | $409M | $201M | $292M | $150M | $134M | $134M | $337M | $288M | $282M | $133M | $194M | $347M | |
| Current Assets | $3.20B | $3.19B | $3.27B | $2.01B | $2.17B | $2.32B | $2.08B | $1.86B | $2.15B | $2.29B | $2.51B | $2.78B | |
| PP&E (Net) | $36.48B | $35.83B | $33.33B | $32.16B | $31.65B | $31.34B | $31.61B | $31.09B | $30.33B | $29.75B | $28.99B | $27.69B | |
| PP&E (Gross) | $51.10B | $49.79B | $46.59B | $44.75B | $43.68B | $43.33B | $43.60B | $43.47B | $42.24B | $41.49B | $40.47B | $38.51B | |
| Accum. Depreciation | $14.62B | $13.96B | $13.27B | $12.59B | $12.03B | $11.98B | $11.98B | $12.37B | $11.91B | $11.74B | $11.48B | $10.81B | |
| Other Non-current Assets | $1.47B | $1.29B | $1.22B | $1.03B | $966M | $709M | $800M | $177M | $251M | $73M | $63M | $49M | |
| Total Assets | $45.24B | $43.68B | $41.65B | $38.88B | $38.49B | $37.96B | $37.92B | $36.24B | $35.71B | $34.89B | $34.14B | $33.20B | |
| Accounts Payable | $1.86B | $1.70B | $1.64B | $1.29B | $1.35B | $1.02B | $1.43B | $1.50B | $1.40B | $1.22B | $1.09B | $1.23B | |
| Short-term Debt | · | · | $0 | $100M | $0 | · | · | $0 | $100M | $100M | $200M | $100M | |
| Current Liabilities | $3.77B | $3.54B | $2.63B | $2.65B | $2.52B | $2.16B | $2.30B | $2.59B | $2.54B | $2.34B | $2.23B | $1.78B | |
| Capital Leases | $148M | $191M | $287M | $316M | $331M | $344M | $441M | $0 | · | · | · | · | |
| Deferred Tax | $7.71B | $7.42B | $7.22B | $7.26B | $7.17B | $6.92B | $6.82B | $6.46B | $6.32B | $9.14B | $8.94B | $8.82B | |
| Other Non-current Liabilities | $1.72B | $1.76B | $1.84B | $1.76B | $1.88B | $1.99B | $1.74B | $1.27B | $1.35B | $1.44B | $1.39B | $1.31B | |
| Total Liabilities | $29.69B | $29.38B | $28.87B | $26.15B | $24.85B | $23.17B | $22.74B | $20.88B | $19.35B | $22.48B | $21.95B | $20.79B | |
| Long-term Debt | · | · | · | · | · | · | · | · | $9.74B | $10.11B | $9.89B | $8.88B | |
| Total Debt | · | · | $0 | $100M | · | · | · | $0 | $100M | $100M | $200M | $100M | |
| Paid-in Capital | $2.30B | $2.25B | $2.18B | $2.16B | $2.21B | $2.25B | $2.21B | $2.22B | $2.25B | $2.18B | $2.14B | $2.15B | |
| Retained Earnings | $13.23B | $12.09B | $10.70B | $10.70B | $11.59B | $12.88B | $13.21B | $13.44B | $14.18B | $10.43B | $10.19B | $10.35B | |
| Treasury Stock | $19M | $19M | $19M | $19M | $19M | $19M | $19M | $19M | $19M | $19M | $19M | $19M | |
| AOCI | $-210M | $-262M | $-320M | $-351M | $-402M | $-594M | $-491M | $-563M | $-356M | $-487M | $-445M | $-398M | |
| Stockholders' Equity | $15.55B | $14.31B | $12.78B | $12.73B | $13.64B | $14.79B | $15.18B | $15.36B | $16.36B | $12.41B | $12.19B | $12.41B | |
| Liabilities + Equity | $45.24B | $43.68B | $41.65B | $38.88B | $38.49B | $37.96B | $37.92B | $36.24B | $35.71B | $34.89B | $34.14B | $33.20B | |
| Shares Outstanding | 224,420,699 | 226,320,894 | 225,681,254 | 228,076,415 | 240,162,790 | 252,095,082 | 257,904,956 | 268,098,472 | 284,157,187 | 290,417,610 | 297,795,016 | 308,240,130 |
Cashflow
| Kennzahl | Trend | 2025 | 2024 | 2023 | 2022 | 2021 | 2020 | 2019 | 2018 | 2017 | 2016 | 2015 | 2014 |
|---|---|---|---|---|---|---|---|---|---|---|---|---|---|
| D&A | $1.39B | $1.35B | $1.30B | $1.22B | $1.18B | $1.15B | $1.14B | $1.10B | $1.06B | $1.03B | · | · | |
| Deferred Tax | $277M | $176M | $-49M | $83M | $184M | $142M | $330M | $173M | $-2.86B | $227M | $320M | $294M | |
| Other Non-cash | $-182M | $-99M | $103M | $-352M | $-115M | $328M | $-299M | $-217M | · | · | · | · | |
| Operating Cash Flow | $4.36B | $4.05B | $3.18B | $4.22B | $4.25B | $3.64B | $3.89B | $3.73B | $3.25B | $3.03B | $2.91B | $2.92B | |
| CapEx | $2.20B | $2.38B | $2.33B | $1.95B | $1.47B | $1.49B | $2.02B | $1.95B | $1.72B | $1.89B | $2.38B | $2.12B | |
| Investing Cash Flow | $-2.56B | $-2.78B | $-2.18B | $-1.60B | $-1.22B | $-1.18B | $-1.76B | $-1.66B | $-1.48B | $-1.83B | · | $-2.00B | |
| Stock Repurchased | $534M | $0 | $622M | $3.11B | $3.39B | $1.44B | $2.10B | $2.78B | $1.01B | $803M | $1.07B | $318M | |
| Net Stock Activity | $-534M | $0 | $-622M | $-3.11B | $-3.39B | $-1.44B | $-2.10B | $-2.78B | $-1.01B | $-803M | $-1.07B | $-318M | |
| Dividends Paid | $1.22B | $1.22B | $1.23B | $1.17B | $1.03B | $960M | $949M | $844M | $703M | $695M | $713M | $687M | |
| Financing Cash Flow | $-1.91B | $-1.20B | $115M | $-3.00B | $-3.31B | $-1.93B | $-1.99B | $-2.31B | $-2.04B | $-1.35B | · | $-1.32B | |
| Net Change in Cash | $-111M | $73M | $1.11B | $-383M | $-276M | $535M | $134M | $-244M | $-266M | $-145M | $128M | $-470M | |
| Taxes Paid | $491M | $305M | $681M | $750M | $654M | $311M | $543M | $519M | $705M | $593M | $386M | $1.10B | |
| Free Cash Flow | $2.16B | $1.67B | $830M | $2.27B | $2.79B | $2.14B | $1.87B | $1.77B | $1.53B | $1.15B | $492M | $734M | |
| Levered FCF | · | $1.04B | $261M | $1.73B | $2.28B | $1.65B | $1.40B | $1.35B | $580M | $783M | $145M | $386M |
Rentabilität
| Kennzahl | Trend | 2025 | 2024 | 2023 | 2022 | 2021 | 2020 | 2019 | 2018 | 2017 | 2016 | 2015 | 2014 |
|---|---|---|---|---|---|---|---|---|---|---|---|---|---|
| Operating Margin | 35.8% | 33.6% | 23.4% | 37.7% | 39.9% | 30.7% | 35.3% | 34.5% | 34.0% | 31.1% | 27.4% | 30.8% | |
| Net Margin | 23.6% | 21.6% | 15.0% | 25.7% | 27.0% | 20.6% | 24.1% | 23.3% | 51.2% | 16.9% | 14.8% | 17.2% | |
| Pretax Margin | 30.1% | 27.5% | 19.1% | 32.4% | 34.8% | 25.9% | 30.9% | 30.3% | 29.6% | 26.1% | 23.2% | 27.0% | |
| EBITDA Margin | 47.2% | 44.7% | 34.1% | 47.3% | 50.5% | 42.5% | 45.4% | 44.2% | 34.0% | 31.1% | 27.4% | 30.8% | |
| ROA | 6.5% | 6.2% | 4.5% | 8.5% | 7.9% | 5.3% | 7.3% | 7.4% | 15.3% | 4.8% | 4.6% | 6.1% | |
| ROE | 18.9% | 18.7% | 14.4% | 25.4% | 21.8% | 13.5% | 17.9% | 17.3% | 37.6% | 13.6% | 12.7% | 16.9% | |
| ROIC | 22.0% | 22.4% | 17.6% | 29.7% | 25.3% | 16.2% | 20.5% | 19.8% | 37.6% | 15.9% | 14.8% | 18.2% |
Liquidität & Solvenz
| Kennzahl | Trend | 2025 | 2024 | 2023 | 2022 | 2021 | 2020 | 2019 | 2018 | 2017 | 2016 | 2015 | 2014 |
|---|---|---|---|---|---|---|---|---|---|---|---|---|---|
| Current Ratio | 0.8 | 0.9 | 1.2 | 0.8 | 0.9 | 1.1 | 0.9 | 0.7 | 0.8 | 1.0 | 1.2 | 1.6 | |
| Quick Ratio | 0.7 | 0.8 | 1.0 | 0.6 | 0.7 | 0.9 | 0.7 | 0.5 | 0.6 | 0.8 | 0.9 | 1.1 | |
| Debt / Equity | · | · | 0.0 | 0.0 | · | · | · | 0.0 | 0.0 | 0.0 | 0.0 | 0.0 | |
| Interest Coverage | · | 5.0 | 3.9 | 6.9 | 6.9 | 4.8 | 6.6 | 7.1 | 6.5 | 5.5 | 5.3 | 6.6 |
Effizienz
| Kennzahl | Trend | 2025 | 2024 | 2023 | 2022 | 2021 | 2020 | 2019 | 2018 | 2017 | 2016 | 2015 | 2014 |
|---|---|---|---|---|---|---|---|---|---|---|---|---|---|
| Asset Turnover | 0.3 | 0.3 | 0.3 | 0.3 | 0.3 | 0.3 | 0.3 | 0.3 | 0.3 | 0.3 | 0.3 | 0.4 | |
| Receivables Turnover | 11.8 | 10.9 | 10.6 | 12.0 | 12.2 | 11.1 | 11.7 | 11.7 | 11.1 | 10.5 | 10.5 | 11.2 |
Pro Aktie
| Kennzahl | Trend | 2025 | 2024 | 2023 | 2022 | 2021 | 2020 | 2019 | 2018 | 2017 | 2016 | 2015 | 2014 |
|---|---|---|---|---|---|---|---|---|---|---|---|---|---|
| Book Value / Share | $69.28 | $63.21 | $56.63 | $55.83 | $56.80 | $58.67 | $58.87 | $57.30 | $57.57 | $42.73 | $40.93 | $40.25 | |
| Revenue / Share | $54.06 | $53.55 | $53.46 | $54.10 | $44.91 | $38.15 | $42.53 | $40.89 | $36.35 | $33.41 | · | · | |
| Cash Flow / Share | $19.36 | $17.90 | $13.98 | $17.92 | $17.15 | $14.17 | $14.65 | $13.30 | $11.21 | $10.25 | · | · | |
| Cash / Share | $6.82 | $7.25 | $6.95 | $2.00 | $3.49 | $4.42 | $2.25 | $1.34 | $2.43 | $3.29 | $3.70 | $3.16 | |
| Dividend / Share | $5.40 | $5.40 | $5.40 | $4.96 | $4.16 | $3.76 | $3.60 | $3.04 | $2.44 | $2.36 | $2.36 | $2.22 | |
| EPS (TTM) | $12.75 | $11.57 | $8.02 | $13.88 | $12.11 | $7.84 | $10.25 | $9.51 | $18.61 | $5.62 | $5.10 | $6.39 |
Wachstumsraten
| Kennzahl | Trend | 2025 | 2024 | 2023 | 2022 | 2021 | 2020 | 2019 | 2018 | 2017 | 2016 | 2015 | 2014 |
|---|---|---|---|---|---|---|---|---|---|---|---|---|---|
| Revenue YoY | 0.47% | -0.27% | -4.6% | 14.4% | 13.8% | · | · | · | · | · | · | · | |
| Revenue CAGR 3Y | -1.5% | 2.9% | 7.5% | · | · | · | · | · | · | · | · | · | |
| Revenue CAGR 5Y | 4.5% | · | · | · | · | · | · | · | · | · | · | · | |
| EPS YoY | 10.2% | 44.3% | -42.2% | 14.6% | 54.5% | · | · | · | · | · | · | · | |
| EPS CAGR 3Y | -2.8% | -1.5% | 0.76% | · | · | · | · | · | · | · | · | · | |
| EPS CAGR 5Y | 10.2% | · | · | · | · | · | · | · | · | · | · | · | |
| Net Income YoY | 9.6% | 43.5% | -44.1% | 8.8% | 49.3% | · | · | · | · | · | · | · | |
| Net Income CAGR 3Y | -4.2% | -4.4% | -3.2% | · | · | · | · | · | · | · | · | · | |
| Net Income CAGR 5Y | 7.4% | · | · | · | · | · | · | · | · | · | · | · | |
| Dividends Paid CAGR 5Y | 4.8% | · | · | · | · | · | · | · | · | · | · | · |
Bewertung (TTM)
| Kennzahl | Trend | 2025 | 2024 | 2023 | 2022 | 2021 | 2020 | 2019 | 2018 | 2017 | 2016 | 2015 | 2014 |
|---|---|---|---|---|---|---|---|---|---|---|---|---|---|
| Revenue TTM | $12.18B | $12.12B | $12.16B | $12.74B | $11.14B | $9.79B | $11.30B | $11.46B | $10.55B | $9.89B | $10.51B | $11.62B | |
| Net Income TTM | $2.87B | $2.62B | $1.83B | $3.27B | $3.00B | $2.01B | $2.72B | $2.67B | $5.40B | $1.67B | $1.56B | $2.00B | |
| Market Cap | $64.79B | $53.12B | $53.35B | $56.20B | $71.50B | $59.90B | $50.07B | $40.09B | $41.17B | $31.39B | $25.19B | $33.79B | |
| Enterprise Value | · | · | $51.78B | $55.85B | · | · | · | $39.73B | $40.58B | $30.53B | $24.29B | $32.91B | |
| P/E | 22.6 | 20.3 | 29.5 | 17.8 | 24.6 | 30.3 | 18.9 | 15.7 | 7.8 | 19.2 | 16.6 | 17.2 | |
| P/S | 5.3 | 4.4 | 4.4 | 4.4 | 6.4 | 6.1 | 4.4 | 3.5 | 3.9 | 3.2 | 2.4 | 2.9 | |
| P/B | 4.2 | 3.7 | 4.2 | 4.4 | 5.2 | 4.0 | 3.3 | 2.6 | 2.5 | 2.5 | 2.1 | 2.7 | |
| P / Tangible Book | 4.2 | 3.7 | 4.2 | 4.4 | 5.2 | 4.0 | · | · | · | · | · | · | |
| P / Cash Flow | 14.9 | 13.1 | 16.8 | 13.3 | 16.8 | 16.5 | 12.9 | 10.8 | 12.7 | 10.3 | 8.8 | 11.8 | |
| P / FCF | 30.0 | 31.8 | 64.3 | 24.7 | 25.7 | 28.0 | 26.7 | 22.6 | 26.9 | 27.4 | 51.2 | 46.0 | |
| EV / EBITDA | · | · | 12.5 | 9.3 | · | · | · | 7.8 | 11.3 | 9.9 | 8.4 | 9.2 | |
| EV / FCF | · | · | 62.4 | 24.6 | · | · | · | 22.4 | 26.5 | 26.6 | 49.4 | 44.8 | |
| EV / Revenue | · | · | 4.3 | 4.4 | · | · | · | 3.5 | 3.8 | 3.1 | 2.3 | 2.8 | |
| Dividend Yield | 1.9% | 2.3% | 2.3% | 2.1% | 1.4% | 1.6% | 1.9% | 2.1% | 1.7% | 2.2% | 2.8% | 2.0% | |
| Earnings Yield | 4.4% | 4.9% | 3.4% | 5.6% | 4.1% | 3.3% | 5.3% | 6.4% | 12.8% | 5.2% | 6.0% | 5.8% | |
| Payout Ratio | 42.3% | 46.6% | 67.0% | 35.7% | 34.2% | 47.7% | 34.9% | 31.7% | 13.0% | 41.7% | 45.8% | 34.4% | |
| Annual Payout | $1.22B | $1.22B | $1.23B | $1.17B | $1.03B | $960M | $949M | $844M | $703M | $695M | $713M | $687M |
Gewinn- und Verlustrechnung
| Kennzahl | Trend | Q3 2026 | Q2 2026 | Q1 2026 | Q4 2025 | Q3 2025 | Q2 2025 | Q1 2025 | Q4 2024 | Q3 2024 | Q2 2024 | Q1 2024 | Q4 2023 | Q3 2023 | Q2 2023 | Q1 2023 | Q4 2022 |
|---|---|---|---|---|---|---|---|---|---|---|---|---|---|---|---|---|---|
| Revenue | $3.53B | $3.46B | $3.00B | $2.97B | $3.10B | $3.11B | $2.99B | $3.02B | $3.05B | $3.04B | $3.00B | $3.07B | $2.97B | $2.98B | $3.13B | $3.24B | |
| Operating Expenses | $2.38B | $2.34B | $2.12B | $2.04B | $2.00B | $1.94B | $1.85B | $1.89B | $1.46B | $1.91B | $2.79B | $2.27B | $2.21B | $2.40B | $2.42B | $2.06B | |
| Operating Income | $1.15B | $1.12B | $877M | $937M | $1.10B | $1.18B | $1.15B | $1.13B | $1.60B | $1.13B | $213M | $808M | $756M | $576M | $711M | $1.18B | |
| Interest Expense | · | · | · | · | · | · | · | · | · | · | $201M | · | $182M | $170M | $175M | $177M | |
| Other Non-op | $30M | $32M | $35M | $23M | $23M | $24M | $31M | $-4M | $34M | $17M | $18M | $38M | $40M | $57M | $56M | $34M | |
| Pretax Income | $987M | $959M | $715M | $765M | $924M | $998M | $978M | $928M | $1.43B | $944M | $30M | $651M | $614M | $463M | $592M | $1.04B | |
| Income Tax | $228M | $225M | $168M | $121M | $213M | $230M | $228M | $195M | $328M | $207M | $-23M | $124M | $136M | $107M | $126M | $248M | |
| Net Income | $759M | $734M | $547M | $644M | $711M | $768M | $750M | $733M | $1.10B | $737M | $53M | $527M | $478M | $356M | $466M | $790M | |
| EPS (Basic) | $3.38 | $3.26 | $2.43 | $2.88 | $3.16 | $3.41 | $3.31 | $3.23 | $4.86 | $3.26 | $0.23 | $2.33 | $2.11 | $1.56 | $2.04 | $3.41 | |
| EPS (Diluted) | $3.37 | $3.26 | $2.43 | $2.87 | $3.16 | $3.41 | $3.31 | $3.24 | $4.85 | $3.25 | $0.23 | $2.32 | $2.10 | $1.56 | $2.04 | $3.40 | |
| Shares (Basic) | 224,600,000 | 224,600,000 | 224,500,000 | · | 224,400,000 | 225,000,000 | 226,100,000 | · | 226,200,000 | 226,000,000 | 225,800,000 | · | 226,400,000 | 227,500,000 | 227,700,000 | · | |
| Shares (Diluted) | 225,200,000 | 225,000,000 | 225,000,000 | · | 224,700,000 | 225,200,000 | 226,500,000 | · | 226,500,000 | 226,400,000 | 226,200,000 | · | 227,000,000 | 228,000,000 | 228,300,000 | · | |
| EBITDA | $1.15B | $1.12B | $1.23B | · | $1.10B | $1.18B | $1.49B | · | $1.60B | $1.13B | $550M | · | $756M | $576M | $1.03B | · |
Bilanz
| Kennzahl | Trend | Q3 2026 | Q2 2026 | Q1 2026 | Q4 2025 | Q3 2025 | Q2 2025 | Q1 2025 | Q4 2024 | Q3 2024 | Q2 2024 | Q1 2024 | Q4 2023 | Q3 2023 | Q2 2023 | Q1 2023 | Q4 2022 |
|---|---|---|---|---|---|---|---|---|---|---|---|---|---|---|---|---|---|
| Cash & Equivalents | $1.60B | $1.07B | $1.34B | $1.53B | $1.42B | $1.30B | $1.01B | $1.64B | $975M | $659M | $652M | · | $1.51B | $556M | $552M | · | |
| Receivables | $1.23B | $1.18B | $1.12B | $988M | $1.10B | $1.12B | $1.23B | $1.07B | $1.30B | $1.19B | $1.20B | · | $1.21B | $1.09B | $1.17B | · | |
| Other Current Assets | $145M | $228M | $248M | $409M | $219M | $168M | $191M | $201M | $125M | $148M | $236M | · | $123M | $114M | $138M | · | |
| Current Assets | $3.33B | $2.80B | $3.02B | $3.20B | $3.04B | $2.91B | $2.70B | $3.19B | $2.69B | $2.30B | $2.36B | · | $3.14B | $2.03B | $2.12B | · | |
| PP&E (Net) | $36.86B | $36.63B | $36.44B | $36.48B | $36.11B | $35.92B | $35.80B | $35.83B | $35.39B | $35.28B | $35.05B | · | $32.67B | $32.47B | $32.24B | · | |
| PP&E (Gross) | · | · | · | $51.10B | · | · | · | $49.79B | · | · | · | · | · | · | · | · | |
| Accum. Depreciation | $15.26B | $15.03B | $14.77B | $14.62B | $14.44B | $14.25B | $14.19B | $13.96B | $13.86B | $13.63B | $13.46B | · | $13.16B | $13.02B | $12.81B | · | |
| Other Non-current Assets | $1.58B | $1.54B | $1.53B | $1.47B | $1.35B | $1.29B | $1.29B | $1.29B | $1.21B | $1.16B | $1.15B | · | $1.10B | $1.08B | $1.07B | · | |
| Total Assets | $45.95B | $45.12B | $45.11B | $45.24B | $44.58B | $44.16B | $43.80B | $43.68B | $43.26B | $42.56B | $42.13B | · | $40.74B | $39.26B | $39.17B | · | |
| Accounts Payable | $2.06B | $1.78B | $1.70B | $1.86B | $1.66B | $1.50B | $1.45B | $1.70B | $1.61B | $1.53B | $1.51B | · | $1.50B | $1.42B | $1.31B | · | |
| Short-term Debt | · | · | · | · | · | · | · | · | · | $400M | $400M | · | $0 | $130M | $0 | · | |
| Current Liabilities | $3.68B | $3.37B | $3.33B | $3.77B | $3.52B | $3.67B | $3.45B | $3.54B | $3.68B | $3.67B | $3.45B | · | $2.91B | $2.99B | $2.82B | · | |
| Capital Leases | · | · | · | $148M | · | · | · | $191M | · | · | · | · | · | · | · | · | |
| Deferred Tax | $7.87B | $7.82B | $7.76B | $7.71B | $7.73B | $7.53B | $7.48B | $7.42B | $7.36B | $7.23B | $7.20B | · | $7.21B | $7.23B | $7.25B | · | |
| Other Non-current Liabilities | $1.70B | $1.71B | $1.72B | $1.72B | $1.71B | $1.71B | $1.70B | $1.76B | $1.79B | $1.75B | $1.77B | · | $1.82B | $1.81B | $1.78B | · | |
| Total Liabilities | $29.22B | $28.87B | $29.31B | $29.69B | $29.44B | $29.37B | $29.29B | $29.38B | $29.47B | $29.58B | $29.59B | · | $28.12B | $26.62B | $26.44B | · | |
| Total Debt | · | · | · | · | · | · | · | · | · | $400M | $400M | · | $0 | $130M | $0 | · | |
| Paid-in Capital | $2.36B | $2.33B | $2.31B | $2.30B | $2.28B | $2.26B | $2.25B | $2.25B | $2.22B | $2.21B | $2.19B | · | $2.16B | $2.16B | $2.15B | · | |
| Retained Earnings | $14.36B | $13.91B | $13.48B | $13.23B | $12.89B | $12.56B | $12.30B | $12.09B | $11.67B | $10.87B | $10.44B | · | $10.59B | $10.61B | $10.70B | · | |
| Treasury Stock | · | · | · | $19M | · | · | · | $19M | · | · | · | · | · | · | · | · | |
| AOCI | $-213M | $-212M | $-211M | $-210M | $-262M | $-261M | $-261M | $-262M | $-332M | $-330M | $-322M | · | $-364M | $-359M | $-355M | · | |
| Stockholders' Equity | $16.73B | $16.25B | $15.80B | $15.55B | $15.14B | $14.79B | $14.51B | $14.31B | $13.79B | $12.98B | $12.54B | $12.78B | $12.62B | $12.64B | $12.73B | $12.73B | |
| Liabilities + Equity | $45.95B | $45.12B | $45.11B | $45.24B | $44.58B | $44.16B | $43.80B | $43.68B | $43.26B | $42.56B | $42.13B | · | $40.74B | $39.26B | $39.17B | · | |
| Shares Outstanding | 224,616,686 | 224,608,373 | 224,594,001 | 224,420,699 | 224,386,617 | 224,614,894 | 225,443,501 | 226,320,894 | 226,239,662 | 226,096,433 | 225,914,028 | · | 226,136,334 | 227,015,277 | 227,639,602 | · |
Cashflow
| Kennzahl | Trend | Q3 2026 | Q2 2026 | Q1 2026 | Q4 2025 | Q3 2025 | Q2 2025 | Q1 2025 | Q4 2024 | Q3 2024 | Q2 2024 | Q1 2024 | Q4 2023 | Q3 2023 | Q2 2023 | Q1 2023 | Q4 2022 |
|---|---|---|---|---|---|---|---|---|---|---|---|---|---|---|---|---|---|
| D&A | $363M | $358M | $352M | $353M | $348M | $346M | $346M | $342M | $339M | $335M | $337M | $330M | $326M | $321M | $321M | $309M | |
| Deferred Tax | $54M | $60M | $48M | $-38M | $206M | $52M | $57M | $35M | $136M | $31M | $-26M | $4M | $-18M | $-20M | $-15M | $60M | |
| Restructuring | · | · | · | · | · | · | · | · | · | $-3M | $64M | · | · | · | · | · | |
| Other Non-cash | · | · | $-603M | · | · | · | $-203M | · | · | · | $475M | · | · | · | $401M | · | |
| Operating Cash Flow | $1.32B | $1.05B | $344M | $1.06B | $1.27B | $1.08B | $950M | $951M | $1.23B | $1.04B | $839M | $673M | $660M | $673M | $1.17B | $798M | |
| CapEx | $586M | $439M | $382M | $729M | $551M | $475M | $449M | $675M | $581M | $568M | $557M | $836M | $543M | $520M | $428M | $666M | |
| Investing Cash Flow | $-479M | $-416M | $-213M | $-644M | $-483M | $-414M | $-1.02B | $11M | $-224M | $-723M | $-1.84B | $-788M | $-653M | $-350M | $-391M | $-543M | |
| Stock Repurchased | $0 | $0 | $5M | $0 | $78M | $208M | $248M | $0 | $0 | $0 | $0 | $119M | $200M | $140M | $163M | $826M | |
| Net Stock Activity | · | · | $-5M | · | · | · | $-248M | · | · | · | $0 | · | · | · | $-163M | · | |
| Dividends Paid | $304M | $303M | $303M | $303M | $303M | $303M | $306M | $306M | $305M | $305M | $305M | $305M | $305M | $308M | $307M | $286M | |
| Financing Cash Flow | $-314M | $-910M | $-320M | $-307M | $-673M | $-366M | $-564M | $-296M | $-686M | $-306M | $89M | $177M | $943M | $-319M | $-686M | $-1.01B | |
| Net Change in Cash | $529M | $-272M | $-189M | $112M | $115M | $297M | $-635M | $666M | $316M | $7M | $-916M | $62M | $950M | $4M | $96M | $-758M | |
| Taxes Paid | $170M | $248M | $138M | $58M | $19M | $413M | $1M | $21M | $177M | $109M | $-2M | $160M | $206M | $316M | $-1M | $172M | |
| Free Cash Flow | · | · | $-38M | · | · | · | $501M | · | · | · | $282M | · | · | · | $745M | · | |
| Levered FCF | · | · | · | · | · | · | · | · | · | · | $-73M | · | · | · | $607M | · |
Rentabilität
| Kennzahl | Trend | Q3 2026 | Q2 2026 | Q1 2026 | Q4 2025 | Q3 2025 | Q2 2025 | Q1 2025 | Q4 2024 | Q3 2024 | Q2 2024 | Q1 2024 | Q4 2023 | Q3 2023 | Q2 2023 | Q1 2023 | Q4 2022 |
|---|---|---|---|---|---|---|---|---|---|---|---|---|---|---|---|---|---|
| Operating Margin | 32.6% | 32.4% | 29.2% | · | 35.4% | 37.8% | 38.3% | · | 52.3% | 37.2% | 7.1% | · | 25.4% | 19.3% | 22.7% | · | |
| Net Margin | 21.5% | 21.2% | 18.2% | · | 22.9% | 24.7% | 25.1% | · | 36.0% | 24.2% | 1.8% | · | 16.1% | 11.9% | 14.9% | · | |
| Pretax Margin | 28.0% | 27.7% | 23.8% | · | 29.8% | 32.1% | 32.7% | · | 46.8% | 31.0% | 1.0% | · | 20.7% | 15.5% | 18.9% | · | |
| EBITDA Margin | 32.6% | 32.4% | 41.0% | · | 35.4% | 37.8% | 49.9% | · | 52.3% | 37.2% | 18.3% | · | 25.4% | 19.3% | 33.0% | · | |
| ROA | 1.7% | 1.6% | 1.2% | · | 1.6% | 1.8% | 1.8% | · | 2.6% | 1.8% | 0.13% | · | 1.2% | 0.91% | 1.2% | · | |
| ROE | 4.8% | 4.7% | 3.6% | · | 4.9% | 5.5% | 5.5% | · | 8.3% | 5.8% | 0.42% | · | 3.7% | 2.8% | 3.6% | · | |
| ROIC | 5.3% | 5.3% | 4.2% | · | 5.6% | 6.1% | 6.1% | · | 8.9% | 6.6% | 2.9% | · | 4.7% | 3.5% | 4.4% | · |
Liquidität & Solvenz
| Kennzahl | Trend | Q3 2026 | Q2 2026 | Q1 2026 | Q4 2025 | Q3 2025 | Q2 2025 | Q1 2025 | Q4 2024 | Q3 2024 | Q2 2024 | Q1 2024 | Q4 2023 | Q3 2023 | Q2 2023 | Q1 2023 | Q4 2022 |
|---|---|---|---|---|---|---|---|---|---|---|---|---|---|---|---|---|---|
| Current Ratio | 0.9 | 0.8 | 0.9 | · | 0.9 | 0.8 | 0.8 | · | 0.7 | 0.6 | 0.7 | · | 1.1 | 0.7 | 0.8 | · | |
| Quick Ratio | 0.8 | 0.7 | 0.7 | · | 0.7 | 0.7 | 0.6 | · | 0.6 | 0.5 | 0.5 | · | 0.9 | 0.6 | 0.6 | · | |
| Debt / Equity | · | · | · | · | · | · | · | · | · | 0.0 | 0.0 | · | 0.0 | 0.0 | 0.0 | · | |
| Interest Coverage | · | · | · | · | · | · | · | · | · | · | 1.1 | · | 4.2 | 3.4 | 4.1 | · |
Effizienz
| Kennzahl | Trend | Q3 2026 | Q2 2026 | Q1 2026 | Q4 2025 | Q3 2025 | Q2 2025 | Q1 2025 | Q4 2024 | Q3 2024 | Q2 2024 | Q1 2024 | Q4 2023 | Q3 2023 | Q2 2023 | Q1 2023 | Q4 2022 |
|---|---|---|---|---|---|---|---|---|---|---|---|---|---|---|---|---|---|
| Asset Turnover | 0.1 | 0.1 | 0.1 | · | 0.1 | 0.1 | 0.1 | · | 0.1 | 0.1 | 0.1 | · | 0.1 | 0.1 | 0.1 | · | |
| Receivables Turnover | 3.0 | 3.0 | 2.5 | · | 2.6 | 2.7 | 2.5 | · | 2.4 | 2.7 | 2.5 | · | 2.5 | 2.6 | 2.8 | · |
Pro Aktie
| Kennzahl | Trend | Q3 2026 | Q2 2026 | Q1 2026 | Q4 2025 | Q3 2025 | Q2 2025 | Q1 2025 | Q4 2024 | Q3 2024 | Q2 2024 | Q1 2024 | Q4 2023 | Q3 2023 | Q2 2023 | Q1 2023 | Q4 2022 |
|---|---|---|---|---|---|---|---|---|---|---|---|---|---|---|---|---|---|
| Book Value / Share | $74.48 | $72.36 | $70.37 | · | $67.48 | $65.83 | $64.37 | · | $60.93 | $57.40 | $55.49 | · | $55.78 | $55.68 | $55.91 | · | |
| Revenue / Share | $15.66 | $15.40 | $13.32 | · | $13.81 | $13.81 | $13.21 | · | $13.47 | $13.45 | $13.28 | · | $13.09 | $13.07 | $13.72 | · | |
| Cash Flow / Share | · | · | $1.53 | · | · | · | $4.19 | · | · | · | $3.71 | · | · | · | $5.14 | · | |
| Cash / Share | $7.11 | $4.76 | $5.97 | · | $6.32 | $5.80 | $4.46 | · | $4.31 | $2.91 | $2.89 | · | $6.66 | $2.45 | $2.42 | · | |
| Dividend / Share | $1.35 | $1.35 | $1.35 | $1.35 | $1.35 | $1.35 | $1.35 | $1.35 | $1.35 | $1.35 | $1.35 | $1.35 | $1.35 | $1.35 | $1.35 | $1.24 | |
| EPS (TTM) | $11.93 | $11.72 | $11.87 | · | $13.12 | $14.81 | $14.65 | · | $10.65 | $7.90 | $6.21 | · | $9.10 | $11.10 | $12.99 | · |
Bewertung (TTM)
| Kennzahl | Trend | Q3 2026 | Q2 2026 | Q1 2026 | Q4 2025 | Q3 2025 | Q2 2025 | Q1 2025 | Q4 2024 | Q3 2024 | Q2 2024 | Q1 2024 | Q4 2023 | Q3 2023 | Q2 2023 | Q1 2023 | Q4 2022 |
|---|---|---|---|---|---|---|---|---|---|---|---|---|---|---|---|---|---|
| Revenue TTM | $12.96B | $12.54B | $12.19B | · | $12.23B | $12.18B | $12.11B | · | $12.17B | $12.09B | $12.03B | · | $12.32B | $12.69B | $12.96B | · | |
| Net Income TTM | $2.68B | $2.64B | $2.67B | · | $2.96B | $3.35B | $3.32B | · | $2.42B | $1.79B | $1.41B | · | $2.09B | $2.57B | $3.03B | · | |
| Market Cap | $69.41B | $70.66B | $64.46B | · | $67.41B | $57.49B | $53.40B | · | $56.22B | $48.54B | $57.58B | · | $44.53B | $51.48B | $48.26B | · | |
| Enterprise Value | · | · | · | · | · | · | · | · | · | $48.28B | $57.33B | · | $43.03B | $51.05B | $47.71B | · | |
| P/E | 25.9 | 26.8 | 24.2 | · | 22.9 | 17.3 | 16.2 | · | 23.3 | 27.2 | 41.0 | · | 21.6 | 20.4 | 16.3 | · | |
| P/S | 5.4 | 5.6 | 5.3 | · | 5.5 | 4.7 | 4.4 | · | 4.6 | 4.0 | 4.8 | · | 3.6 | 4.1 | 3.7 | · | |
| P/B | 4.1 | 4.3 | 4.1 | · | 4.5 | 3.9 | 3.7 | · | 4.1 | 3.7 | 4.6 | · | 3.5 | 4.1 | 3.8 | · | |
| P / Tangible Book | 4.1 | 4.3 | 4.1 | · | 4.5 | 3.9 | 3.7 | · | 4.1 | 3.7 | 4.6 | · | 3.5 | 4.1 | 3.8 | · | |
| P / Cash Flow | · | · | 187.4 | · | · | · | 56.2 | · | · | · | 68.6 | · | · | · | 41.1 | · | |
| EV / Revenue | · | · | · | · | · | · | · | · | · | 4.0 | 4.8 | · | 3.5 | 4.0 | 3.7 | · | |
| Dividend Yield | 1.8% | 1.7% | 1.9% | · | 1.8% | 2.1% | 2.3% | · | 2.2% | 2.5% | 2.1% | · | 2.7% | 2.3% | 2.4% | · | |
| Earnings Yield | 3.9% | 3.7% | 4.1% | · | 4.4% | 5.8% | 6.2% | · | 4.3% | 3.7% | 2.4% | · | 4.6% | 4.9% | 6.1% | · | |
| Payout Ratio | · | · | 55.4% | · | · | · | 40.8% | · | · | · | 575.5% | · | · | · | 65.9% | · | |
| Annual Payout | $1.21B | $1.21B | $1.21B | · | $1.22B | $1.22B | $1.22B | · | $1.22B | $1.22B | $1.22B | · | $1.21B | $1.19B | $1.18B | · |
Aktuellster Zeitraum links · fehlende Werte werden als · angezeigt
Finanzberichte Gewinn- und Verlustrechnung, Bilanz, Cashflow — jährlich, letzte 5 Jahre
| Kennzahl | 2025-12-31 | 2024-12-31 | 2023-12-31 | 2022-12-31 | 2021-12-31 |
|---|---|---|---|---|---|
| Umsatz | $12.18B | $12.12B | $12.16B | $12.74B | $11.14B |
| Betriebsgewinnmarge % | 35.8% | 33.6% | 23.4% | 37.7% | 39.9% |
| Nettoergebnis | $2.87B | $2.62B | $1.83B | $3.27B | $3.00B |
| Verwässerte EPS | $12.75 | $11.57 | $8.02 | $13.88 | $12.11 |
| Kennzahl | 2025-12-31 | 2024-12-31 | 2023-12-31 | 2022-12-31 | 2021-12-31 |
|---|---|---|---|---|---|
| Fremdkapital / Eigenkapital | · | · | 0.0 | 0.0 | · |
| Liquiditätsgrad | 0.8 | 0.9 | 1.2 | 0.8 | 0.9 |
| Quick Ratio | 0.7 | 0.8 | 1.0 | 0.6 | 0.7 |
| Kennzahl | 2025-12-31 | 2024-12-31 | 2023-12-31 | 2022-12-31 | 2021-12-31 |
|---|---|---|---|---|---|
| Freier Cashflow | $2.16B | $1.67B | $830M | $2.27B | $2.79B |
Institutionelle Eigentümer (13F) 2.020 Einreicher · $58.9B gesamt · Stand 30. September 2026
Institutionen, die diese Aktie in ihrer vierteljährlichen SEC-Formular 13F melden. Nur Long-Positionen; ein einzelner Einreicher kann für separate Optionsscheine zweimal erscheinen. Große gegenläufige Put/Call-Positionen spiegeln typischerweise Market-Making oder abgesicherte Bestände wider, nicht die gerichtete Überzeugung.
| Neue Positionen | Geschlossene Positionen | Erhöht | Abgenommen | Nettoveränderung der Aktien |
|---|---|---|---|---|
| 120 (-47 vs. Vorquartal) | 81 (-29 vs. Vorquartal) | 603 (+29 vs. Vorquartal) | 662 (-13 vs. Vorquartal) | +2.8M |
Verglichen mit Q1 2026. SEC-Formular 13F-Einreichungen sind innerhalb von 45 Tagen nach Quartalsende fällig, zuzüglich einer kurzen Pufferzeit für verspätete Einreicher — Quartale, die noch in diesem Fenster liegen, werden zugunsten des letzten vollständig berichteten Paares übersprungen.
| Institution | Wert | Aktien | % der verfolgten 13F | Typ |
|---|---|---|---|---|
| VANGUARD GROUP INC | $6.012.835.660 | 20.825.837 | 10,21% | Aktien |
| BlackRock, Inc. | $5.033.548.870 | 16.000.346 | 8,55% | Aktien |
| VANGUARD CAPITAL MANAGEMENT LLC | $4.613.819.725 | 14.666.136 | 7,84% | Aktien |
| STATE STREET CORP | $3.222.287.800 | 10.242.817 | 5,47% | Aktien |
| VANGUARD PORTFOLIO MANAGEMENT LLC | $2.270.049.352 | 7.215.898 | 3,86% | Aktien |
| MILLENNIUM MANAGEMENT LLC | $1.636.411.612 | 5.201.728 | 2,78% | Aktien |
| GEODE CAPITAL MANAGEMENT, LLC | $1.601.393.228 | 5.114.278 | 2,72% | Aktien |
| BANK OF AMERICA CORP /DE/ | $978.976.908 | 3.111.914 | 1,66% | Aktien |
| NORGES BANK | $956.551.163 | 3.040.628 | 1,62% | Aktien |
| Pentwater Capital Management LP | $872.987.250 | 2.775.000 | 1,48% | Aktien |
| NORTHERN TRUST CORP | $822.465.983 | 2.614.406 | 1,40% | Aktien |
| MORGAN STANLEY | $821.705.332 | 2.611.985 | 1,40% | Aktien |
| D. E. Shaw & Co., Inc. | $818.312.137 | 2.601.202 | 1,39% | Aktien |
| Dodge & Cox | $789.031.988 | 2.508.128 | 1,34% | Aktien |
| DIMENSIONAL FUND ADVISORS LP | $710.936.268 | 2.259.711 | 1,21% | Aktien |
| Capital World Investors | $632.929.806 | 2.011.919 | 1,08% | Aktien |
| GOLDMAN SACHS GROUP INC | $594.243.849 | 1.888.947 | 1,01% | Aktien |
| HBK INVESTMENTS L P | $550.532.500 | 1.750.000 | 0,94% | Aktien |
| ARROWSTREET CAPITAL, LIMITED PARTNERSHIP | $544.885.295 | 1.732.049 | 0,93% | Aktien |
| LONDON CO OF VIRGINIA | $520.023.403 | 1.652.991 | 0,88% | Aktien |
| Legal & General Group Plc | $503.093.274 | 1.599.203 | 0,85% | Aktien |
| CITADEL ADVISORS LLC | $498.772.064 | 1.585.467 | 0,85% | Aktien |
| Amundi | $484.658.927 | 1.540.605 | 0,82% | Aktien |
| AMERICAN CENTURY COMPANIES INC | $480.143.373 | 1.526.249 | 0,82% | Aktien |
| CHARLES SCHWAB INVESTMENT MANAGEMENT INC | $466.667.210 | 1.483.414 | 0,79% | Aktien |
| MIRAE ASSET GLOBAL ETFS HOLDINGS Ltd. | $449.103.232 | 1.427.631 | 0,76% | Aktien |
| FMR LLC | $437.083.847 | 1.389.376 | 0,74% | Aktien |
| JPMORGAN CHASE & CO | $427.557.566 | 1.350.252 | 0,73% | Aktien |
| Invesco Ltd. | $423.564.249 | 1.346.401 | 0,72% | Aktien |
| VANGUARD FIDUCIARY TRUST CO | $396.694.844 | 1.260.990 | 0,67% | Aktien |
| Fisher Asset Management, LLC | $377.649.537 | 1.200.449 | 0,64% | Aktien |
| Capital Wealth Planning, LLC | $374.289.382 | 1.189.769 | 0,64% | Aktien |
| Bank of New York Mellon Corp | $364.413.917 | 1.158.377 | 0,62% | Aktien |
| DEUTSCHE BANK AG\ | $356.558.194 | 1.133.406 | 0,61% | Aktien |
| Balyasny Asset Management L.P. | $349.563.914 | 1.111.173 | 0,59% | Aktien |
| UBS AM, a distinct business unit of UBS ASSET MANAGEMENT AMERICAS LLC | $331.236.745 | 1.154.135 | 0,56% | Aktien |
| WELLS FARGO & COMPANY/MN | $328.710.187 | 1.044.885 | 0,56% | Aktien |
| CAXTON ASSOCIATES LLP | $328.235.341 | 1.043.375 | 0,56% | Aktien |
| PRIMECAP MANAGEMENT CO/CA/ | $324.943.157 | 1.032.910 | 0,55% | Aktien |
| UBS Group AG | $316.053.788 | 1.004.653 | 0,54% | Aktien |
| Qube Research & Technologies Ltd | $281.635.125 | 895.245 | 0,48% | Aktien |
| ADAGE CAPITAL PARTNERS GP, L.L.C. | $241.144.560 | 766.536 | 0,41% | Aktien |
| Kryger Capital LLC | $241.052.385 | 766.243 | 0,41% | Aktien |
| Verition Fund Management LLC | $238.688.242 | 758.728 | 0,41% | Aktien |
| CITIGROUP INC | $236.771.786 | 752.636 | 0,40% | Aktien |
| HOTCHKIS & WILEY CAPITAL MANAGEMENT LLC | $228.750.343 | 727.138 | 0,39% | Aktien |
| LMR Partners LLP | $227.100.948 | 721.895 | 0,39% | Aktien |
| MARSHALL WACE, LLP | $223.838.964 | 711.526 | 0,38% | Aktien |
| Symmetry Investments LP | $204.639.222 | 650.496 | 0,35% | Aktien |
| TUDOR INVESTMENT CORP ET AL | $203.585.346 | 647.145 | 0,35% | Aktien |
Aktivisten & 5%+-Eigentümer 1 Beteiligung
Investoren mit SEC Schedule 13D — wirtschaftliches Eigentum über 5% mit der Absicht, Einfluss auf den Emittenten zu nehmen (aktivistische Beteiligungen, Board-Kampagnen, M&A). Jede Zeile zeigt den zuletzt bekannten Stand der Position dieses Melders.
| Anmelder | Eingereicht | Beteiligung | Status | Zweck | Einreichung |
|---|---|---|---|---|---|
| Nicht offengelegter meldender Beteiligter, Nicht offengelegter meldender Beteiligter, Nicht offengelegter meldender Beteiligter, Nicht offengelegter meldender Beteiligter, Nicht offengelegter meldender Beteiligter, Nicht offengelegter meldender Beteiligter, Nicht offengelegter meldender Beteiligter | 20. Februar 2001 | · | Erste Einreichung | Kapitalstruktur | SEC |
Purpose is an automated classification of the filer's own stated purpose (SEC Item 4) — not investment advice. "—" means no clear purpose was stated or the text could not be classified.
Unternehmensinsider 75 Insider · 15 Führungskräfte · 24 Direktoren
| Insider | Rolle | Letzte Aktivität | Gehaltene Aktien | Käufe 12m | Verkäufe 12m | Netto 12m |
|---|---|---|---|---|---|---|
| Mark R George | President & CEO | 13. September 2026 M | 22.783 | 0 | 0 | $0 |
| Charles W Moorman | Chairman & CEO | 5. März 2015 G | 344.693 | 0 | 0 | $0 |
| John P Rathbone | EVP Finance and CFO | 24. Oktober 2013 M | 123.392 | 0 | 0 | $0 |
| Brian Barr | Chief Operating Officer | 24. Oktober 2026 M | 1.354 | 0 | 0 | $0 |
| Mark D Manion | Exec. Vice President & COO | 28. Januar 2016 A | 32.270 | 0 | 0 | $0 |
| Anil Bhatt | EVP & CIDO | 24. Oktober 2026 M | 3.960 | 0 | 1 | $-253.440 |
| Deborah H Butler | Exec. V.P.- Planning & CIO | 29. Juni 2015 G | 27.223 | 0 | 0 | $0 |
| Donald W Seale | Exec. V.P. and CMO | 29. Januar 2015 M | 207.501 | 0 | 0 | $0 |
| Daniel D Smith | S.V.P.-Energy and Properties | 6. Mai 2010 S | 11.702 | 0 | 0 | $0 |
| Henry C Wolf | Vice Chrmn. & C.F.O. | 29. Juni 2007 A | 234.058 | 0 | 0 | $0 |
| Kathryn B. Mcquade | Exec. V.P.-Planning & CIO | 4. Mai 2007 M | 100.578 | 0 | 0 | $0 |
| L I Prillaman | Vice Chmn. & C.M.O. | 31. März 2006 M | 285.842 | 0 | 0 | $0 |
| Henry D Light | Senior Vice President - Law | 24. Februar 2005 M | 40.544 | 0 | 0 | $0 |
| Stephen P Renken | Former V.P. - Chief Info. Off. | 2. Januar 2004 D | · | 0 | 0 | $0 |
| John M Samuels | Senior V.P.- Oper.Plan.&Supp. | 10. September 2003 A | · | 0 | 0 | $0 |
| John C Huffard Jr | Direktor | 8. Oktober 2026 W | 333 | 0 | 0 | $0 |
| Richard H Anderson | Direktor | 30. September 2026 A | 7.000 | 1 | 0 | $732.836 |
| Sameh Fahmy | Direktor | 20. August 2026 A | 12.000 | 1 | 0 | $466.900 |
| Mary Kathryn Heitkamp | Direktor | 20. August 2026 A | · | 0 | 0 | $0 |
| William Clyburn Jr. | Direktor | 20. August 2026 A | 405 | 1 | 0 | $60.137 |
| Phillip S Davidson | Direktor | 20. August 2026 A | · | 0 | 0 | $0 |
| Francesca A. Debiase | Direktor | 20. August 2026 A | 350 | 0 | 0 | $0 |
| Marcela E Donadio | Direktor | 20. August 2026 A | · | 0 | 0 | $0 |
| Christopher T Jones | Direktor | 20. August 2026 A | · | 0 | 0 | $0 |
| Lori Ryerkerk | Direktor | 20. August 2026 A | · | 0 | 0 | $0 |
| Gilbert H Lamphere | Direktor | 20. August 2026 A | 3.647 | 0 | 0 | $0 |
| Karen N Horn | Direktor | 10. März 2016 A | 3.000 | 0 | 0 | $0 |
| Burton M Joyce | Direktor | 10. März 2014 A | · | 0 | 0 | $0 |
| Gerald L Baliles | Direktor | 11. März 2013 A | · | 0 | 0 | $0 |
| Paul J Reason | Direktor | 11. März 2013 A | · | 0 | 0 | $0 |
| CORRELL ALSTON D | Direktor | 11. März 2013 A | 8.000 | 0 | 0 | $0 |
| Gene R Carter | Direktor | 31. März 2011 A | 50 | 0 | 0 | $0 |
| Landon Hilliard | Direktor | 10. März 2011 A | 13.745 | 0 | 0 | $0 |
| Jane Margaret Obrien | Direktor | 24. Januar 2008 A | · | 0 | 0 | $0 |
| Harold W Pote | Direktor | 31. März 2006 A | · | 0 | 0 | $0 |
| David R Goode | Direktor | 28. Februar 2006 M | 816.897 | 0 | 0 | $0 |
| George D Johnson JR | Direktor | 31. März 2004 A | · | 0 | 0 | $0 |
| John F Orr | · | 26. April 2026 M | 11.363 | 0 | 0 | $0 |
| Claiborne L Moore | · | 30. Januar 2026 M | 4.970 | 0 | 0 | $0 |
| Claude E Elkins | · | 30. Januar 2026 M | 3.365 | 0 | 0 | $0 |
| Jason Andrew Zampi | · | 30. Januar 2026 M | 4.145 | 0 | 0 | $0 |
| Claude Mongeau | · | 20. Mai 2025 A | 20.000 | 0 | 0 | $0 |
| Thomas Colm Kelleher | · | 20. Februar 2025 A | 2.282 | 0 | 0 | $0 |
| Alan H. Shaw | · | 13. September 2024 M | 35.045 | 0 | 0 | $0 |
| Nabanita C Nag | · | 29. Juli 2024 S | 1.488 | 0 | 0 | $0 |
| Paul B Duncan | · | 2. März 2024 M | 2.621 | 0 | 0 | $0 |
| Mitchell E Daniels | · | 20. Februar 2024 A | 720 | 0 | 0 | $0 |
| Jennifer F. Scanlon | · | 20. Februar 2024 A | 42 | 0 | 0 | $0 |
| Thomas D Bell JR | · | 20. Februar 2024 A | 5.920 | 0 | 0 | $0 |
| Amy E Miles | · | 20. Februar 2024 A | 3.000 | 0 | 0 | $0 |
| Michael D Lockhart | · | 20. Februar 2024 A | 6.012 | 0 | 0 | $0 |
| John R Thompson | · | 20. Februar 2024 A | 3.144 | 0 | 0 | $0 |
| LEER STEVEN F | · | 20. Februar 2024 A | 5.220 | 0 | 0 | $0 |
| Ann A Adams | · | 30. Januar 2024 M | 19.779 | 0 | 0 | $0 |
| James A Squires | · | 21. Februar 2023 A | 60.907 | 0 | 0 | $0 |
| Cynthia M Sanborn | · | 30. Januar 2022 M | 2.791 | 0 | 0 | $0 |
| Lorri J Kleine | · | 27. Januar 2022 A | 2.089 | 0 | 0 | $0 |
| Clyde H Allison Jr | · | 27. Januar 2022 F | 43.456 | 0 | 0 | $0 |
| Vanessa Allen Sutherland | · | 1. Februar 2021 M | 1.400 | 0 | 0 | $0 |
| Michael Joseph Wheeler | · | 11. August 2020 S | 11.058 | 0 | 0 | $0 |
| Daniel A Carp | · | 10. März 2020 A | 3.890 | 0 | 0 | $0 |
| John Meade Scheib | · | 30. Januar 2020 A | 9.874 | 0 | 0 | $0 |
| Cynthia C Earhart | · | 30. Oktober 2019 M | 1.864 | 0 | 0 | $0 |
| Martin H. Nesbitt | · | 11. März 2019 A | 3.000 | 0 | 0 | $0 |
| Wesley G Bush | · | 28. Januar 2019 A | 3.389 | 0 | 0 | $0 |
| Thomas E Hurlbut | · | 11. Mai 2018 M | 0 | 0 | 0 | $0 |
| Erskine B Bowles | · | 29. März 2018 A | 3.477 | 0 | 0 | $0 |
| William Andrew Galanko | · | 25. Januar 2018 F | 16.706 | 0 | 0 | $0 |
| Marta R Stewart | · | 26. Mai 2017 S | 15.633 | 0 | 0 | $0 |
| Robert A Bradway | · | 10. März 2017 A | 3.000 | 0 | 0 | $0 |
| James A Hixon | · | 26. Januar 2017 M | 130.073 | 0 | 0 | $0 |
| Stephen C Tobias | · | 29. Januar 2009 A | 276.365 | 0 | 0 | $0 |
| James W Mcclellan | · | 1. Dezember 2003 D | · | 0 | 0 | $0 |
| John W Fox JR | · | 1. Dezember 2003 | · | 0 | 0 | $0 |
| John F Corcoran | · | 10. September 2003 A | · | 0 | 0 | $0 |
Insider aus SEC-Einreichungen Form 3/4/5; Netto = nur P/S aus offenen Märkten
ETF-Besitz Gehalten von 122 ETFs
Gewichtung spiegelt nur direkte Aktienbestände (N-PORT) wider; gehebelte oder derivatbasierte Fonds können zusätzliche Swap-Exposure halten, die hier nicht angezeigt wird.
| Fonds | Gewicht | Anteile | Stand | Quelle |
|---|---|---|---|---|
| IYT · iShares Trust | 4,78% | 298.387 SH | 11. September 2026 | Täglich |
| MNA · New York Life Investments ETF Trust | 4,34% | 32.575 NS | 31. Juli 2026 | N-PORT |
| SHPP · Pacer Funds Trust | 3,89% | 240 NS | 31. Juli 2026 | N-PORT |
| TPOR · Direxion Shares ETF Trust | 2,12% | 1.110 NS | 31. Juli 2026 | N-PORT |
| EVNT · AltShares Trust | 2,05% | 781 NS | 31. August 2026 | N-PORT |
| IQRA · New York Life Investments Active ET… | 1,29% | 265 NS | 31. Juli 2026 | N-PORT |
| RSPN · Invesco Exchange-Traded Fund Trust | 1,25% | 27.079 SH | 23. Oktober 2026 | Täglich |
| FIDU · FIDELITY COVINGTON TRUST | 1,07% | 73.592 NS | 31. Juli 2026 | N-PORT |
| NFRA · FlexShares Trust | 1,04% | 93.021 NS | 31. Juli 2026 | N-PORT |
| SPLV · Invesco Exchange-Traded Fund Trust … | 0,99% | 215.662 SH | 23. Oktober 2026 | Täglich |
| DUSL · Direxion Shares ETF Trust | 0,99% | 1.659 NS | 31. Juli 2026 | N-PORT |
| VIS · VANGUARD WORLD FUND | 0,95% | 272.634 SH | 19. August 2026 | Täglich |
| IYJ · iShares Trust | 0,91% | 53.435 SH | 11. September 2026 | Täglich |
| DFLV · Dimensional ETF Trust | 0,87% | 176.015 NS | 31. Juli 2026 | N-PORT |
| HEQQ · J.P. Morgan Exchange-Traded Fund Tr… | 0,77% | 686 NS | 31. Juli 2026 | N-PORT |
| EXI · iShares Trust | 0,74% | 32.315 SH | 11. September 2026 | Täglich |
| VOE · VANGUARD INDEX FUNDS | 0,61% | 721.363 SH | 19. August 2026 | Täglich |
| IMCV · iShares Trust | 0,57% | 20.412 SH | 11. September 2026 | Täglich |
| FEUS · FlexShares Trust | 0,54% | 1.815 NS | 31. Juli 2026 | N-PORT |
| IMCB · iShares Trust | 0,51% | 26.532 SH | 11. September 2026 | Täglich |
| IMCG · iShares Trust | 0,45% | 55.812 SH | 11. September 2026 | Täglich |
| XOEF · iShares Trust | 0,41% | 283 SH | 11. September 2026 | Täglich |
| DFUV · Dimensional ETF Trust | 0,39% | 180.770 NS | 31. Juli 2026 | N-PORT |
| VO · VANGUARD INDEX FUNDS | 0,34% | 2.433.643 SH | 19. August 2026 | Täglich |
| VYM · VANGUARD WHITEHALL FUNDS | 0,29% | 897.799 SH | 19. August 2026 | Täglich |
| PWS · Pacer Funds Trust | 0,27% | 195 NS | 31. Juli 2026 | N-PORT |
| IWX · iShares Trust | 0,27% | 32.541 SH | 11. September 2026 | Täglich |
| VTV · VANGUARD INDEX FUNDS | 0,26% | 2.137.767 SH | 19. August 2026 | Täglich |
| MNZL · EA Series Trust | 0,26% | 187 NS | 31. Juli 2026 | N-PORT |
| IVE · iShares Trust | 0,24% | 373.387 SH | 11. September 2026 | Täglich |
| VOOV · VANGUARD ADMIRAL FUNDS | 0,24% | 51.733 SH | 19. August 2026 | Täglich |
| FXR · First Trust Exchange-Traded AlphaDE… | 0,24% | 5.281 NS | 31. Juli 2026 | N-PORT |
| DFVX · Dimensional ETF Trust | 0,23% | 3.674 NS | 31. Juli 2026 | N-PORT |
| IUSV · iShares Trust | 0,23% | 196.689 SH | 11. September 2026 | Täglich |
| PFIG · Invesco Exchange-Traded Fund Trust … | 0,22% | 295.000 | 23. Oktober 2026 | Täglich |
| DSI · iShares Trust | 0,21% | 34.292 SH | 11. September 2026 | Täglich |
| RSP · Invesco Exchange-Traded Fund Trust | 0,21% | 607.330 SH | 23. Oktober 2026 | Täglich |
| VONV · VANGUARD SCOTTSDALE FUNDS | 0,20% | 135.793 SH | 19. August 2026 | Täglich |
| IWD · iShares Trust | 0,20% | 499.858 SH | 11. September 2026 | Täglich |
| EUSA · iShares, Inc. | 0,19% | 11.289 SH | 11. September 2026 | Täglich |
| SNPE · DBX ETF Trust | 0,19% | 16.321 NS | 31. August 2026 | N-PORT |
| SIZE · iShares Trust | 0,19% | 2.481 SH | 11. September 2026 | Täglich |
| MGV · VANGUARD WORLD FUND | 0,17% | 70.585 SH | 19. August 2026 | Täglich |
| EGLE · Global X Funds | 0,17% | 11 NS | 31. Juli 2026 | N-PORT |
| DEUS · DBX ETF Trust | 0,17% | 1.476 NS | 31. August 2026 | N-PORT |
| BSCU · Invesco Exchange-Traded Self-Indexe… | 0,16% | 4.547.000 | 22. Oktober 2026 | Täglich |
| PRF · Invesco Exchange-Traded Fund Trust | 0,16% | 47.954 SH | 23. Oktober 2026 | Täglich |
| DXUV · Dimensional ETF Trust | 0,15% | 2.486 NS | 31. Juli 2026 | N-PORT |
| CATH · Global X Funds | 0,15% | 5.770 NS | 31. Juli 2026 | N-PORT |
| DCOR · Dimensional ETF Trust | 0,14% | 13.675 NS | 31. Juli 2026 | N-PORT |
| TOPC · iShares Trust | 0,14% | 138 SH | 11. September 2026 | Täglich |
| USCL · iShares Trust | 0,14% | 11.862 SH | 11. September 2026 | Täglich |
| DFAU · Dimensional ETF Trust | 0,13% | 48.458 NS | 31. Juli 2026 | N-PORT |
| CHRI · Global X Funds | 0,13% | 31 NS | 31. Juli 2026 | N-PORT |
| IWL · iShares Trust | 0,13% | 8.717 SH | 11. September 2026 | Täglich |
| XVV · iShares Trust | 0,12% | 2.588 SH | 11. September 2026 | Täglich |
| XYLG · Global X Funds | 0,12% | 231 NS | 31. Juli 2026 | N-PORT |
| XYLD · Global X Funds | 0,12% | 11.609 NS | 31. Juli 2026 | N-PORT |
| IUS · Invesco Exchange-Traded Self-Indexe… | 0,12% | 3.571 SH | 23. Oktober 2026 | Täglich |
| XTR · Global X Funds | 0,12% | 17 NS | 31. Juli 2026 | N-PORT |
| ILCV · iShares Trust | 0,12% | 4.875 SH | 11. September 2026 | Täglich |
| BBUS · J.P. Morgan Exchange-Traded Fund Tr… | 0,12% | 31.218 NS | 31. Juli 2026 | N-PORT |
| QVML · Invesco Exchange-Traded Fund Trust … | 0,12% | 5.924 SH | 23. Oktober 2026 | Täglich |
| VOTE · TCW ETF Trust | 0,12% | 3.826 NS | 31. Juli 2026 | N-PORT |
| PTLC · Pacer Funds Trust | 0,12% | 11.361 NS | 31. Juli 2026 | N-PORT |
| APUE · Trust for Professional Managers | 0,12% | 8.429 NS | 31. August 2026 | N-PORT |
| PBP · Invesco Exchange-Traded Fund Trust | 0,12% | 1.347 SH | 23. Oktober 2026 | Täglich |
| DFAC · Dimensional ETF Trust | 0,12% | 164.692 NS | 31. Juli 2026 | N-PORT |
| BKLC · BNY Mellon ETF Trust | 0,11% | 18.740 NS | 31. Juli 2026 | N-PORT |
| PBUS · Invesco Exchange-Traded Fund Trust … | 0,11% | 35.743 SH | 23. Oktober 2026 | Täglich |
| XRMI · Global X Funds | 0,11% | 169 NS | 31. Juli 2026 | N-PORT |
| XCLR · Global X Funds | 0,11% | 12 NS | 31. Juli 2026 | N-PORT |
| ILCB · iShares Trust | 0,11% | 4.415 SH | 11. September 2026 | Täglich |
| IVV · iShares Trust | 0,11% | 2.830.587 SH | 11. September 2026 | Täglich |
| DFUS · Dimensional ETF Trust | 0,11% | 68.692 NS | 31. Juli 2026 | N-PORT |
| VOO · VANGUARD INDEX FUNDS | 0,11% | 5.834.293 SH | 19. August 2026 | Täglich |
| VV · VANGUARD INDEX FUNDS | 0,11% | 262.303 SH | 19. August 2026 | Täglich |
| TOV · EA Series Trust | 0,11% | 869 NS | 31. Juli 2026 | N-PORT |
| SPUU · Direxion Shares ETF Trust | 0,11% | 847 NS | 31. Juli 2026 | N-PORT |
| QDPL · Pacer Funds Trust | 0,11% | 5.402 NS | 31. Juli 2026 | N-PORT |
| VOXP · Advisors Series Trust | 0,10% | 18 NS | 31. Juli 2026 | N-PORT |
| IWB · iShares Trust | 0,10% | 156.030 SH | 11. September 2026 | Täglich |
| IYY · iShares Trust | 0,10% | 9.610 SH | 11. September 2026 | Täglich |
| ILCG · iShares Trust | 0,10% | 9.771 SH | 11. September 2026 | Täglich |
| CRBN · iShares Trust | 0,10% | 3.649 SH | 11. September 2026 | Täglich |
| VTI · VANGUARD INDEX FUNDS | 0,10% | 7.130.857 SH | 19. August 2026 | Täglich |
| VONE · VANGUARD SCOTTSDALE FUNDS | 0,10% | 37.168 SH | 19. August 2026 | Täglich |
| VTHR · VANGUARD SCOTTSDALE FUNDS | 0,10% | 18.941 SH | 19. August 2026 | Täglich |
| IWV · iShares Trust | 0,10% | 62.061 SH | 11. September 2026 | Täglich |
| ITOT · iShares Trust | 0,10% | 292.197 SH | 11. September 2026 | Täglich |
| SPXD · DBX ETF Trust | 0,10% | 20 NS | 31. August 2026 | N-PORT |
| PHDG · Invesco Actively Managed Exchange-T… | 0,10% | 175 SH | 23. Oktober 2026 | Täglich |
| HCMT · Direxion Shares ETF Trust | 0,09% | 1.561 NS | 31. Juli 2026 | N-PORT |
| KOKU · DBX ETF Trust | 0,09% | 2.090 NS | 31. August 2026 | N-PORT |
| SPXL · Direxion Shares ETF Trust | 0,09% | 17.560 NS | 31. Juli 2026 | N-PORT |
| TOK · iShares Trust | 0,09% | 635 SH | 11. September 2026 | Täglich |
| URTH · iShares, Inc. | 0,08% | 20.147 SH | 11. September 2026 | Täglich |
| TILT · FlexShares Trust | 0,08% | 5.022 NS | 31. Juli 2026 | N-PORT |
| MGC · VANGUARD WORLD FUND | 0,07% | 22.545 SH | 19. August 2026 | Täglich |
| ACWI · iShares Trust | 0,07% | 70.059 SH | 11. September 2026 | Täglich |
| RWL · Invesco Exchange-Traded Fund Trust … | 0,06% | 19.583 SH | 23. Oktober 2026 | Täglich |
| OMFL · Invesco Exchange-Traded Self-Indexe… | 0,06% | 8.488 SH | 23. Oktober 2026 | Täglich |
| VT · VANGUARD INTERNATIONAL EQUITY INDEX… | 0,06% | 187.191 SH | 19. August 2026 | Täglich |
| ACVF · ETF Opportunities Trust | 0,05% | 241 NS | 31. Juli 2026 | N-PORT |
| NPFE · Elevation Series Trust | 0,05% | 975 NS | 31. Juli 2026 | N-PORT |
| EQAL · Invesco Exchange-Traded Fund Trust … | 0,05% | 1.083 SH | 23. Oktober 2026 | Täglich |
| FHEQ · Fidelity Greenwood Street Trust | 0,03% | 798 NS | 31. Juli 2026 | N-PORT |
| FYEE · Fidelity Greenwood Street Trust | 0,02% | 153 NS | 31. Juli 2026 | N-PORT |
| LGDX · Tidal Trust III | 0,02% | 98 NS | 31. Juli 2026 | N-PORT |
| FBUF · Fidelity Greenwood Street Trust | 0,02% | 16 NS | 31. Juli 2026 | N-PORT |
| BIV · VANGUARD BOND INDEX FUNDS | · | · | 15. Juli 2026 | Täglich |
| BLV · VANGUARD BOND INDEX FUNDS | · | · | 15. Juli 2026 | Täglich |
| BSV · VANGUARD BOND INDEX FUNDS | · | · | 15. Juli 2026 | Täglich |
| BND · VANGUARD BOND INDEX FUNDS | · | · | 15. Juli 2026 | Täglich |
| VCRB · VANGUARD MALVERN FUNDS | · | · | 15. Juli 2026 | Täglich |
| VPLS · VANGUARD MALVERN FUNDS | · | · | 15. Juli 2026 | Täglich |
| VCSH · VANGUARD SCOTTSDALE FUNDS | · | · | 15. Juli 2026 | Täglich |
| VCIT · VANGUARD SCOTTSDALE FUNDS | · | · | 15. Juli 2026 | Täglich |
| VCLT · VANGUARD SCOTTSDALE FUNDS | · | · | 15. Juli 2026 | Täglich |
| VTC · VANGUARD SCOTTSDALE FUNDS | · | · | 30. Juli 2026 | Täglich |
| BNDW · VANGUARD SCOTTSDALE FUNDS | · | · | 30. Juli 2026 | Täglich |
| IFRA · iShares Trust | · | 356.500 SH | 11. September 2026 | Täglich |
NSC Analysten-Konsens Bullische und bärische Analystenmeinungen, 12-Monats-Kursziel, Aufwärtspotenzial
12-Monats-Kursziel
18 Analysten · 2026-10-25Mittelwert-Ziel $360.28 +6,8%
Peer-Vergleich (GICS-Subbranche) Wichtige Kennzahlen im Vergleich zu Branchenkollegen
FY-Basis, Kurse zum Schlusskurs am Ende des letzten Geschäftsjahres jedes Unternehmens.
Neueste Nachrichten Aktuelle Schlagzeilen über dieses Unternehmen
Meine Kennzahlen Ihre persönliche Watchlist — ausgewählte Zeilen aus den vollständigen Fundamentaldaten
Wählen Sie die Kennzahlen, die für Sie wichtig sind — klicken Sie auf das + neben jeder Zeile in den vollständigen Fundamentaldaten oben.
Ihre Auswahl wird gespeichert und begleitet Sie über alle Ticker hinweg.