
APO Apollo Global Management, Inc. (New) Common Stock
NYSE · Financial Services · Wyświetl na SEC EDGAR ↗ zamknij Paź 6, 2026 10-K/10-Q Lut 25, 2026APO Migawka akcji Cena, kapitalizacja rynkowa, P/E, EPS, ROE, zadłużenie/kapitał własny, zakres 52-tygodniowy
APO Wykres ceny akcji Dzienny OHLCV ze wskaźnikami technicznymi — przesuwaj, powiększaj i dostosowuj widok
Granularność słupków dostosowuje się do wybranego okresu — najedź kursorem na wykres, aby zobaczyć otwarcia/maksima/minima/zamknięcia dla danego słupka.
O Apollo Global Management, Inc. (New) Common Stock Przegląd firmy z Wikipedii
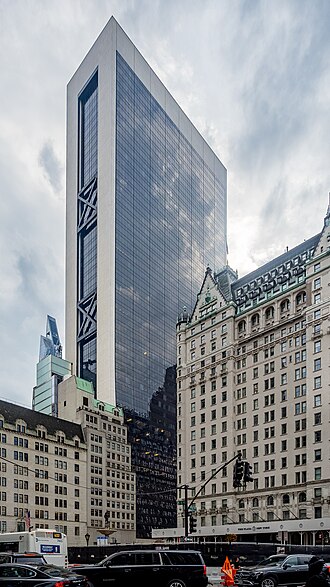
Apollo Global Management, Inc. is an American asset management firm that primarily invests in alternative assets. As of 2025, the company had $840 billion of assets under management, including $392 billion invested in credit, including mezzanine capital, hedge funds, non-performing loans, and collateralized loan obligations, $99 billion invested in private equity, and $46.2 billion invested in real assets, which includes real estate and infrastructure. The company invests money on behalf of pension funds, financial endowments, and sovereign wealth funds, as well as other institutional and individual investors.
Apollo was founded in 1990 by Leon Black, Josh Harris, and Marc Rowan, former investment bankers at the defunct Drexel Burnham Lambert. The company is headquartered in the Solow Building in New York City, with offices across North America, Europe, and Asia. Co-founder Leon Black resigned as CEO in 2021 in the wake of sexual misconduct allegations and revelations that he had paid $158 million to Jeffrey Epstein.
In addition to its private funds, Apollo operates Apollo Investment Corporation (AIC), a US-domiciled publicly traded, private-equity, closed-end fund and Business Development Company. AIC provides mezzanine debt, senior secured loans, and equity investments to middle-market companies, including public companies, although it historically has not invested in companies controlled by Apollo's private-equity funds.
In June 2024, Apollo Global Management ranked 29th in Private Equity International's PEI 300 ranking among the world's largest private equity firms.
History
1990–1994: Foundation
Apollo, originally referred to as Apollo Advisors, was founded after the collapse of Drexel Burnham Lambert in 1990 by Leon Black, the former head of Drexel's mergers and acquisitions department, along with associates Josh Harris and Marc Rowan. Tony Ressler, another former senior Drexel executive, was also among the firm's original members.
Within six months after the collapse of Drexel, Apollo launched Apollo Investment Fund L.P., the first of its private-equity investment funds, formed to make investments in distressed companies. Apollo raised around $400 million of investor commitments based on Leon Black's reputation as a prominent lieutenant of Michael Milken and a key player in the buyout boom of the 1980s.
Lion Advisors (or Lion Capital) was founded in 1990 to provide investment services to Credit Lyonnais and foreign institutions, seeking to profit from depressed prices in the high-yield market. In 1992, Lion entered into a more formal arrangement to manage the $3 billion high-yield portfolio for Credit Lyonnais which together with a consortium of other international investors provided the capital for Lion's investment activities. Lion Advisors was replaced by Ares Management.
At the time of Apollo's founding, little financing was available for new leveraged buyouts and Apollo turned, instead, to a strategy of distressed-to-control takeovers. Apollo purchased distressed securities, which could be converted into a controlling interest in the equity of the company through a bankruptcy reorganization or other restructuring. Apollo used distressed debt as an entry point, enabling the firm to invest in such firms as Vail Resorts, Walter Industries, Culligan, and Samsonite.
Apollo acquired interests in companies that Drexel had helped finance by purchasing high-yield bonds from failed savings and loans and insurance companies. Apollo acquired several large portfolios of assets from the U.S. government's Resolution Trust Corporation. One of Apollo's earliest and most successful deals involved the acquisition of Executive Life Insurance Company's bond portfolio. Using this vehicle, Apollo purchased the Executive Life portfolio, profiting when the value of high-yield bonds recovered, but also resulting in a variety of state regulatory issues for Apollo and Credit Lyonnais over the purchase.
In 1993, Apollo Real Estate Advisers was founded in collaboration with William Mack to seek opportunities in the U.S. property markets.
In April 1993, Apollo Real Estate Investment Fund, L.P., the first in a family of real estate "opportunity funds", was closed with $500 million of investor commitments. In 2000, Apollo exited the partnership, which continued to operate as Apollo Real Estate Advisers until changing its name to AREA Property Partners effective January 15, 2009. That firm was then owned and controlled by its remaining principals, including William Mack, Lee Neibart, William Benjamin, John Jacobsson, Stuart Koenig, and Richard Mack.
1995–1999: Investment funds III-IV
In 1995, Apollo raised its third private-equity fund, Apollo Investment Fund III, with $1.5 billion of investor commitments from investors that included CalPERS and the General Motors pension fund. Fund III was only an average performer for private-equity funds of its vintage. Among the investments made in Fund III (invested through 1998) were: Alliance Imaging, Allied Waste Industries, Breuners Home Furnishings, Levitz Furniture, Communications Corporation of America, Dominick's, Ralphs (acquired Apollo's Food-4-Less), Move.com, NRT Incorporated, Pillowtex Corporation, Telemundo, and WMC Mortgage Corporation.
Also in 1995, Apollo's founding partner Craig Cogut left the firm to found Pegasus Capital Advisors. Since its inception, Pegasus has raised $1.8 billion in four private-equity funds focused on investments in middle-market companies in financial distress.
In 1997, Ares Management was founded by Antony Ressler and John H. Kissick, both partners at Apollo, as well as Bennett Rosenthal, who joined the group from the global leveraged finance group at Merrill Lynch, to manage a $1.2 billion market value collateralized debt obligation vehicle. Ares I and II which were raised were structured as market value CLOs. Ares III-Ares X were structured as cash flow CLOs. In 2002, Ares completed a corporate spin-off from Apollo management. Although technically the founders of Ares had completed a spinout with the formation of the firm in 1997, they had maintained a close relationship with Apollo over its first five years and operated as the West Coast affiliate of Apollo. Shortly thereafter, Ares completed fundraising for Ares Corporate Opportunities Fund, a special-situations investment fund with $750 million of capital under management.
In 1998, during the dot-com bubble, Apollo raised Apollo Investment Fund IV with $3.6 billion of investor commitments. As of April 8, 2008, the fund had generated a 10% IRR net of fees. Among the investments made in Fund IV (invested through 2001) were: Allied Waste Industries, AMC Entertainment, Berlitz International, Clark Retail Enterprises, Corporate Express (Buhrmann), Encompass Services Corporation, National Financial Partners, Pacer International, Rent-A-Center, Resolution Performance Products, Resolution Specialty Materials, Sirius Satellite Radio, SkyTerra Communications, United Rentals, and Wyndham Worldwide.
2000–2004: Investment fund V
In April 2001, Apollo raised Apollo Investment Fund V with $3.7 billion of investor commitments. As of April 8, 2008, the fund had generated a 54% IRR net of fees. Among the investments made in Fund V (invested through 2006) were Affinion Group, AMC Entertainment, Berry Plastics, Cablecom, Compass Minerals, General Nutrition Centers (GNC), Goodman Global, Hexion Specialty Chemicals (Borden), Intelsat, Linens 'n Things, Metals USA, Nalco Investment Holdings, Sourcecorp, Spectrasite Communications, and Unity Media.
Although the founders of Ares had completed a corporate spin-off with the formation of the firm in 1997, they had initially maintained a close relationship with Apollo and operated as the West Coast affiliate of Apollo. In 2002, when Ares raised its first corporate opportunities fund, the firm announced that it would separate from its former parent company. The timing of this separation also coincided with Apollo's legal difficulties with the State of California over its purchase of Executive Life Insurance Company in 1991. The same year, Attorney General of California Bill Lockyer accused Leon and an investor group led by French bank Credit Lyonnais of violating California law by having a foreign government-owned bank acquire the assets and bond portfolio of Executive Life Insurance.
In April 2004, Apollo raised $930 million through an initial public offering for a listed business development company, Apollo Investment Corporation. In September 2004, investment funds managed by Apollo and Sterling Partners acquired Connections Academy. It was sold in 2011 for $400 million.
2005–2009: Investment fund VI-VII
In 2005, Apollo formed Hexion Specialty Chemicals through the merger of Borden, Inc., Resolution Performance Products LLC, and Resolution Specialty Materials, LLC, and the acquisition of Bakelite AG. Hexion announced in July 2007 that it was acquiring Huntsman Corporation, a major specialty-chemicals company, in a $6.5 billion leveraged buyout. Hexion announced in June 2008 it would refuse to close the deal, prompting a series of legal actions. The transaction was terminated in December after a settlement between Hexion and Huntsman, wherein they were required to pay Huntsman $1 billion to drop fraud charges.
Between 2005 and 2007, the private equity market was booming. Among Apollo's most notable investments during this period were Harrah's Entertainment, Norwegian Cruise Line, Claire's Stores, and Realogy.
In 2006, Apollo acquired Rexnord Corporation for $1.825 billion, Berry Plastics for $2.25 billion, Momentive Performance Materials for approximately $3.8 billion, and TNT N.V. for $1.9 billion.
In August 2006, Apollo launched a $2 billion vehicle in Europe, AP Alternative Assets. It was a Guernsey-domiciled publicly traded, private-equity closed-end, limited partnership, managed by Apollo Alternative Assets, an affiliate of Apollo Management. Apollo initially attempted to raise $2.5 billion for the public vehicle, but fell short when it offered the shares in June 2006, raising only $1.5 billion. Apollo raised an additional $500 million via private placements in the weeks following that sale. AAA was formed to invest alongside Apollo's main private-equity funds and hedge funds. AAA's investment portfolio was made up of a mix of private-equity and capital-markets investments. It was liquidated in 2020.
In October 2006, Apollo announced a $990 million leveraged buyout of Jacuzzi Brands, a manufacturer of whirlpool baths. In 2006, Apollo acquired International Paper's coated paper and supercalendered paper business for $1.4 billion, renaming the business Verso Paper. Verso is the second-largest producer of the North American magazine publishing and catalog/commercial print markets. In May 2008, Verso became a public company via an IPO.
In February 2007, Apollo acquired Oceania Cruises for $850 million and provided additional capital to fund the expansion of the company with the purchase of two new cruise ships.
In February 2007, Apollo announced the acquisition of the Smart & Final chain of warehouse-style food and supply stores. In June 2007, Smart & Final completed the acquisition of the Henry's Marketplace chain of "farmers market" style food retailers from Wild Oats Markets as part of that company's acquisition by Whole Foods Market. In 2011, the Henry's chain was merged with Sprouts Farmers Market, which, like the Henry's markets, had been founded by Henry Boney.
In March 2007, Apollo announced the $3.1 billion leveraged buyouts of costume jewelry retailer Claire's Stores. In 2008, Claire's experienced financial difficulty amid the slump in consumer spending.
In April 2007, Apollo acquired Noranda Aluminum, the US aluminum business of Xstrata for $1.15 billion. Noranda Aluminum includes a primary smelter and three rolling mills in Tennessee, North Carolina, and Arkansas along with other operations.
In April 2007, Apollo acquired Realogy, a franchisor that owns Coldwell Banker, Century 21, and Sotheby's International Realty, for $8.5 billion. As the United States housing market correction accelerated in 2008, Realogy faced financial pressures due to its debt load. In November 2008, Realogy launched an exchange offer for a portion of its debt to provide additional flexibility, prompting a lawsuit from Carl Icahn. In 2013, Apollo sold out of this investment, making a profit of $1.3 billion.
In May 2007, Apollo acquired Countrywide plc, a provider of residential property-related services in the UK, formerly known as Hambro Countrywide (1988) and Countrywide Assured Group (1998) for $1.05 billion (not related to Countrywide Financial).
In November 2007, the company sold 9% of itself to the Abu Dhabi Investment Authority.
In January 2008, Apollo and TPG Capital acquired Harrah's Entertainment for $27.4 billion, including the assumption of existing debt.
In January 2008, Apollo invested $1 billion in Norwegian Cruise Line to support a recapitalization of the company's balance sheet. In December 2018, Apollo cashed out of this investment.
In February 2008, Apollo acquired Regent Seven Seas Cruises from Carlson Companies for $1 billion. Following the purchase, Apollo ordered a new ship for Regent.
In April 2008, Apollo, TPG Capital, and The Blackstone Group acquired $12.5 billion of bank loans from Citigroup. The portfolio comprised primarily senior secured loans that had been made to finance leveraged-buyout transactions at the peak of the market. Citigroup had been unable to syndicate the loans before the onset of the credit crunch. The loans were reported to have been sold in the "mid-80 cents on the dollar" relative to face value. In late 2008, Apollo received margin calls associated with the financing of its purchase of certain loan portfolios as the values of the loans decreased.
In April 2008, Apollo filed a Form S-1 with the U.S. Securities and Exchange Commission in preparation for an IPO on the New York Stock Exchange.
In May 2008, Apollo invested in Vantium, a company that buys residential mortgage assets as part of a strategy to profit from the United States housing market correction.
In July 2008, the company closed a $758 million value-add fund.
Also in 2008, Apollo opened an office in India, its first office in Asia.
During the 2008 financial crisis, several of Apollo's investments came under pressure. Apollo's 2005 investment in the struggling US retailer Linens 'n Things suffered from a significant debt burden and softening consumer demand. In May 2008, Linens filed for bankruptcy protection, costing Apollo all of its $365 million investment in the company. In 2009, the company was sued by a noteholder claiming mismanagement.
Apollo exercised its "PIK toggle" option at Claire's to shut off cash interest payments to its bondholders and instead issue more debt, to provide the company with additional financial flexibility.
In December 2008, Apollo completed fundraising for its latest fund, Apollo Investment Fund VII, with roughly $14.7 billion of investor commitments. Apollo had been targeting $15 billion, but had been in fundraising for more than 16 months, with the bulk of the capital raised in 2007.
2010–2014: Public company via an IPO
In November 2009, Liberty Global acquired Unity Media GMBH; funds managed by Apollo owned a 31% interest.
In December 2009, Apollo announced the acquisition of Cedar Fair Entertainment Company for $635 million and assumed debt valuing the company at $2.4 billion. In April 2010, the deal was terminated due to poor shareholder response.
In January 2011, Apollo acquired 51% of Alcan Engineered Products from Rio Tinto Group.
On March 29, 2011, Apollo became a public company via an IPO.
In June 2011, Apollo acquired CKx.
In March 2012, Apollo acquired the unprofitable Great Wolf Resorts for $703 million.
In November 2012, Apollo acquired McGraw-Hill Education for $2.5 billion.
In 2013, Apollo acquired Pitney Bowes Management Services (PBMS) for $400 million. From PBMS, Apollo formed Novitex Enterprise Solutions. Novitex is a document-outsourcing provider that manages business-critical services for over 500 companies across 10 industries. In 2017, it was merged into Exela Technologies.
On March 11, 2013, Apollo Global Management made the only bid for the snacks business of Hostess Brands, including Twinkies, for $410 million.
In December 2013, Apollo bought a portfolio of Irish home loans from Lloyds Bank for €307 million, less than half their face value. The shares were bought by an Apollo Global Management subsidiary, Tanager Limited.
In January 2014, Apollo acquired Chuck E. Cheese's for about $1 billion. Apollo owned the company until 2020, when it was purchased by Monarch Alternative Capital.
In October 2014, Apollo merged its Endemol television studio with 21st Century Fox's Shine Group. The merged company became Endemol Shine Group, with AGM and Fox each owning half of the studio.
2015–2019
In May 2015, Centerbridge Partners acquired Great Wolf Resorts from Apollo for $1.35 billion.
In June 2015, Apollo agreed to acquire OM Group for $1.03 billion.
Also in June 2015, Apollo won the bidding during an auction for Saint-Gobain's Verallia glass bottle-manufacturing unit for €2.95 billion.
In February 2016, Apollo agreed to acquire The ADT Corporation for $6.9 billion.
In April 2016, Apollo executive Stephanie Drescher donated $1000 to the presidential campaign of John Kasich, then Ohio governor. As governor, Kasich appointed a member to the Ohio state pension board. This donation violated an SEC pay-to-play pension rule. In 2019, the SEC chose not to enforce the rule.
In June 2016, funds managed by Apollo Global Management acquired Diamond Resorts International. It was sold to Hilton Worldwide in August 2021.
In November 2016, investment funds managed by Apollo acquired Rackspace.
In 2016, investment funds managed by Apollo acquired Constellis for $1 billion. Constellis is a private military contractor that was created as a result of a merger between rival contractors Triple Canopy and Academi in 2014. Academi, founded by Erik Prince and formerly known as Blackwater USA, is best known for its role in the Nisour Square massacre, where Blackwater guards killed 17 Iraqi civilians and injured 20.
In February 2017, Apollo Education Group, the parent company of the University of Phoenix, was acquired by investment funds managed by Apollo and the Vistria Group, for $1.14 billion.
In June 2017, investment funds managed by Apollo acquired 80.1% of Philips Lumileds division for $1.5 billion.
In October 2017, Apollo acquired West Corp for about $2 billion.
In November 2017, Apollo lent $184 million to Kushner Companies to refinance the mortgage on a Chicago skyscraper.
In March 2018, Apollo acquired the Mexican-style restaurant chain Qdoba from Jack in the Box.
In June 2018, funds managed by Apollo and Värde Partners acquired a majority of OneMain Financial. Also in June 2018, Apollo acquired healthcare provider LifePoint Health for $5.6 billion. Following the acquisition, LifePoint merged with Apollo's RCCH HealthCare Partners.
In October 2018, funds managed by Apollo Global Management acquired a portfolio of $1 billion in energy investments from GE Capital's Energy Financial Services unit.
In February 2019, AGM was in talks to buy Nexstar Media Group for over $1 billion. However, on February 14, 2019, Cox Media Group announced that it was selling its 14 television stations to Apollo. In March 2019 filings with the Federal Communications Commission (FCC), Apollo disclosed that, through the newly formed Terrier Media, the Cox stations would be acquired for $3.1 billion (to be reduced by the value of a minority equity stake in Terrier that will be retained by Cox Enterprises); Terrier will also concurrently acquire Northwest Broadcasting, giving the company 25 television stations. On June 26, 2019, Cox announced that its 60 radio stations, as well as its national advertising business CoxReps, and local OTT advertising agency Gamut, would also be acquired by the new company, which concurrently announced that it would retain the Cox Media Group name instead of Terrier Media. On February 10, 2020, Cox Enterprises bought back the Ohio newspapers it sold to AGM. The FCC required Apollo to reduce the daily newspapers to three days or sell them.
In February 2019, Apollo acquired Aspen Insurance for $2.6 billion.
On April 16, 2019, Apollo announced that it would once again acquire Smart & Final for $1.1 billion.
On June 10, 2019, Apollo announced that it would acquire Shutterfly for $2.7 billion, as well as its competitor Snapfish in a separate transaction valued at around $300 million, with District Photo as a minority stakeholder.
In August 2019, Apollo agreed to provide around $1.8 billion of debt financing to support New Media Investment Group's acquisition of Gannett. On October 23, 2019, AGM announced it signed agreements to take a 48.6% stake in Italian gambling group Gamenet SPA.
In November 2019, investment funds managed by Apollo acquired Florida-based Tech Data Corp. for $5.4 billion from Warren Buffett's Berkshire Hathaway.
In December 2019, investment funds managed by Apollo acquired Northwest Broadcasting and Cox Media Group for $3 billion, acquiring Northwest's 12 television stations, Cox's 13 television stations, 54 radio stations, three newspapers, national television advertising business – CoxReps, and local OTT advertising business – Gamut. Smart Media.
2020–2024
In February 2020, investment funds managed by Apollo acquired Covis from Cerberus Capital Management. In April, AGM announced that it would invest $300 million in Cimpress, an Irish-domiciled printing group that owns Vistaprint.
In May 2020, Apollo purchased $1.75 billion of preferred stock in Albertsons Companies.
In July 2020, Apollo launched a $12 billion platform to make big loans. The same month, Apollo and The Walt Disney Company sold Endemol Shine Group to the French studio Banijay Group.
In September 2020, Apollo entered into a $5.5 billion real-estate investment partnership with the Abu Dhabi National Oil Company (ADNOC).
In March 2021, Apollo Investment Corporation closed a $110 million mezzanine credit facility between LendingPoint and MidCap Financial Trust. In the same month, Leon Black resigned as CEO and chairman after revelations that he paid Jeffrey Epstein $158 million for personal tax-related advice between 2012 and 2017; he was replaced as CEO by Marc Rowan.
In April 2021, Apollo launched Apollo Origination Partnership, a $1.8 billion direct-lending fund seeking unleveraged returns of 8-10% and 12-14% leveraged returns. The same month, funds managed by Apollo acquired The Michaels Companies, parent of Michaels.
In May 2021, Apollo's Gamenet acquired the Italian gaming businesses of International Game Technology for €950 million. In July, funds managed by Apollo acquired EmployBridge, a large American industrial-staffing company that has been cited for dozens of safety violations and wage infractions.
On July 22, 2021, it was announced that Legendary Entertainment was looking for a merger instead of a SPAC. On January 31, 2022, a minority stake in Legendary was sold to Apollo Global Management, with Wanda Group remaining the majority owner.
In August 2021, Apollo announced the acquisition of the incumbent local exchange carrier operations in 20 states from Lumen Technologies for $7.5 billion, including $1.4 billion of assumed debt. The same month, Apollo launched a $500 million fund to invest in SPACs.
In September 2021, investment funds managed by Apollo acquired 90% of Yahoo!.
In January 2022, Apollo acquired Athene, a retirement services business. The same month, co-founder Josh Harris left the company to focus on other business ventures.
In May 2022, Apollo acquired the US asset management business of Griffin Capital. In July, investment funds managed by Apollo acquired Tenneco for $7.1 billion.
In 2022, investment funds managed by Apollo acquired Chicago-based grocer Tony's Fresh Market, California-based grocer Cardenas, and Miller Homes from Bridgepoint Group. In 2023, Apollo announced it would acquire American industrial company Arconic.
In October 2023, Apollo acquired London-based restaurant group The Restaurant Group for £506 million ($623 million).
In June 2024, Apollo announced the acquisition of a 49% equity interest in a joint venture entity related to Intel Ireland's Fab 34 for €10.1 billion ($11 billion). Apollo Global and Kyndryl Holdings were in talks to jointly bid for DXC Technology, considering an offer of $22 to $25 per share, which boosted DXC's stock by 11%.
In November 2024, Apollo partnered with Shinhan Life, the life insurance arm of Shinhan Financial Group, and opened an office in Seoul as part of its Asia-Pacific expansion.
2025–2029
In January 2025, Apollo acquired Barnes Group, an American aerospace company. In February, Apollo announced that a fund managed by Apollo affiliates acquired a majority stake in Bold Productions Services, a production-linked provider. Also that month, Apollo agreed to acquire the American real-estate investment company Bridge Investment Group for $1.5 billion.
In July, Apollo-backed insurance company Athora purchased Pension Insurance Corporation, a British company, for $7.8 billion. In September, Apollo announced plans to launch a £3.75bn investment vehicle focused on sport.
In October 2025, Apollo discussed with Paramount Skydance about joining David Ellison's possible bid to buy Warner Bros. Discovery – a megadeal that could cost upwards of $60 billion.
In November 2025, Apollo acquired 55% of the shares of Atlético Madrid, becoming the majority shareholder of the club. In December 2025, it was announced Apollo had also acquired a minority stake in Wrexham A.F.C., a professional football club based in Wrexham, Wales for an undisclosed amount.
In April 2026, Intel announced an agreement to repurchase the 49% stake in a joint venture with Apollo for $14.2 billion.
On July 10 it was announced that European low-cost airline EasyJet had accepted a bid from Apollo Global Management, which valued the business at £5.7 billion. EasyJet confirmed on 6 August that, subject to rigorous EU regulatory approval, Apollo will take over the company for £5.7-billion ($7.7-billion) after rival bidder Castlelake pulled out of the bidding.
Private-equity funds
Since its inception in 1990, Apollo has raised ten flagship private equity funds, as follows:
Investigations
Leon Black's payments to Jeffrey Epstein and leadership transition
In 2021, Apollo co-founder and then-CEO Leon Black stepped down amid scrutiny over his financial relationship with financier Jeffrey Epstein, including reporting that Black paid Epstein $158 million for tax and estate planning advice and related services. The episode drew broader attention because Epstein was later federally charged in the Southern District of New York with sex trafficking-related offenses.
Regulatory and investigative scrutiny tied to Epstein-linked finance
Separately from Apollo's internal leadership matters, lawmakers and regulators have continued examining financial institutions and transactions connected to Epstein's network. In late 2025, Senate Finance Committee Ranking Member Ron Wyden stated his "follow-the-money" investigation into Epstein's network would continue, and referenced an "Epstein file" held by the Treasury Department.
DOJ document releases referencing Apollo executives
In 2026, the U.S. Department of Justice began publishing a repository of Epstein-related records (often described as the "Epstein files"), which includes searchable document sets and indexes. Materials in the repository include entries that reference current Apollo leadership, including Marc Rowan and Scott Kleinman; the presence of names in the repository does not by itself establish the nature or context of any interaction without the underlying document detail. In response to the contents of the files, the American Federation of Teachers and American Association of University Professors called on the SEC to investigate Apollo for giving investors "an inaccurate and incomplete picture of the firm and its partners' connections to Epstein".
Źródło: Wikipedia (Angielski), CC BY-SA 4.0 · Zobacz w Wikipedii ↗
Wyniki 10-letnie Trendy przychodów, zysku netto, marż i EPS
Wycena Wskaźniki P/E, P/S, P/B, EV/EBITDA — czy akcje są drogie, czy tanie?
| Wskaźnik | Trend 5-letni | APO | średnia z 5 lat | Mediana porównawcza | Werdykt |
|---|---|---|---|---|---|
| P/E (TTM) | 20.9średnia z 5 lat ≈10.3 | ≈10.3 | 27.5 | Wartość godziwa | |
| P/S (TTM) | 2.1średnia z 5 lat ≈2.8 | ≈2.8 | 1.1 | Zawyżona wycena | |
| P/B (MRQ) | 2.9średnia z 5 lat ≈26.1 | ≈26.1 | 1.3 | Zawyżona wycena | |
| Price / Cash Flow (Cena / Przepływy pieniężne) | 9.3średnia z 5 lat ≈14.6 | ≈14.6 | 7.9 | Zawyżona wycena | |
| Price / Tangible Book (Cena / Wartość księgowa materialna) | 3.9średnia z 5 lat ≈8.3 | ≈8.3 | · | · | |
| PEG Ratio (Współczynnik PEG) | ≈0.3 | · | · | · |
Mediana porównawcza jest obliczana na znormalizowanej podstawie dla każdej metryki i może nie zawsze odpowiadać podstawie TTM/MRQ pokazanej dla tej akcji.
Rentowność Marże brutto, operacyjne i netto; ROE, ROA, ROIC
| Wskaźnik | Trend 5-letni | APO | średnia z 5 lat | Mediana porównawcza | Werdykt |
|---|---|---|---|---|---|
| EBITDA Margin (Marża EBITDA) | 4.5%średnia z 5 lat ≈4.1% | ≈4.1% | 4.4% | Zgodnie z | |
| Marża przed opodatkowaniem (TTM) | 20.8%średnia z 5 lat ≈3.3% | ≈3.3% | 11.3% | Najwyższa półka | |
| Marża Zysku Netto (TTM) | 10.9%średnia z 5 lat ≈3.7% | ≈3.7% | 7.9% | Najwyższa półka | |
| ROA (TTM) | 0.83%średnia z 5 lat ≈0.41% | ≈0.41% | 0.17% | Najwyższa półka | |
| ROE (TTM) | 17.2%średnia z 5 lat ≈-15.4% | ≈-15.4% | 1.8% | Najwyższa półka |
Zdrowie finansowe Dług, płynność, wypłacalność — siła bilansu
Za mało danych fundamentalnych, aby obliczyć tę grupę wskaźników.
Rozwój Wzrost przychodów, EPS i zysku netto: r/r, CAGR 3-letni, CAGR 5-letni
| Wskaźnik | Trend 5-letni | APO | średnia z 5 lat | Mediana porównawcza | Werdykt |
|---|---|---|---|---|---|
| Revenue YoY (Przychody R/R) | 22.7%średnia z 5 lat ≈71.2% | ≈71.2% | · | · | |
| Revenue CAGR 3Y (Przychody CAGR 3L) | 43.0%średnia z 5 lat ≈82.3% | ≈82.3% | · | · | |
| Revenue CAGR 5Y (Przychody CAGR 5L) | 68.6% | · | · | · | |
| EPS YoY | -24.4% | · | · | · | |
| Net Income YoY (Zysk Netto R/R) | -23.7% | · | · | · | |
| EPS CAGR 3Y (CAGR z EPS 3 lata) | 0.05% | · | · | · | |
| EPS CAGR 5Y (CAGR z EPS 5 lat) | 66.0% | · | · | · | |
| Net Income CAGR 3Y (CAGR z zysku netto 3 lata) | 35.5% | · | · | · | |
| Net Income CAGR 5Y (CAGR z zysku netto 5 lat) | 86.0% | · | · | · |
Efektywność kapitałowa Rotacja aktywów, rotacja zapasów, rotacja należności
| Wskaźnik | Trend 5-letni | APO | średnia z 5 lat | Mediana porównawcza | Werdykt |
|---|---|---|---|---|---|
| Asset Turnover (Rotacja aktywów) | 0.1średnia z 5 lat ≈0.1 | ≈0.1 | 0.0 | Najwyższa półka | |
| Revenue / Employee (Przychody / pracownika) | ≈$5.2M | · | · | · |
wartość · ≈ średnia z 5 lat · mediana branżowa · werdykt względem mediany
Dywidendy Stopa dywidendy, wskaźnik wypłaty, historia dywidend, 5-letni CAGR
| Data ex-dywidendy | Kwota | Waluta | Stopa zwrotu |
|---|---|---|---|
| Sie 19, 2026 | $0,56 | USD | ≈1.6% |
| Maj 19, 2026 | $0,56 | USD | ≈1.6% |
| Lut 19, 2026 | $0,51 | USD | ≈1.7% |
| Lis 17, 2025 | $0,51 | USD | ≈1.6% |
| Sie 18, 2025 | $0,51 | USD | ≈1.4% |
| Maj 16, 2025 | $0,51 | USD | ≈1.3% |
| Lut 18, 2025 | $0,46 | USD | ≈1.1% |
| Lis 18, 2024 | $0,46 | USD | ≈1.1% |
| Sie 16, 2024 | $0,46 | USD | ≈1.6% |
| Maj 16, 2024 | $0,46 | USD | ≈1.6% |
| Lut 16, 2024 | $0,43 | USD | ≈1.5% |
| Lis 16, 2023 | $0,43 | USD | ≈2.0% |
| Sie 17, 2023 | $0,43 | USD | ≈2.1% |
| Maj 19, 2023 | $0,43 | USD | ≈2.6% |
| Lut 17, 2023 | $0,40 | USD | ≈2.2% |
| Lis 16, 2022 | $0,40 | USD | ≈2.6% |
| Sie 17, 2022 | $0,40 | USD | ≈2.9% |
| Maj 17, 2022 | $0,40 | USD | ≈3.3% |
| Lut 17, 2022 | $0,40 | USD | ≈2.9% |
| Lis 18, 2021 | $0,50 | USD | ≈2.8% |
Historia zysków EPS faktyczny vs szacowany, zaskoczenie %, wskaźnik trafień, data następnych wyników
| Okres | Raport | EPS Actual | EPS Szacowany | Niespodzianka |
|---|---|---|---|---|
| 30 czerwca 2026 | Sie 3, 2026 | $2.11 | $2.20 | -3.9% |
| 31 marca 2026 | $1.94 | $1.95 | -0.52% | |
| 31 grudnia 2025 | $2.47 | $2.07 | 19.3% | |
| 30 września 2025 | $2.17 | $1.93 | 12.4% | |
| 30 czerwca 2025 | $1.92 | $1.86 | 3.1% | |
| 31 marca 2025 | $1.82 | $1.89 | -3.4% |
Pełne podstawowe wskaźniki Wszystkie wskaźniki roczne — rachunek zysków i strat, bilans, przepływy pieniężne
Rachunek zysków i strat
| Wskaźnik | Trend | 2025 | 2024 | 2023 | 2022 | 2021 |
|---|---|---|---|---|---|---|
| Revenue | $32.05B | $26.11B | $32.64B | $10.97B | $5.95B | |
| Operating Expenses | $25.29B | $18.98B | $27.33B | $15.91B | $4.11B | |
| Pretax Income | $6.68B | $7.43B | $5.59B | $-4.25B | $4.86B | |
| Income Tax | $1.28B | $1.06B | $-923M | $-739M | $594M | |
| Net Income | $3.49B | $4.58B | $5.05B | $-1.96B | $1.84B | |
| EPS (Basic) | $5.58 | $7.39 | $8.32 | $-3.43 | $7.32 | |
| EPS (Diluted) | $5.54 | $7.33 | $8.28 | $-3.43 | $7.32 | |
| Shares (Basic) | 589,500,000 | 586,100,000 | 581,400,000 | 584,700,000 | 236,600,000 | |
| Shares (Diluted) | 593,700,000 | 604,000,000 | 588,800,000 | 584,700,000 | 236,600,000 | |
| EBITDA | $1.43B | $1.07B | $803M | $594M | · |
Bilans
| Wskaźnik | Trend | 2025 | 2024 | 2023 | 2022 | 2021 |
|---|---|---|---|---|---|---|
| Cash & Equivalents | · | · | · | $8.98B | $917M | |
| Goodwill | $5.92B | $4.33B | $4.33B | $4.32B | $117M | |
| Total Assets | $460.95B | $377.89B | $313.49B | $257.22B | $30.50B | |
| Total Liabilities | $418.43B | $346.92B | $288.24B | $241.82B | $18.54B | |
| Long-term Debt | $13.36B | $10.59B | $8.09B | $6.47B | $3.13B | |
| Common Stock | $0 | $0 | $0 | $0 | $0 | |
| Paid-in Capital | $16.95B | $15.33B | $15.25B | $14.98B | $2.10B | |
| Retained Earnings | $7.63B | $6.02B | $2.97B | $-1.01B | $1.14B | |
| AOCI | $-2.65B | $-5.49B | $-5.58B | $-7.33B | $-5M | |
| Stockholders' Equity | $23.34B | $17.25B | $14.04B | $6.64B | $3.79B | |
| Liabilities + Equity | $460.95B | $377.89B | $313.49B | $257.22B | $30.50B | |
| Shares Outstanding | 578,981,398 | 565,738,933 | 567,762,932 | 570,276,188 | 249,000,000 |
Przepływy pieniężne
| Wskaźnik | Trend | 2025 | 2024 | 2023 | 2022 | 2021 |
|---|---|---|---|---|---|---|
| D&A | $1.43B | $1.07B | $803M | $529M | $27M | |
| Stock-based Comp | $789M | $721M | $1.03B | $540M | $1.18B | |
| Deferred Tax | $643M | $-99M | $-1.90B | $-1.25B | $475M | |
| Other Non-cash | $891M | $-3.02B | $1.35B | $7.46B | · | |
| Operating Cash Flow | $7.25B | $3.25B | $6.32B | $3.79B | $1.06B | |
| Investing Cash Flow | $-63.97B | $-61.80B | $-42.41B | $-23.44B | $-1.55B | |
| Debt Issued | $7.22B | $7.95B | $4.91B | $5.75B | $1.33B | |
| Net Debt Issued | $2.57B | $2.69B | $1.13B | $1.71B | · | |
| Stock Repurchased | $773M | $890M | $561M | $635M | $299M | |
| Net Stock Activity | $-773M | $-890M | $-561M | $-635M | · | |
| Dividends Paid | $1.20B | $1.09B | $1.01B | $962M | $517M | |
| Financing Cash Flow | $60.20B | $57.97B | $42.64B | $28.71B | $109M | |
| Net Change in Cash | $3.48B | $-579M | $6.56B | $9.04B | $-379M | |
| Taxes Paid | $590M | · | · | · | · |
Rentowność
| Wskaźnik | Trend | 2025 | 2024 | 2023 | 2022 | 2021 |
|---|---|---|---|---|---|---|
| Net Margin | 10.9% | 17.5% | 15.5% | -29.3% | · | |
| Pretax Margin | 20.8% | 28.5% | 17.1% | -53.0% | · | |
| EBITDA Margin | 4.5% | 4.1% | 2.5% | 5.4% | · | |
| ROA | 0.83% | 1.3% | 1.7% | -2.2% | · | |
| ROE | 17.2% | 29.2% | 45.6% | -153.5% | · |
Efektywność
| Wskaźnik | Trend | 2025 | 2024 | 2023 | 2022 | 2021 |
|---|---|---|---|---|---|---|
| Asset Turnover | 0.1 | 0.1 | 0.1 | 0.1 | · |
Na akcję
| Wskaźnik | Trend | 2025 | 2024 | 2023 | 2022 | 2021 |
|---|---|---|---|---|---|---|
| Book Value / Share | $40.31 | $30.50 | $24.74 | $0.70 | · | |
| Revenue / Share | $53.98 | $43.24 | $55.44 | $18.76 | · | |
| Cash Flow / Share | $12.20 | $5.39 | $10.74 | $6.48 | · | |
| Cash / Share | · | · | · | $15.75 | · | |
| Dividend / Share | $1.99 | $1.81 | $1.69 | $1.60 | $2.10 | |
| EPS (TTM) | $5.54 | $7.33 | $8.28 | $-3.43 | · |
Stopy Wzrostu
| Wskaźnik | Trend | 2025 | 2024 | 2023 | 2022 | 2021 |
|---|---|---|---|---|---|---|
| Revenue YoY | 22.7% | -20.0% | 197.6% | 84.3% | 152.8% | |
| Revenue CAGR 3Y | 43.0% | 63.7% | 140.2% | · | · | |
| Revenue CAGR 5Y | 68.6% | · | · | · | · | |
| EPS YoY | -24.4% | -11.5% | · | · | 1563.6% | |
| EPS CAGR 3Y | · | 0.05% | 166.0% | · | · | |
| EPS CAGR 5Y | 66.0% | · | · | · | · | |
| Net Income YoY | -23.7% | -9.3% | · | · | 1071.3% | |
| Net Income CAGR 3Y | · | 35.5% | 218.0% | · | · | |
| Net Income CAGR 5Y | 86.0% | · | · | · | · | |
| Dividends Paid CAGR 5Y | 16.9% | · | · | · | · |
Wycena (TTM)
| Wskaźnik | Trend | 2025 | 2024 | 2023 | 2022 | 2021 |
|---|---|---|---|---|---|---|
| Revenue TTM | $32.05B | $26.11B | $32.64B | $10.97B | · | |
| Net Income TTM | $3.49B | $4.58B | $5.05B | $-1.96B | · | |
| Market Cap | $83.81B | $93.44B | $52.91B | $36.38B | · | |
| P/E | 26.1 | 22.5 | 11.3 | -18.6 | · | |
| P/S | 2.6 | 3.6 | 1.6 | 3.3 | · | |
| P/B | 3.6 | 5.4 | 3.8 | 91.6 | · | |
| P / Tangible Book | 4.8 | 7.2 | 5.4 | 15.7 | · | |
| P / Cash Flow | 11.6 | 28.7 | 8.4 | 9.6 | · | |
| Dividend Yield | 1.4% | 1.2% | 1.9% | 2.6% | · | |
| Earnings Yield | 3.8% | 4.4% | 8.9% | -5.4% | · | |
| Payout Ratio | 34.4% | 23.9% | 20.1% | -29.9% | · | |
| Annual Payout | $1.20B | $1.09B | $1.01B | $962M | · |
Rachunek zysków i strat
| Wskaźnik | Trend | Q4 2025 | Q3 2025 | Q2 2025 | Q1 2025 | Q4 2024 | Q3 2024 | Q2 2024 | Q1 2024 | Q4 2023 | Q3 2023 | Q2 2023 | Q1 2023 | Q4 2022 | Q3 2022 | Q2 2022 | Q1 2022 |
|---|---|---|---|---|---|---|---|---|---|---|---|---|---|---|---|---|---|
| Revenue | $9.86B | $9.82B | $6.81B | $5.55B | $5.28B | $7.77B | $6.02B | $7.04B | $11.05B | $2.60B | $13.70B | $5.30B | $4.84B | $2.98B | $2.29B | $862M | |
| Operating Expenses | $8.16B | $7.07B | $5.72B | $4.34B | $3.69B | $5.82B | $4.58B | $4.89B | $9.18B | $1.75B | $12.83B | $3.57B | $3.65B | $4.02B | $5.45B | $2.78B | |
| Pretax Income | $1.75B | $2.90B | $845M | $1.18B | $1.72B | $2.09B | $1.44B | $2.19B | $1.96B | $883M | $951M | $1.79B | $1.23B | $-945M | $-2.99B | $-1.54B | |
| Income Tax | $592M | $438M | $3M | $243M | $62M | $317M | $261M | $422M | $-1.62B | $243M | $201M | $253M | $223M | $-96M | $-381M | $-485M | |
| Net Income | $684M | $1.74B | $630M | $442M | $1.49B | $811M | $853M | $1.43B | $2.76B | $682M | $599M | $1.01B | $2.27B | $-563M | $-1.64B | $-401M | |
| EPS (Basic) | $1.08 | $2.82 | $1.00 | $0.68 | $2.42 | $1.30 | $1.36 | $2.31 | $4.55 | $1.10 | $1.00 | $1.67 | $1.07 | $-0.98 | $-2.82 | $-0.70 | |
| EPS (Diluted) | $1.09 | $2.78 | $0.99 | $0.68 | $2.41 | $1.29 | $1.35 | $2.28 | $4.52 | $1.10 | $1.00 | $1.66 | $1.07 | $-0.98 | $-2.82 | $-0.70 | |
| Shares (Basic) | · | 589,400,000 | 586,700,000 | 587,300,000 | · | 585,400,000 | 587,100,000 | 588,100,000 | · | 578,800,000 | 579,000,000 | 584,100,000 | · | 584,300,000 | 584,800,000 | 586,500,000 | |
| Shares (Diluted) | · | 607,800,000 | 590,400,000 | 593,000,000 | · | 588,500,000 | 590,200,000 | 605,400,000 | · | 578,800,000 | 579,000,000 | 584,200,000 | · | 584,300,000 | 584,800,000 | 586,500,000 | |
| EBITDA | · | · | · | $308M | · | · | · | $238M | · | · | · | $165M | · | · | · | $133M |
Bilans
| Wskaźnik | Trend | Q4 2025 | Q3 2025 | Q2 2025 | Q1 2025 | Q4 2024 | Q3 2024 | Q2 2024 | Q1 2024 | Q4 2023 | Q3 2023 | Q2 2023 | Q1 2023 | Q4 2022 | Q3 2022 | Q2 2022 | Q1 2022 |
|---|---|---|---|---|---|---|---|---|---|---|---|---|---|---|---|---|---|
| Cash & Equivalents | · | · | · | · | · | · | · | · | · | · | $12.07B | · | · | $10.94B | $12.72B | $9.77B | |
| Goodwill | $5.92B | · | · | · | $4.33B | · | · | · | · | · | · | · | · | $4.32B | $4.42B | $4.30B | |
| Total Assets | $460.95B | $449.54B | $419.55B | $395.05B | $377.89B | $368.69B | $346.50B | $334.05B | · | $283.24B | $281.98B | · | · | $250.34B | $247.85B | $261.56B | |
| Total Liabilities | $418.43B | $409.75B | $385.69B | $362.70B | $346.92B | $337.15B | $318.09B | $307.04B | · | $265.27B | $264.66B | · | · | $247.45B | $239.69B | $241.28B | |
| Long-term Debt | $13.36B | $12.63B | $12.14B | $10.58B | $10.59B | $9.81B | $9.81B | $9.60B | · | $7.03B | $6.45B | · | · | $6.08B | $6.09B | $6.10B | |
| Common Stock | $0 | $0 | $0 | $0 | $0 | $0 | $0 | $0 | · | $0 | $0 | · | · | $0 | $0 | $0 | |
| Paid-in Capital | $16.95B | $16.93B | $15.70B | $15.53B | $15.33B | $15.07B | $15.32B | $15.17B | · | $14.61B | $14.47B | · | · | $15.26B | $15.41B | $15.76B | |
| Retained Earnings | $7.63B | $7.31B | $5.92B | $5.63B | $6.02B | $4.87B | $4.38B | $3.86B | · | $535M | $153M | · | · | $-2.84B | $-1.94B | $-93M | |
| AOCI | $-2.65B | $-2.49B | $-3.69B | $-4.58B | $-5.49B | $-3.47B | $-5.82B | $-5.64B | · | $-8.10B | $-6.39B | · | · | $-13.76B | $-9.79B | $-4.68B | |
| Stockholders' Equity | $23.34B | $23.14B | $19.32B | $17.98B | $17.25B | $17.86B | $15.27B | $14.79B | · | $8.44B | $8.23B | · | · | $-1.34B | $3.68B | $10.99B | |
| Liabilities + Equity | $460.95B | $449.54B | $419.55B | $395.05B | $377.89B | $368.69B | $346.50B | $334.05B | · | $283.24B | $281.98B | · | · | $250.34B | $247.85B | $261.56B | |
| Shares Outstanding | 578,981,398 | 580,389,090 | 572,024,038 | 570,432,275 | 565,738,933 | 565,816,456 | 569,535,344 | 569,003,922 | 567,762,932 | 567,565,120 | 566,809,153 | · | 570,000,000 | 572,670,634 | 571,028,097 | 570,353,554 |
Przepływy pieniężne
| Wskaźnik | Trend | Q4 2025 | Q3 2025 | Q2 2025 | Q1 2025 | Q4 2024 | Q3 2024 | Q2 2024 | Q1 2024 | Q4 2023 | Q3 2023 | Q2 2023 | Q1 2023 | Q4 2022 | Q3 2022 | Q2 2022 | Q1 2022 |
|---|---|---|---|---|---|---|---|---|---|---|---|---|---|---|---|---|---|
| D&A | $391M | $400M | $332M | $308M | $296M | $281M | $260M | $238M | $217M | $241M | $180M | $165M | $153M | $105M | $94M | $106M | |
| Stock-based Comp | $266M | $208M | $166M | $149M | $243M | $136M | $153M | $189M | $604M | $142M | $140M | $140M | $130M | $117M | $125M | $168M | |
| Other Non-cash | · | · | · | $113M | · | · | · | $-1.78B | · | · | · | $-772M | · | · | · | $-3.42B | |
| Operating Cash Flow | $4.67B | $303M | $1.26B | $1.01B | $-4M | $1.85B | $1.33B | $70M | $2.06B | $-364M | $3.55B | $1.07B | $1.47B | $2.34B | $3.97B | $-3.99B | |
| Investing Cash Flow | $-14.22B | $-13.24B | $-19.63B | $-16.89B | $-16.25B | $-14.47B | $-14.70B | $-16.39B | $-14.69B | $-10.21B | $-11.87B | $-5.64B | $-11.27B | $-11.35B | $-3.92B | $3.10B | |
| Debt Issued | $2.52B | $2.07B | $2.34B | $294M | $1.82B | $472M | $2.83B | $2.83B | $1.09B | $1.40B | $1.21B | $1.20B | $1.99B | $0 | $95M | $3.66B | |
| Net Debt Issued | · | · | · | $-524M | · | · | · | $2.30B | · | · | · | $-655M | · | · | · | $2.96B | |
| Stock Repurchased | $240M | $340M | $0 | $193M | $102M | $453M | $75M | $260M | $26M | $0 | $77M | $458M | $172M | $26M | $211M | $226M | |
| Net Stock Activity | · | · | · | $-193M | · | · | · | $-260M | · | · | · | $-458M | · | · | · | $-226M | |
| Dividends Paid | $311M | $306M | $306M | $278M | $277M | $277M | $279M | $259M | $259M | $256M | $256M | $241M | $240M | $264M | $229M | $229M | |
| Financing Cash Flow | $8.95B | $19.16B | $17.82B | $14.27B | $15.74B | $12.25B | $11.63B | $18.34B | $15.88B | $10.22B | $5.01B | $11.52B | $7.70B | $7.73B | $2.04B | $11.24B | |
| Net Change in Cash | $-610M | $6.23B | $-542M | $-1.60B | $-515M | $-356M | $-1.73B | $2.02B | $3.26B | $-357M | $-3.30B | $6.96B | $-2.11B | $-1.27B | $2.08B | $10.35B |
Rentowność
| Wskaźnik | Trend | Q4 2025 | Q3 2025 | Q2 2025 | Q1 2025 | Q4 2024 | Q3 2024 | Q2 2024 | Q1 2024 | Q4 2023 | Q3 2023 | Q2 2023 | Q1 2023 | Q4 2022 | Q3 2022 | Q2 2022 | Q1 2022 |
|---|---|---|---|---|---|---|---|---|---|---|---|---|---|---|---|---|---|
| Net Margin | · | 17.7% | 9.2% | 8.0% | · | 10.4% | 14.2% | 20.3% | · | 26.3% | 5.5% | 29.0% | · | -29.4% | -90.3% | -99.4% | |
| Pretax Margin | · | 29.5% | 12.4% | 21.3% | · | 26.8% | 23.9% | 31.1% | · | 34.0% | 6.9% | 33.8% | · | -45.6% | -153.6% | -244.3% | |
| EBITDA Margin | · | · | · | 5.5% | · | · | · | 3.4% | · | · | · | 3.1% | · | · | · | 15.2% | |
| ROA | · | 0.42% | 0.16% | 0.12% | · | 0.25% | 0.27% | 0.48% | · | 0.26% | 0.28% | · | · | -0.70% | -1.7% | -0.67% | |
| ROE | · | 8.5% | 3.6% | 2.7% | · | 6.2% | 7.3% | 11.1% | · | 19.2% | 12.6% | · | · | 130.8% | -111.5% | -15.8% |
Efektywność
| Wskaźnik | Trend | Q4 2025 | Q3 2025 | Q2 2025 | Q1 2025 | Q4 2024 | Q3 2024 | Q2 2024 | Q1 2024 | Q4 2023 | Q3 2023 | Q2 2023 | Q1 2023 | Q4 2022 | Q3 2022 | Q2 2022 | Q1 2022 |
|---|---|---|---|---|---|---|---|---|---|---|---|---|---|---|---|---|---|
| Asset Turnover | · | 0.0 | 0.0 | 0.0 | · | 0.0 | 0.0 | 0.0 | · | 0.0 | 0.1 | · | · | 0.0 | 0.0 | 0.0 |
Na akcję
| Wskaźnik | Trend | Q4 2025 | Q3 2025 | Q2 2025 | Q1 2025 | Q4 2024 | Q3 2024 | Q2 2024 | Q1 2024 | Q4 2023 | Q3 2023 | Q2 2023 | Q1 2023 | Q4 2022 | Q3 2022 | Q2 2022 | Q1 2022 |
|---|---|---|---|---|---|---|---|---|---|---|---|---|---|---|---|---|---|
| Book Value / Share | · | $39.86 | $33.78 | $31.51 | · | $31.57 | $26.82 | $25.99 | · | $14.87 | $14.52 | · | · | $-2.34 | $6.44 | $19.27 | |
| Revenue / Share | · | $16.16 | $11.54 | $9.36 | · | $13.21 | $10.20 | $11.63 | · | $4.48 | $23.66 | $9.07 | · | $5.10 | $3.89 | $1.49 | |
| Cash Flow / Share | · | · | · | $1.71 | · | · | · | $0.12 | · | · | · | $1.83 | · | · | · | $-6.81 | |
| Cash / Share | · | · | · | · | · | · | · | · | · | · | $21.29 | · | · | $19.11 | $22.27 | $17.13 | |
| Dividend / Share | $0.51 | $0.51 | $0.51 | $0.46 | $0.46 | $0.46 | $0.46 | $0.43 | $0.43 | $0.43 | $0.43 | $0.40 | $0.40 | $0.40 | $0.40 | $0.40 | |
| EPS (TTM) | · | · | · | · | · | $9.44 | $9.25 | $8.90 | · | $4.83 | $2.75 | $-1.07 | · | $-3.70 | $-1.71 | $3.81 |
Wycena (TTM)
| Wskaźnik | Trend | Q4 2025 | Q3 2025 | Q2 2025 | Q1 2025 | Q4 2024 | Q3 2024 | Q2 2024 | Q1 2024 | Q4 2023 | Q3 2023 | Q2 2023 | Q1 2023 | Q4 2022 | Q3 2022 | Q2 2022 | Q1 2022 |
|---|---|---|---|---|---|---|---|---|---|---|---|---|---|---|---|---|---|
| Revenue TTM | · | · | · | · | · | $31.88B | $26.70B | $34.38B | · | $26.44B | $26.82B | $15.41B | · | $7.32B | $5.42B | $4.52B | |
| Net Income TTM | · | · | · | · | · | $5.85B | $5.72B | $5.46B | · | $4.56B | $3.31B | $1.08B | · | $-2.36B | $-1.54B | $759M | |
| Market Cap | · | $77.35B | $81.15B | $78.11B | · | $70.68B | $67.25B | $63.98B | · | $50.94B | $43.54B | · | · | $26.63B | $27.68B | $35.36B | |
| P/E | · | · | · | · | · | 13.2 | 12.8 | 12.6 | · | 18.6 | 27.9 | -59.0 | · | -12.6 | -28.4 | 16.3 | |
| P/S | · | · | · | · | · | 2.2 | 2.5 | 1.9 | · | 1.9 | 1.6 | · | · | 3.6 | 5.1 | 7.8 | |
| P/B | · | 3.3 | 4.2 | 4.3 | · | 4.0 | 4.4 | 4.3 | · | 6.0 | 5.3 | · | · | -19.9 | 7.5 | 3.2 | |
| P / Tangible Book | · | 3.3 | 4.2 | 4.3 | · | 4.0 | 4.4 | 4.3 | · | 6.0 | 5.3 | · | · | · | · | 5.3 | |
| P / Cash Flow | · | · | · | 77.2 | · | · | · | 914.1 | · | · | · | · | · | · | · | -8.9 | |
| Dividend Yield | · | · | · | · | · | 1.5% | 1.6% | 1.6% | · | 1.9% | 2.3% | · | · | 3.2% | 2.6% | 1.7% | |
| Earnings Yield | · | · | · | · | · | 7.6% | 7.8% | 7.9% | · | 5.4% | 3.6% | -1.7% | · | -8.0% | -3.5% | 6.2% | |
| Payout Ratio | · | · | · | 62.9% | · | · | · | 18.1% | · | · | · | 15.7% | · | · | · | -26.3% | |
| Annual Payout | · | · | · | · | · | $1.07B | $1.05B | $1.03B | · | $993M | $1.00B | $974M | · | $849M | $711M | $602M |
Najnowszy okres po lewej · wartości null pokazane jako ·
Sprawozdania finansowe Rachunek zysków i strat, bilans, przepływy pieniężne — roczne, ostatnie 5 lat
| Wskaźnik | 2025-12-31 | 2024-12-31 | 2023-12-31 | 2023-03-31 | 2022-12-31 |
|---|---|---|---|---|---|
| Przychody | $32.05B | $26.11B | $32.64B | · | $10.97B |
| Zysk netto | $3.49B | $4.58B | $5.05B | · | $-1.96B |
| Rozwodniony EPS | $5.54 | $7.33 | $8.28 | · | $-3.43 |
Zbyt mało danych fundamentalnych, aby utworzyć to sprawozdanie.
Zbyt mało danych fundamentalnych, aby utworzyć to sprawozdanie.
Właściciele instytucjonalni (13F) 1 307 emitentów · $55.8B łącznie · Na dzień 30 września 2026
Instytucje, które zgłaszają posiadanie tych akcji w swoich kwartalnych zgłoszeniach SEC Form 13F. Tylko pozycje długie; pojedynczy zgłaszający może pojawić się dwukrotnie dla oddzielnych transz opcji. Duże przeciwstawne pozycje put/call zazwyczaj odzwierciedlają działalność market-makingową lub zabezpieczone zapasy, a nie przekonanie kierunkowe.
| Nowe pozycje | Zamknięte pozycje | Zwiększone | Zmniejszony | Zmiana liczby akcji netto |
|---|---|---|---|---|
| 153 (-12 vs poprzedni kw.) | 94 (-72 vs poprzedni kw.) | 506 (+33 vs poprzedni kw.) | 395 (-38 vs poprzedni kw.) | -9.2M |
Porównano z Q1 2026. Zgłoszenia SEC Form 13F są wymagane w ciągu 45 dni od końca kwartału plus krótki bufor dla spóźnionych zgłoszeń — kwartały mieszczące się jeszcze w tym terminie są pomijane na rzecz ostatniej w pełni zgłoszonej pary.
| Instytucja | Wartość | Akcje | % z śledzonych 13F | Typ |
|---|---|---|---|---|
| VANGUARD GROUP INC | $6 913 825 614 | 47 760 608 | 12,40% | Akcje |
| BlackRock, Inc. | $3 930 785 281 | 33 224 455 | 7,05% | Akcje |
| VANGUARD CAPITAL MANAGEMENT LLC | $3 335 969 915 | 28 196 855 | 5,98% | Akcje |
| FMR LLC | $2 865 539 599 | 24 220 604 | 5,14% | Akcje |
| Capital Research Global Investors | $2 836 137 108 | 23 972 610 | 5,08% | Akcje |
| STATE STREET CORP | $2 351 856 569 | 19 878 764 | 4,22% | Akcje |
| Capital World Investors | $2 162 606 897 | 18 279 251 | 3,88% | Akcje |
| VANGUARD PORTFOLIO MANAGEMENT LLC | $1 720 094 301 | 14 538 875 | 3,08% | Akcje |
| FRANKLIN RESOURCES INC | $1 237 104 898 | 10 456 470 | 2,22% | Akcje |
| GEODE CAPITAL MANAGEMENT, LLC | $1 224 482 429 | 10 396 296 | 2,20% | Akcje |
| National Philanthropic Trust | $1 081 185 281 | 9 138 579 | 1,94% | Akcje |
| MORGAN STANLEY | $1 057 415 385 | 8 937 664 | 1,90% | Akcje |
| NORGES BANK | $866 493 803 | 7 323 927 | 1,55% | Akcje |
| BANK OF AMERICA CORP /DE/ | $817 734 985 | 6 911 799 | 1,47% | Akcje |
| JANE STREET GROUP, LLC | $816 611 113 | 6 902 300 | 1,46% | Opcja kupna |
| UBS Group AG | $706 831 974 | 5 974 406 | 1,27% | Akcje |
| WELLS FARGO & COMPANY/MN | $698 029 000 | 5 900 000 | 1,25% | Opcja sprzedaży |
| Clearbridge Investments, LLC | $609 888 666 | 5 155 005 | 1,09% | Akcje |
| UBS AM, a distinct business unit of UBS ASSET MANAGEMENT AMERICAS LLC | $604 260 075 | 5 423 264 | 1,08% | Akcje |
| NORTHERN TRUST CORP | $576 229 918 | 4 870 509 | 1,03% | Akcje |
| GOLDMAN SACHS GROUP INC | $569 915 555 | 4 817 138 | 1,02% | Akcje |
| JANE STREET GROUP, LLC | $554 306 012 | 4 685 200 | 0,99% | Opcja sprzedaży |
| Mariner, LLC | $538 753 726 | 4 681 672 | 0,97% | Akcje |
| JPMORGAN CHASE & CO | $517 006 778 | 4 502 365 | 0,93% | Akcje |
| Legal & General Group Plc | $459 986 796 | 3 887 979 | 0,82% | Akcje |
| WELLS FARGO & COMPANY/MN | $431 594 880 | 3 648 000 | 0,77% | Opcja kupna |
| CHARLES SCHWAB INVESTMENT MANAGEMENT INC | $426 885 078 | 3 608 191 | 0,77% | Akcje |
| Capital International Investors | $399 561 185 | 3 377 554 | 0,72% | Akcje |
| Boston Partners | $397 475 870 | 3 356 695 | 0,71% | Akcje |
| ROYAL BANK OF CANADA | $370 818 000 | 3 134 284 | 0,66% | Akcje |
| Bank of New York Mellon Corp | $336 643 501 | 2 845 435 | 0,60% | Akcje |
| TIGER GLOBAL MANAGEMENT LLC | $322 171 145 | 2 723 110 | 0,58% | Akcje |
| BECK MACK & OLIVER LLC | $318 703 295 | 2 693 798 | 0,57% | Akcje |
| VANGUARD FIDUCIARY TRUST CO | $300 513 670 | 2 540 053 | 0,54% | Akcje |
| BARCLAYS PLC | $283 707 497 | 2 398 001 | 0,51% | Akcje |
| Invesco Ltd. | $283 480 462 | 2 396 082 | 0,51% | Akcje |
| Curated Wealth Partners LLC | $261 406 323 | 2 209 503 | 0,47% | Akcje |
| DIMENSIONAL FUND ADVISORS LP | $250 229 816 | 2 115 596 | 0,45% | Akcje |
| Temasek Holdings (Private) Ltd | $240 097 722 | 2 029 395 | 0,43% | Akcje |
| NEUBERGER BERMAN GROUP LLC | $232 618 626 | 1 966 436 | 0,42% | Akcje |
| SUSQUEHANNA INTERNATIONAL GROUP, LLP | $231 165 909 | 1 953 900 | 0,41% | Opcja kupna |
| SUSQUEHANNA INTERNATIONAL GROUP, LLP | $222 836 885 | 1 883 500 | 0,40% | Opcja sprzedaży |
| Heard Capital LLC | $199 980 576 | 1 690 310 | 0,36% | Akcje |
| Focus Partners Wealth | $194 709 679 | 1 645 757 | 0,35% | Akcje |
| UBS Group AG | $193 732 625 | 1 637 500 | 0,35% | Opcja sprzedaży |
| WELLS FARGO & COMPANY/MN | $183 408 183 | 1 550 234 | 0,33% | Akcje |
| RAYMOND JAMES FINANCIAL INC | $178 905 097 | 1 512 172 | 0,32% | Akcje |
| DEUTSCHE BANK AG\ | $172 289 765 | 1 456 257 | 0,31% | Akcje |
| Regal Partners Ltd | $166 023 832 | 1 403 295 | 0,30% | Akcje |
| Amundi | $164 978 444 | 1 394 459 | 0,30% | Akcje |
Aktywiści i właściciele 5%+ 10 akcji
Inwestorzy, którzy złożyli SEC Schedule 13D — posiadanie beneficjentów powyżej 5% z zamiarem wpływania na emitenta (udziały aktywistów, kampanie zarządu, M&A). Każdy wiersz pokazuje najnowszy znany stan pozycji tego zgłaszającego.
| Zgłaszający | Złożono | Udział | Status | Cel | Zgłoszenie |
|---|---|---|---|---|---|
| LDB C LLC | 6 lutego 2026 | 0,52% | Pierwotne zgłoszenie | Kampania zarządu | SEC |
| Joshua Harris, MJH Partners II LLC, MJH Partners III LLC ×27 zgłoszenia | 15 grudnia 2025 | 5,90% | Aneks | · | SEC |
| BLACK, LEON D ×3 zgłoszenia | 22 lipca 2025 | 6,80% | Aneks | · | SEC |
| ROWAN MARC J, MJR Foundation LLC, MJR-VPF LLC, MJR 09FT-VPF LLC, RWN Management, LLC, RWNM-VPF LLC, Alchemy Group Holdings LLC, MJR-09FT-2A, MJR-09 2023 Family Trust | 16 kwietnia 2025 | 6,00% | Aneks | · | SEC |
| LDB 2014 LLC ×3 zgłoszenia | 23 stycznia 2025 | 1,20% | Aneks | · | SEC |
| Marc Rowan (2), MJR Foundation LLC (2), MJR-VPF LLC (2), MJR 09FT-VPF LLC (2), RWN Management, LLC (2), RWNM-VPF LLC (2), Alchemy Group Holdings LLC (2), MJR-09FT-2A LLC (2), MJR-09 2023 Family Trust (2), RWNM AOG Holdings LLC (2), RWNM Series A Holdings LLC (2) ×2 zgłoszenia | 11 grudnia 2024 | · | Pierwotne zgłoszenie | · | SEC |
| LDB 2018 GST TRUST | 8 listopada 2024 | · | Pierwotne zgłoszenie | Kampania zarządu | SEC |
| Leon D. Black ×6 zgłoszenia | 28 października 2024 | · | Pierwotne zgłoszenie | · | SEC |
| Socrates Trust ×2 zgłoszenia | 20 lutego 2024 | · | Pierwotne zgłoszenie | · | SEC |
| Heritage Trust u/a/d 11/12/2018 ×3 zgłoszenia | 27 maja 2022 | · | Pierwotne zgłoszenie | · | SEC |
Purpose is an automated classification of the filer's own stated purpose (SEC Item 4) — not investment advice. "—" means no clear purpose was stated or the text could not be classified.
Insiderzy spółki 30 insiderów · 10 dyrektorzy generalni · 17 dyrektorzy
| Insider | Rola | Ostatnia aktywność | Posiadane akcje | Kupna 12m | Sprzedaże 12m | Netto 12m |
|---|---|---|---|---|---|---|
| ROWAN MARC J | Chief Executive Officer and | 8 maja 2026 G | 1 552 160 | 0 | 0 | $0 |
| Grant Kvalheim | CEO of Athene Holding Ltd. | 17 lutego 2026 F | 2 171 518 | 0 | 0 | $0 |
| Martin Kelly | Chief Financial Officer | 14 sierpnia 2026 S | 396 533 | 0 | 3 | $-2 153 460 |
| John P. Zito | Co-President of Apollo Asset Management, Inc. | 27 maja 2026 S | 3 063 696 | 0 | 3 | $-6 355 735 |
| Scott Kleinman | Co-President of Apollo Asset Management, Inc. The reporting person disclaims beneficial ownership of securities held indirectly | 27 maja 2026 G | 226 873 | 0 | 0 | $0 |
| Whitney Chatterjee | Chief Legal Officer | 18 lutego 2026 F | 136 490 | 0 | 1 | $-1 241 255 |
| James Richard Belardi | Executive Chairman of Athene Holding Ltd. The reporting person disclaims beneficial ownership of securities held indirectly exce | 13 lutego 2026 M | 99 393 | 0 | 0 | $0 |
| Kristiane Elaine Kinahan | Chief Acct. Off. | 11 lutego 2026 F | 17 374 | 0 | 0 | $0 |
| Louis-Jacques Tanguy | Chief Acct. Off. & Controller | 12 lutego 2025 F | 27 055 | 0 | 0 | $0 |
| John J Suydam | Chief Legal Officer | 15 listopada 2023 A | 14 152 | 0 | 0 | $0 |
| Mitra O'Neill | Dyrektor | 7 maja 2026 A | 32 115 | 0 | 0 | $0 |
| Brian Leach | Dyrektor | 7 maja 2026 A | 41 916 | 0 | 0 | $0 |
| Kerry Murphy Healey | Dyrektor | 1 lipca 2025 A | 20 705 | 0 | 0 | $0 |
| Pamela J Joyner | Dyrektor | 1 lipca 2025 A | 14 935 | 0 | 0 | $0 |
| Marc A Beilinson | Dyrektor | 1 lipca 2025 A | 113 707 | 0 | 0 | $0 |
| Lynn C Swann | Dyrektor | 1 lipca 2025 A | 18 462 | 0 | 0 | $0 |
| Pauline Richards | Dyrektor | 1 lipca 2025 A | 87 850 | 0 | 0 | $0 |
| SIMON DAVID | Dyrektor | 1 lipca 2025 A | 13 263 | 0 | 0 | $0 |
| A B Krongard | Dyrektor | 5 maja 2025 A | 80 669 | 0 | 0 | $0 |
| Walter Joseph Clayton III | Dyrektor | 1 lipca 2024 A | 31 860 | 0 | 0 | $0 |
| Michael E Ducey | Dyrektor | 1 lipca 2024 A | 67 711 | 0 | 0 | $0 |
| Patrick Toomey | Dyrektor | 10 maja 2023 A | 9 791 | 0 | 0 | $0 |
| Joshua Harris | Dyrektor | 10 stycznia 2022 J | 1 350 007 | 0 | 0 | $0 |
| Richard P Emerson | Dyrektor | 1 stycznia 2022 A | 10 538 | 0 | 0 | $0 |
| Gary D Cohn | · | 7 maja 2026 A | 5 153 | 0 | 0 | $0 |
| Jessica M Bibliowicz | · | 7 maja 2026 A | 16 046 | 0 | 0 | $0 |
| James C Zelter | · | 18 lutego 2026 F | 5 017 139 | 0 | 0 | $0 |
| Heritage Trust u/a/d 11/12/2018 | · | 1 grudnia 2025 J | 29 629 251 | 0 | 0 | $0 |
| BLACK, LEON D | · | 22 października 2025 G | 26 466 101 | 0 | 0 | $0 |
| LB 2018 GST Trust | · | 4 kwietnia 2025 P | 621 754 | 0 | 0 | $0 |
Insiderzy z zgłoszeń SEC Form 3/4/5; netto = tylko otwarty rynek P/S
Posiadanie ETF-ów Posiadane przez 121 funduszy ETF
Waga odzwierciedla wyłącznie bezpośrednie udziały kapitałowe (N-PORT); fundusze oparte na dźwigni lub instrumentach pochodnych mogą posiadać dodatkowe ekspozycje na swapy, które nie są pokazane.
| Fundusz | Waga | Jednostki | Na dzień | Źródło |
|---|---|---|---|---|
| LBO · EA Series Trust | 9,73% | 5 466 NS | 31 lipca 2026 | N-PORT |
| RSPF · Invesco Exchange-Traded Fund Trust | 1,22% | 39 815 SH | 5 października 2026 | Dziennie |
| TGLB · T. Rowe Price Exchange-Traded Funds… | 1,03% | 2 143 NS | 31 lipca 2026 | N-PORT |
| PFFA · ETFis Series Trust I | 0,95% | 185,920,49 NS | 31 lipca 2026 | N-PORT |
| FFLV · FIDELITY COVINGTON TRUST | 0,91% | 1 197 NS | 31 lipca 2026 | N-PORT |
| IYF · iShares Trust | 0,82% | 279 864 SH | 11 września 2026 | Dziennie |
| IYG · iShares Trust | 0,81% | 139 880 SH | 11 września 2026 | Dziennie |
| ALTL · Pacer Funds Trust | 0,77% | 5 629 NS | 31 lipca 2026 | N-PORT |
| FFLC · FIDELITY COVINGTON TRUST | 0,73% | 70 101 NS | 31 lipca 2026 | N-PORT |
| IIGD · Invesco Exchange-Traded Self-Indexe… | 0,64% | 170 000 | 5 października 2026 | Dziennie |
| PGX · Invesco Exchange-Traded Fund Trust … | 0,63% | 898 791 | 5 października 2026 | Dziennie |
| FNCL · FIDELITY COVINGTON TRUST | 0,58% | 110 183 NS | 31 lipca 2026 | N-PORT |
| VFH · VANGUARD WORLD FUND | 0,58% | 681 927 SH | 19 sierpnia 2026 | Dziennie |
| HIBL · Direxion Shares ETF Trust | 0,52% | 3 110 NS | 31 lipca 2026 | N-PORT |
| VOT · VANGUARD INDEX FUNDS | 0,52% | 1 545 816 SH | 19 sierpnia 2026 | Dziennie |
| IMCG · iShares Trust | 0,50% | 156 216 SH | 11 września 2026 | Dziennie |
| FAS · Direxion Shares ETF Trust | 0,49% | 90 877 NS | 31 lipca 2026 | N-PORT |
| FTC · First Trust Exchange-Traded AlphaDE… | 0,41% | 43 450 NS | 31 lipca 2026 | N-PORT |
| LQAI · Exchange Listed Funds Trust | 0,38% | 68 NS | 31 lipca 2026 | N-PORT |
| IMCB · iShares Trust | 0,38% | 50 286 SH | 11 września 2026 | Dziennie |
| VRP · Invesco Exchange-Traded Fund Trust … | 0,37% | 5 496 099 | 5 października 2026 | Dziennie |
| IXG · iShares Trust | 0,37% | 19 931 SH | 11 września 2026 | Dziennie |
| XOEF · iShares Trust | 0,33% | 582 SH | 11 września 2026 | Dziennie |
| PFF · iShares Trust | 0,29% | 1 470 281 SH | 11 września 2026 | Dziennie |
| PFIG · Invesco Exchange-Traded Fund Trust … | 0,29% | 355 000 | 5 października 2026 | Dziennie |
| VFVA · VANGUARD WELLINGTON FUND | 0,27% | 19 692 SH | 19 sierpnia 2026 | Dziennie |
| IMCV · iShares Trust | 0,26% | 23 803 SH | 11 września 2026 | Dziennie |
| ESG · FlexShares Trust | 0,24% | 2 520 NS | 31 lipca 2026 | N-PORT |
| VO · VANGUARD INDEX FUNDS | 0,23% | 4 372 825 SH | 19 sierpnia 2026 | Dziennie |
| NUDV · Nushares ETF Trust | 0,23% | 899 NS | 31 lipca 2026 | N-PORT |
| USXF · iShares Trust | 0,22% | 24 890 SH | 11 września 2026 | Dziennie |
| VYM · VANGUARD WHITEHALL FUNDS | 0,21% | 1 674 531 SH | 19 sierpnia 2026 | Dziennie |
| FAD · First Trust Exchange-Traded AlphaDE… | 0,21% | 9 443 NS | 31 lipca 2026 | N-PORT |
| ESGG · FlexShares Trust | 0,21% | 1 805 NS | 31 lipca 2026 | N-PORT |
| IWX · iShares Trust | 0,20% | 60 537 SH | 11 września 2026 | Dziennie |
| HELO · J.P. Morgan Exchange-Traded Fund Tr… | 0,20% | 72 047 NS | 31 lipca 2026 | N-PORT |
| EUSA · iShares, Inc. | 0,19% | 29 201 SH | 11 września 2026 | Dziennie |
| MPLY · Strategy Shares | 0,18% | 230 NS | 31 lipca 2026 | N-PORT |
| SIZE · iShares Trust | 0,18% | 5 971 SH | 11 września 2026 | Dziennie |
| RSP · Invesco Exchange-Traded Fund Trust | 0,18% | 1 486 132 SH | 5 października 2026 | Dziennie |
| DFSU · Dimensional ETF Trust | 0,17% | 30 603 NS | 31 lipca 2026 | N-PORT |
| IQSU · New York Life Investments ETF Trust | 0,16% | 4 285 NS | 31 lipca 2026 | N-PORT |
| RWL · Invesco Exchange-Traded Fund Trust … | 0,16% | 137 208 SH | 5 października 2026 | Dziennie |
| SUSL · iShares Trust | 0,16% | 14 751 SH | 11 września 2026 | Dziennie |
| IWD · iShares Trust | 0,14% | 933 645 SH | 11 września 2026 | Dziennie |
| VONV · VANGUARD SCOTTSDALE FUNDS | 0,14% | 253 460 SH | 19 sierpnia 2026 | Dziennie |
| EGLE · Global X Funds | 0,13% | 23 NS | 31 lipca 2026 | N-PORT |
| DFAU · Dimensional ETF Trust | 0,13% | 127 901 NS | 31 lipca 2026 | N-PORT |
| GLBL · Pacer Funds Trust | 0,12% | 11 NS | 31 lipca 2026 | N-PORT |
| DXUV · Dimensional ETF Trust | 0,12% | 5 331 NS | 31 lipca 2026 | N-PORT |
| DCOR · Dimensional ETF Trust | 0,12% | 31 649 NS | 31 lipca 2026 | N-PORT |
| ILCG · iShares Trust | 0,11% | 27 417 SH | 11 września 2026 | Dziennie |
| MGV · VANGUARD WORLD FUND | 0,11% | 126 827 SH | 19 sierpnia 2026 | Dziennie |
| TOPC · iShares Trust | 0,11% | 280 SH | 11 września 2026 | Dziennie |
| CATH · Global X Funds | 0,10% | 10 610 NS | 31 lipca 2026 | N-PORT |
| XVV · iShares Trust | 0,10% | 5 337 SH | 11 września 2026 | Dziennie |
| VOXP · Advisors Series Trust | 0,10% | 45 NS | 31 lipca 2026 | N-PORT |
| DFAC · Dimensional ETF Trust | 0,10% | 370 534 NS | 31 lipca 2026 | N-PORT |
| FEX · First Trust Exchange-Traded AlphaDE… | 0,10% | 11 909 NS | 31 lipca 2026 | N-PORT |
| IWL · iShares Trust | 0,09% | 16 268 SH | 11 września 2026 | Dziennie |
| CHRI · Global X Funds | 0,09% | 60 NS | 31 lipca 2026 | N-PORT |
| XYLG · Global X Funds | 0,09% | 479 NS | 31 lipca 2026 | N-PORT |
| GTO · Invesco Actively Managed Exchange-T… | 0,09% | 111 250 | 5 października 2026 | Dziennie |
| IVE · iShares Trust | 0,09% | 359 683 SH | 11 września 2026 | Dziennie |
| XTR · Global X Funds | 0,09% | 35 NS | 31 lipca 2026 | N-PORT |
| QVML · Invesco Exchange-Traded Fund Trust … | 0,09% | 13 431 SH | 5 października 2026 | Dziennie |
| PTLC · Pacer Funds Trust | 0,09% | 23 513 NS | 31 lipca 2026 | N-PORT |
| IVV · iShares Trust | 0,09% | 5 813 398 SH | 11 września 2026 | Dziennie |
| VTV · VANGUARD INDEX FUNDS | 0,09% | 1 923 624 SH | 19 sierpnia 2026 | Dziennie |
| VOOV · VANGUARD ADMIRAL FUNDS | 0,09% | 49 857 SH | 19 sierpnia 2026 | Dziennie |
| ESGV · VANGUARD WORLD FUND | 0,09% | 94 926 SH | 19 sierpnia 2026 | Dziennie |
| XYLD · Global X Funds | 0,09% | 23 167 NS | 31 lipca 2026 | N-PORT |
| XRMI · Global X Funds | 0,09% | 357 NS | 31 lipca 2026 | N-PORT |
| DFVX · Dimensional ETF Trust | 0,09% | 3 745 NS | 31 lipca 2026 | N-PORT |
| IUSV · iShares Trust | 0,09% | 191 072 SH | 11 września 2026 | Dziennie |
| XCLR · Global X Funds | 0,09% | 25 NS | 31 lipca 2026 | N-PORT |
| IVW · iShares Trust | 0,09% | 521 309 SH | 11 września 2026 | Dziennie |
| IYY · iShares Trust | 0,08% | 19 853 SH | 11 września 2026 | Dziennie |
| BKLC · BNY Mellon ETF Trust | 0,08% | 36 631 NS | 31 lipca 2026 | N-PORT |
| IUSG · iShares Trust | 0,08% | 215 256 SH | 11 września 2026 | Dziennie |
| BBUS · J.P. Morgan Exchange-Traded Fund Tr… | 0,08% | 59 104 NS | 31 lipca 2026 | N-PORT |
| VOTE · TCW ETF Trust | 0,08% | 7 247 NS | 31 lipca 2026 | N-PORT |
| SPUU · Direxion Shares ETF Trust | 0,08% | 1 740 NS | 31 lipca 2026 | N-PORT |
| ILCB · iShares Trust | 0,08% | 8 301 SH | 11 września 2026 | Dziennie |
| PBP · Invesco Exchange-Traded Fund Trust | 0,08% | 2 809 SH | 5 października 2026 | Dziennie |
| QDPL · Pacer Funds Trust | 0,08% | 11 085 NS | 31 lipca 2026 | N-PORT |
| ITOT · iShares Trust | 0,08% | 599 842 SH | 11 września 2026 | Dziennie |
| VOO · VANGUARD INDEX FUNDS | 0,08% | 11 980 464 SH | 19 sierpnia 2026 | Dziennie |
| VUG · VANGUARD INDEX FUNDS | 0,08% | 2 575 342 SH | 19 sierpnia 2026 | Dziennie |
| VV · VANGUARD INDEX FUNDS | 0,08% | 471 320 SH | 19 sierpnia 2026 | Dziennie |
| VOOG · VANGUARD ADMIRAL FUNDS | 0,08% | 181 810 SH | 19 sierpnia 2026 | Dziennie |
| TOV · EA Series Trust | 0,08% | 1 684 NS | 31 lipca 2026 | N-PORT |
| DFUS · Dimensional ETF Trust | 0,08% | 128 406 NS | 31 lipca 2026 | N-PORT |
| IWB · iShares Trust | 0,08% | 292 072 SH | 11 września 2026 | Dziennie |
| USCL · iShares Trust | 0,08% | 16 724 SH | 11 września 2026 | Dziennie |
| IWV · iShares Trust | 0,07% | 115 954 SH | 11 września 2026 | Dziennie |
| TILT · FlexShares Trust | 0,07% | 12 482 NS | 31 lipca 2026 | N-PORT |
| PBUS · Invesco Exchange-Traded Fund Trust … | 0,07% | 67 421 SH | 5 października 2026 | Dziennie |
| HCMT · Direxion Shares ETF Trust | 0,07% | 3 207 NS | 31 lipca 2026 | N-PORT |
| VTI · VANGUARD INDEX FUNDS | 0,07% | 12 815 117 SH | 19 sierpnia 2026 | Dziennie |
| VONE · VANGUARD SCOTTSDALE FUNDS | 0,07% | 69 233 SH | 19 sierpnia 2026 | Dziennie |
| VTHR · VANGUARD SCOTTSDALE FUNDS | 0,07% | 35 330 SH | 19 sierpnia 2026 | Dziennie |
| SPXL · Direxion Shares ETF Trust | 0,07% | 36 058 NS | 31 lipca 2026 | N-PORT |
| PHDG · Invesco Actively Managed Exchange-T… | 0,07% | 367 SH | 5 października 2026 | Dziennie |
| TOK · iShares Trust | 0,06% | 1 200 SH | 11 września 2026 | Dziennie |
| URTH · iShares, Inc. | 0,06% | 37 671 SH | 11 września 2026 | Dziennie |
| EQAL · Invesco Exchange-Traded Fund Trust … | 0,06% | 4 120 SH | 5 października 2026 | Dziennie |
| ILCV · iShares Trust | 0,05% | 5 739 SH | 11 września 2026 | Dziennie |
| ACWI · iShares Trust | 0,05% | 135 787 SH | 11 września 2026 | Dziennie |
| MGC · VANGUARD WORLD FUND | 0,05% | 40 509 SH | 19 sierpnia 2026 | Dziennie |
| CRBN · iShares Trust | 0,05% | 4 380 SH | 11 września 2026 | Dziennie |
| PRF · Invesco Exchange-Traded Fund Trust | 0,04% | 36 657 SH | 5 października 2026 | Dziennie |
| VT · VANGUARD INTERNATIONAL EQUITY INDEX… | 0,04% | 349 899 SH | 19 sierpnia 2026 | Dziennie |
| GTOS · Invesco Actively Managed Exchange-T… | 0,02% | 1 100 | 5 października 2026 | Dziennie |
| DFLV · Dimensional ETF Trust | 0,01% | 3 584 NS | 31 lipca 2026 | N-PORT |
| CBLS · Elevation Series Trust | -1,10% | -4 860 NS | 31 lipca 2026 | N-PORT |
| BIV · VANGUARD BOND INDEX FUNDS | · | · | 15 lipca 2026 | Dziennie |
| BND · VANGUARD BOND INDEX FUNDS | · | · | 15 lipca 2026 | Dziennie |
| VGMS · VANGUARD MALVERN FUNDS | · | · | 15 lipca 2026 | Dziennie |
| VCIT · VANGUARD SCOTTSDALE FUNDS | · | · | 15 lipca 2026 | Dziennie |
| BNDW · VANGUARD SCOTTSDALE FUNDS | · | · | 30 lipca 2026 | Dziennie |
APO Konsensus analityków Bycze i niedźwiedzie opinie analityków, 12-miesięczny cel cenowy, potencjał wzrostu
12-miesięczny cel cenowy
20 analityków · 2026-10-07Średnia cel $151.45 +30,6%
Porównanie z porównywalnymi firmami (podbranża GICS) Kluczowe metryki w porównaniu do konkurentów z sektora
Podstawa R/R, ceny według zamknięcia z ostatniego końca roku obrotowego każdej spółki.
| Ticker | Kapitalizacja Rynkowa | P/E | Przychody r/r | Marża Netto | ROE | Marża brutto |
|---|---|---|---|---|---|---|
| APO | $83.81B | 26.1 | 22.7% | 10.9% | 17.2% | · |
| CRBG | · | -44.4 | -1.2% | · | · | · |
| EQH | · | -9.9 | -6.1% | · | · | · |
| JXN | $7.13B | -444.4 | 104.3% | 0.40% | 0.27% | · |
| VOYA | $6.99B | 11.8 | 1.7% | 8.0% | 14.6% | · |
| ALRS | $572M | 33.1 | 1.1% | 7.8% | 3.3% | · |
| SOR | · | · | · | · | · | · |
| NEWT | · | · | · | · | · | · |
Najnowsze wiadomości Najnowsze nagłówki wspominające o tej firmie
Moje wskaźniki Twoja osobista lista obserwowanych — wybrane wiersze z Pełnych Fundamentów
Wybierz wskaźniki, które są dla Ciebie ważne — kliknij + obok dowolnego wiersza w sekcji Pełne dane fundamentalne powyżej.
Twój wybór został zapisany i będzie Ci towarzyszył we wszystkich tickerach.