
USB U.S. Bancorp Common Stock
NYSE · Banking · Wyświetl na SEC EDGAR ↗ zamknij Paź 2, 2026 10-K/10-Q Sie 6, 2026USB Migawka akcji Cena, kapitalizacja rynkowa, P/E, EPS, ROE, zadłużenie/kapitał własny, zakres 52-tygodniowy
USB Wykres ceny akcji Dzienny OHLCV ze wskaźnikami technicznymi — przesuwaj, powiększaj i dostosowuj widok
Granularność słupków dostosowuje się do wybranego okresu — najedź kursorem na wykres, aby zobaczyć otwarcia/maksima/minima/zamknięcia dla danego słupka.
| Data ex-dywidendy | Podział | Typ |
|---|---|---|
| 16 kwietnia 1999 | 3-for-1 | Naprzód |
| 16 stycznia 1997 | 3-for-1 | Naprzód |
| 17 kwietnia 1989 | 2-for-1 | Naprzód |
| 16 kwietnia 1985 | 2-for-1 | Naprzód |
| 22 lutego 1979 | 5-for-4 | Naprzód |
O U.S. Bancorp Common Stock Przegląd firmy z Wikipedii
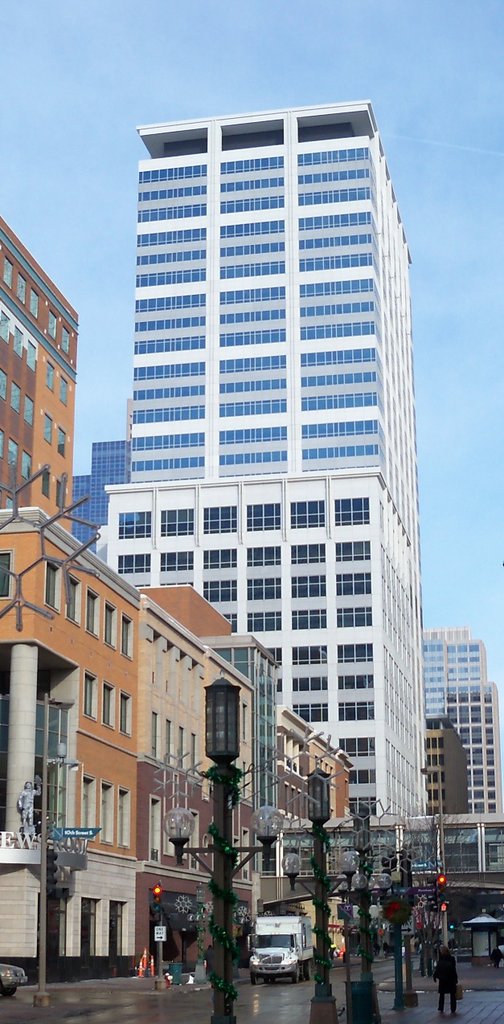
U.S. Bancorp (stylized as us bancorp) is an American multinational banking institution headquartered in Minneapolis, Minnesota, and incorporated in Delaware. It is the 7th-largest bank in the United States as of March 2026. As the largest bank in the Midwestern United States, it is considered a domestic systemically important bank (D-SIB) by the Federal Reserve. It is the parent company of its primary operating entity, U.S. Bank National Association, which does business as U.S. Bank (stylized as us bank). The company provides banking, investment, mortgage, trust, and payment services products to individuals, businesses, governmental entities, and other financial institutions.
The firm's early history can be traced to 1891, operating under the second-oldest banking charter granted in 1863 following the passage of the National Bank Act. Since inception, dozens of regional mergers and acquisitions throughout the Upper Midwest and Western United States led to the creation of modern U.S. Bancorp. As a diversified holding company, U.S. Bancorp has acquired multiple subsidiaries since the late 2010s. Its retail credit card offerings are provided via the Visa network in the U.S. and abroad.
U.S. Bancorp's annual revenue levels have it ranked on the Fortune 500, with its public stock trading within both the S&P 500 and S&P 100 indexes. It was included in the 2024 Forbes Global 2000 for its sales, profitability, asset base, and market value, among other financial institutions. U.S. Bancorp sponsors a variety of cultural events, transportation hubs, and sporting venues, including U.S. Bank Stadium. U.S. Bank is one of the largest asset custodians in the country with more than $11.7 trillion under administration as of June 2025.
History
The U.S. Bank name first appeared as United States National Bank of Portland, established in Portland, Oregon, in 1891. In 1902, it merged with Ainsworth National Bank of Portland, but kept the U.S. National Bank name. It changed its name to the United States National Bank of Oregon in 1964.
The central part of the franchise dates from 1864, with the formation of First National Bank of Minneapolis. In 1929, that bank merged with First National Bank of St. Paul (also formed in 1864) and several smaller Upper Midwest banks to form the First Bank Stock Corporation, which changed its name to First Bank System in 1968.
In the eastern part of the franchise, Farmers and Millers Bank in Milwaukee opened its doors in 1853, growing into the First National Bank of Milwaukee and eventually becoming First Wisconsin and ultimately Firstar Corporation. In Cincinnati, First National Bank of Cincinnati opened for business on July 13, 1863, under National Charter #24—the charter that U.S. Bancorp still operates under today, and one of the oldest active national bank charters in the nation. U.S. Bancorp claims 1863 as its founding date. Despite having started up in the midst of the Civil War, First National Bank of Cincinnati went on to survive many decades to grow into Star Bank.
U.S. Bancorp of Oregon era
In January 1969, the U.S. National Bank of Oregon reorganized as a holding company, U.S. Bancorp, after receiving authorization from its bank directors on September 9, 1968 and subsequently receiving legal approval to proceed from the Comptroller of the Currency on November 28, 1968. LeRoy B. Staver, president, and chief executive officer of the bank, was appointed chairman and chief executive officer for the new holding company while Robert B. Wilson was appointed president of the holding company and also executive vice president for the bank. Wilson later resigned as president in December 1972 and his position was filled eight months later by John A. Elorriaga.
Staver retired in October 1974 and was succeeded by John Elorriaga who was promoted to chairman and chief executive officer while Carl W. Mays Jr was named president in Elorriaga's place.
A major change in the organization of leadership in the U.S. Bancorp of Oregon occurred in August 1983. Although Elorriaga remained as chairman and chief executive officer for the firm, Mays was appointed to the new position of executive assistant to the chairman while Edmund P. Jensen was appointed president as a replacement to Mays, and Roger L. Breezley was appointed to the new post of chief operating officer.
In December 1986, U.S. Bancorp of Oregon announced the pending acquisition of the Forest Grove, Oregon-based Valley National Corporation (not to be confused with the Phoenix, Arizona, company of the same name) with its five-branch Valley National Bank of Forest Grove subsidiary for $13.7 million (~$33.2 million in 2024) in stock. U.S. Bancorp of Oregon made its first acquisition outside the state of Oregon by announcing in December 1986 the pending acquisition of the Spokane, Washington-based Old National Bancorp with its Old National Bank of Washington and First National Bank of Spokane subsidiaries for $174 million (~$421 million in 2024). The acquisition was completed in July 1987 on the first day that the state of Washington had allowed bank acquisitions by out-of-state companies. In December 1986, U.S. Bancorp of Oregon announced the pending acquisition of the Camas, Washington-based Heritage Bank for $2.8 million (~$6.78 million in 2024).
In May 1987, U.S. Bancorp of Oregon announced the pending acquisition of the Seattle, Washington-based Peoples Bancorp with its Peoples National Bank subsidiary for $275 million (~$649 million in 2024) in stock. The acquisition was completed in December 1987. After the acquisition, Peoples and Old National were combined to form U.S. Bank of Washington. John Elorriaga retired as chairman of the board and chief executive officer in November 1987 and was replaced by Roger L. Breezley while Jensen continued as president. In December 1987, U.S. Bancorp of Oregon announced the pending acquisition of the Bellingham, Washington-based Mt Baker Bank for $25 million (~$59 million in 2024). U.S. Bancorp of Oregon entered the state of California by announcing in April 1988 the pending acquisition of the Eureka, California-based Bank of Loleta with seven branch offices in Humboldt and Del Norte counties for $15.3 million (~$34.9 million in 2024) in cash. The acquisition was completed in December 1988 and was renamed U.S. Bank of California.
In April 1988, U.S. Bancorp of Oregon announced the pending acquisition of the Bellingham, Washington-based Northwestern Commercial Bank for $15.5 million (~$35.4 million in 2024). The acquisition was completed in November 1988. In July 1988, U.S. Bancorp of Oregon announced the pending acquisition of the Auburn, Washington-based Western Independent Bancshares with its Auburn Valley Bank subsidiary for $4.25 million (~$9.7 million in 2024) in cash.
In October 1989, U.S. Bancorp of Oregon announced the pending acquisition of the Sacramento, California-based Mother Lode Savings Bank with three branch offices for $5.3 million (~$11.6 million in 2024). The acquisition was completed in August 1990. This acquisition was one of the first of a thrift by a commercial bank in the nation since legislation permitting such takeovers went into effect.
During the late 1980s, U.S. Bancorp of Oregon made several attempts to enter the state of Idaho by the acquisition of an existing Idaho-based bank, the only method then allowed under Idaho law, but failed when the price got too high. In March 1990, U.S. Bancorp of Oregon announced that they would establish a bank through a loophole in Federal banking law that allows the Office of the Comptroller of the Currency to allow the relocation of bank headquarters within 30 miles of their present location without regards to state boundaries and state regulations. So U.S. Bancorp of Oregon announced that they plan to transfer the existing branches of the First National Bank of Spokane to the U.S. Bancorp of Washington and then ask permission from the Office of the Comptroller of the Currency to move the headquarters of First National from Spokane, Washington, to Coeur d'Alene, Idaho. After receiving Federal approval, First National was finally moved in February 1992 and renamed U.S. Bank of Idaho.
In July 1990, U.S. Bancorp of Oregon announced the pending acquisition of the Auburn, California-based HeartFed Financial Corporation with its Heart Federal Savings and Loan subsidiary for $107.8 million (~$228 million in 2024) in stock. At the time of the announcement, Heart Federal Savings had 29 branch offices in northern California. The acquisition was completed in March 1991 for $118 million (~$242 million in 2024). In November 1991, Edmund P. Jensen was given the post of chief operating officer in addition to his duties as president, making him a possible successor to Breezley.
In February 1992, U.S. Bancorp of Oregon announced the pending acquisition of the 20 branch offices in Northern California and 29 branch offices in Nevada for $70 million (~$140 million in 2024) that were being divested by Bankamerica Corporation as a result of Bank of America's impending acquisition of Security Pacific Corporation. This acquisition gave U.S. Bancorp of Oregon its first presence in the state of Nevada.
Another major change in the organization of leadership in the U.S. Bancorp of Oregon occurred in January 1993. While retaining his position as chief operating officer, Edmund P. Jensen was appointed vice-chairman while giving his position of president to Kevin R. Kelly. At the same time, Gerry B. Cameron was appointed vice-chairman. Ten months later, Jensen resigned to become president of Visa Inc. In January 1994, Gerry Cameron was first appointed chief operating officer as a replacement to Jensen and later appointed chief executive officer just three weeks later. Kelly submitted his resignation as president in March 1994 and Breezley finally gave up the chairmanship to Cameron in April 1994.
In May 1995, U.S. Bancorp of Oregon announced the pending acquisition of the Boise, Idaho-based West One Bancorp for $1.8 billion (~$3.37 billion in 2024). At the time of the announcement, West One had branch offices in Idaho, Oregon, Washington, and Utah while U.S. Bancorp of Oregon had branch offices in Oregon, Washington, California, Idaho, and Nevada. The acquisition was completed in December 1995 and gave U.S. Bancorp of Oregon its first entry into the state of Utah. As part of the acquisition deal, West One's chairman and chief executive Daniel R. Nelson would become the chief operating officer and president of U.S. Bancorp and he would later be Cameron's successor as chairman and CEO upon Cameron's planned retirement in three years. Since both U.S. Bancorp and West One had overlapping territories in Oregon and Washington, the U.S. Justice Department would only allow the acquisition to proceed if U.S. Bancorp would sell off 27 branch offices in Washington and Oregon. As a result of the regulatory ruling, U.S. Bancorp sold 25 branch offices in Oregon, four in central Washington and one in Idaho to First Hawaiian Bank for $38 million in cash.
In February 1996, U.S. Bancorp of Oregon announced the pending acquisition of the San Ramon, California-based California Bancshares for $309 million (~$569 million in 2024) in stock. California Bancshares had a total of 38 branches in the East San Francisco Bay Area in nine separate banks that included Alameda First National, Community First National, Modesto Banking Co., Commercial Bank of Fremont, Lamorinda National Bank, Bank of San Ramon Valley, Westside Bank, Concord Commercial Bank and Bank of Milpitas. The acquisition was completed in June 1996.
In September 1996, U.S. Bancorp of Oregon announced the pending acquisition of the St. George, Utah-based Sun Capital Bancorp with its three-branch office Sun Capital Bank subsidiary for $15.5 million (~$28.5 million in 2024). The acquisition was completed in January 1997. In December 1996, U.S. Bancorp of Oregon announced the pending acquisition of the Sacramento, California-based Business & Professional Bank for $35 million (~$64.4 million in 2024) in cash. The acquisition was completed in May 1997.
First Bank System era
In March 1997, the Minneapolis, Minnesota-based First Bank System announced the pending acquisition of U.S. Bancorp of Oregon for $9 billion (~$16.3 billion in 2024) in stock. At the time of the announcement, U.S. Bancorp of Oregon had banking offices in Oregon, Washington, California, Idaho and Utah while First Bank System had banking offices in Minnesota, Colorado, Nebraska, North Dakota, South Dakota, Montana, Iowa, Illinois, Wisconsin, Kansas, and Wyoming. Under the terms of the acquisition, First Bank System was the nominal survivor, and the newly merged company was headquartered in Minneapolis. However, it took the more recognizable U. S. Bancorp name. John F. Grundhofer, chairman and chief executive of First Bank, was appointed president and chief executive of the new company while Gerry B. Cameron, chairman, and chief executive of U.S. Bancorp of Oregon, was appointed chairman of the new company, which he held until his retirement in 1998. The acquisition was completed in August 1997. Approximately 4000 jobs were eliminated, mostly in Portland.
Brief history of First Bank prior to acquisition
First Bank System can trace its roots to the formation of First National Bank of Minneapolis in 1864. In 1929, the First National Bank of Minneapolis joined with the First National Bank of St. Paul to form a joint holding company for both banks that was called the First Bank Stock Corporation, while keeping both subsidiary banks legally separate. The new holding company quickly grew by acquiring other banks in the four-state region before the Bank Holding Company Act of 1956 prohibited such actions. First Bank Stock Corporation was renamed First Bank System Inc. in 1968.
U.S. Bancorp after takeover by First Bank System
In September 1997, the new U.S. Bancorp (having dropped the "of Oregon" suffix), formerly First Bank System, announced the pending acquisition of the St. Cloud, Minnesota-based Zappco, Inc. with its three banks and six banking locations for an undisclosed amount. At the time of the announcement, U.S. Bancorp had more than 1,000 banking offices in the states of Minnesota, Oregon, Washington, Colorado, California, Idaho, Nebraska, North Dakota, Nevada, South Dakota, Montana, Iowa, Illinois, Utah, Wisconsin, Kansas, and Wyoming. The acquisition was completed in December 1997.
In March 1998, U.S. Bancorp announced the pending acquisition of the Vancouver, Washington-based Northwest Bancshares with its 10-branch offices Northwest National Bank subsidiary for an undisclosed amount. In October 1998, the U.S. Justice Department agreed to allow the acquisition to proceed on the condition that one of the Northwest National Bank branch offices was to be sold. The acquisition was completed in December 1998 after U.S. Bancorp sold the requested banking office to Centennial Bank of Eugene.
At the end of 1998, Gerry Cameron retired as chairman and handed the position over to John Grundhofer who added the title of chairman to his other positions of president and chief executive officer.
In February 1999, U.S. Bancorp announced the pending acquisition of the San Diego-based Bank of Commerce with its 10 branch offices for $314 million (~$554 million in 2024) in stock. The acquisition was finalized in July 1999. In May 1999, U.S. Bancorp announced the pending acquisition of the Newport Beach, California-based Western Bancorp with its Santa Monica Bank and Southern California Bank subsidiaries and a total of 31 branch offices for $904 million (~$1.6 billion in 2024) in stock. At the time of the announcement, U.S. Bancorp had 98 branch offices within California. The acquisition was finalized in November 1999 for $1.04 billion (~$1.84 billion in 2024) in stock.
In July 1999, Philip G. Heasley was appointed president and chief operating officer of U.S. Bancorp. John Grundhofer had handed over the position of president to Heasley while still retaining the titles of chairman and chief executive officer. Heasley had assisted Grundhofer in turning the company around from near insolvency when the company was originally known as First Bank until it became a successful financial institution that became large enough to be absorb other banks, including U.S. Bancorp of Oregon in 1997. Heasley resigned the following year to join Bank One as the head of their First USA credit card unit around the same time Firstar was about to takeover U.S. Bancorp.
In September 1999, U.S. Bancorp announced the pending acquisition of the San Diego-based Peninsula Bank with its 11 branch offices for $104 million (~$184 million in 2024) in stock. In early January 2000, a group of Peninsula Bank stockholders tried to stop the merger because the initial merger agreement was made prior to the huge 27% single-day drop in the value of U.S. Bancorp stock which effectively lowered the purchase price. The acquisition was later completed in January 2000 at a 10% reduction of the original price negotiated.
In June 2000, U.S. Bancorp announced the acquisition of the San Diego-based Scripps Financial Corporation with its nine-branch office Scripps Bank subsidiary for $155 million (~$267 million in 2024) in stock. The acquisition was completed in October 2000.
Firstar era
In October 2000, Firstar Corporation of Milwaukee, Wisconsin, announced the pending acquisition of U.S. Bancorp for $21 billion (~$36.2 billion in 2024) in stock. The merger was completed on February 27, 2001. While Firstar was the nominal survivor, the merged company took the U.S. Bancorp name and moved to old U.S. Bancorp's headquarters in Minneapolis. Under the merger agreement, Jerry Grundhofer, president and chief executive officer of Firstar, would continue in those positions in the combined company while his older brother, John Grundhofer, chairman, president and chief executive officer of U.S. Bancorp, would serve as chairman of the board in the combined company until his planned retirement on December 31, 2002. The merged company retained some administrative functions in Milwaukee and Cincinnati.
To allow the merger to proceed, the U.S. Department of Justice required Firstar to sell 11 branch offices in the Minneapolis-area and 2 in Council Bluffs, Iowa. Bremer Bank of Saint Paul, Minnesota, purchased the 11 Minneapolis-area Firstar offices while Liberty Bank of West Des Moines, Iowa, purchased the 2 Council Bluffs offices.
Brief history of Firstar prior to acquisition
Firstar Corporation traced its roots to the founding of the Farmer's and Millers Bank in Milwaukee in 1853, which by 1919 evolved into First Wisconsin National Bank. However, the Firstar that took over U.S. Bancorp in 2001 was actually the same company and leadership that acquired Firstar 27 months earlier in 1998, namely Star Banc Corporation. That bank, in turn, traced its roots to the founding of First National Bank of Cincinnati in 1863. Jerry Grundhofer and his team from Star Banc were instrumental in both acquisitions.
Present-day U.S. Bancorp retains Star Banc's pre-1998 stock price history. As mentioned above, it claims 1863 as its founding date, and operates under the charter originally granted to First National Bank of Cincinnati. Additionally, all SEC filings before 1998 are under Star Banc, and all filings from 1998 to 2000 are under Firstar.
U.S. Bancorp after takeover by Firstar
In April 2001, the new U.S. Bancorp announced the pending acquisition of all 20 branch offices in California of the Encino-based Pacific Century Bank from its Honolulu-based parent Pacific Century Financial Corporation. The acquisition was completed in September 2001. In July 2002, U.S. Bancorp announced the pending acquisition of all 57 retail banking branches of the San Mateo, California-based Bay View Bank from its Bay View Capital Corporation parent for $429 million (~$713 million in 2024). The acquisition was completed in November 2002. On New Years Day 2003, John Grundhofer retired as chairman of U.S. Bancorp and handed the position to his younger brother Jerry Grundhofer, who added the title of chairman to his other positions of president and chief executive officer in the corporation.
In May 2004, U.S. Bancorp announced that it was acquiring the $34 billion (~$54 billion in 2024) corporate trust bond administration business from National City Corporation. In October 2004, Richard K. Davis was appointed chief operating officer and president of U.S. Bancorp. Jerry Grundhofer had handed over the position of president to Davis while still retaining the titles of chairman and chief executive officer. Davis had been a protege of Grundhofer since their days together at Star Banc Corporation and had assisted in the takeover of Firstar by Star Banc in 1998 and the later acquisition of U.S. Bancorp by Firstar in 2001.
U.S. Bancorp acquired Genpass along with its MoneyPass ATM network subsidiary for an undisclosed amount in May 2005. In November 2005, U.S. Bancorp announced that it was acquiring the $410 billion corporate trust and institutional custody businesses of Wachovia Corporation for $720 million in cash.
In July 2006, U.S. Bancorp announced that it was acquiring the $123 billion (~$184 billion in 2024) municipal and corporate bond trustee business from SunTrust. In June 2006, U.S. Bancorp announced the pending acquisition of the Avon, Colorado-based Vail Banks Inc. with its WestStar Bank subsidiary and 23 locations for $98.6 million (~$147 million in 2024) in cash. The acquisition was completed in September 2006. In November 2006, U.S. Bancorp announced that it was acquiring the $30 billion (~$44.8 billion in 2024) municipal bond trustee business from LaSalle Bank. In November 2006, U.S. Bancorp announced the pending acquisition of the Great Falls, Montana-based United Financial Corporation with its Heritage Bank subsidiary for $71 million (~$106 million in 2024) in stock. The acquisition was completed in February 2007 and nearly double the branch presence of U.S. Bank in Montana. In December 2006, Jerry Grundhofer handed over the position of chief executive officer to president Richard Davis while Grundhofer remained chairman until his retirement the following year in December 2007. After Grundhofer's retirement in December 2007, Davis added the position of chairman to his other titles of president and chief executive officer.
In March 2008, the U.S. Bancorp announced the pending acquisition of the seven-office Los Angeles-based Mellon 1st Business Bank from the Bank of New York Mellon for an undisclosed amount in cash. The acquisition was completed in June 2008.
US Bancorp in the Great Financial Crisis (GFC)
On November 14, 2008, the U.S. Treasury invested $6,599,000,000 (~$9.41 billion in 2024) in preferred stock and warrants in the company via the Emergency Economic Stabilization Act of 2008. Weeks earlier, U.S. Bancorp had entered into acquisition talks with National City Corp. and had made an offer to buy National City until PNC Financial Services used its portion of TARP funds to outbid U.S. Bancorp and acquire National City instead. Had National City accepted U.S. Bancorp's offer, U.S. Bancorp would have expanded into Florida, Michigan and Pennsylvania (three states that as of 2023 still don't have a retail presence from U.S. Bancorp), but major divestments would've been made in Midwestern states, especially Ohio.
On November 21, 2008, the company acquired the failed Downey Savings & Loan Association and also the failed Pomona First Federal Bancorp in a transaction facilitated by the Federal Deposit Insurance Corporation for an undisclosed amount. Downey Savings had 170 branch offices in California and five branch offices in Arizona while PFF Bank had 38 branch offices in Southern California.
In April 2009, U.S. Bancorp acquired the assets and deposits of the failed Ketchum, Idaho-based First Bank of Idaho in a transaction facilitated by the FDIC. First Bank of Idaho had seven offices in Idaho and Wyoming, some of which operated under the name First Bank of the Tetons.
On June 17, 2009, the company redeemed the $6.6 billion of preferred stock and on July 15, 2009, it completed the purchase of a warrant held by the U.S. Treasury Department. This effectively concluded U.S. Bancorp's participation in the Capital Purchase Program. It was the first bank to repay the Troubled Asset Relief Program (TARP) funds.
US Bancorp post-GFC
On October 5, 2009, the company announced its acquisition of the $8 billion (~$11.3 billion in 2024) mutual fund administration and accounting servicing division of Fiduciary Management, Inc. for an undisclosed amount. On October 7, 2009, the company agreed to buy the bond trustee business of First Citizens Bank, a subsidiary of First Citizens BancShares Inc. for an undisclosed amount.
On October 20, 2009, the company completed a transaction to purchase the failed FBOP Corporation's nine subsidiary banks from the FDIC for an undisclosed amount. The banks included BankUSA, National Association with 2 offices in Arizona, Cal National Bank with 68 offices in California, Citizens National Bank with 1 office in Texas, Community Bank of Lemont with 1 office in Illinois, Madisonville State Bank with 1 office in Texas, North Houston Bank with 1 office in Texas, Pacific National Bank with 17 offices in California, Park National Bank with 31 offices in Illinois, and San Diego National Bank with 28 offices in California.
Since the company did not have a previous presence in Texas nor want one in the near future, the company subsequently sold the three banks in Texas in 2010 to Houston-based Prosperity Bancshares for an undisclosed amount. Each of the banks had one office each.
In October 2009, BB&T Corporation (now Truist) announced the pending sale of its Nevada banking operations to U.S. Bancorp for an undisclosed amount. BB&T had just acquired the 21 offices in Nevada through a transaction facilitated by the FDIC for disposal of the assets and deposits of the failed Alabama-based Colonial Bancgroup but BB&T had no desire to expand west of Texas while it wanted to keep the other Colonial former locations in the Southeastern United States. The acquisition was completed in January 2010.
In July 2010, U.S. Bancorp sold its FAF Advisors subsidiary to Nuveen Investments for $80 million (~$112 million in 2024) and a 9.5% stake in Nuveen.
In 2010, Huntington Bancshares announced it would take over the leases of bank branches inside Giant Eagle locations in Ohio, largely replacing U.S. Bancorp but also replacing branches from FirstMerit Corporation (which itself would be acquired by Huntington in 2016) and Citizens Financial Group; the deal didn't affect Citizens branches inside Giant Eagle locations in Pennsylvania. The deal mostly didn't affect U.S. Bancorp, but it did lead to the withdrawal from the Youngstown, Ohio market since U.S. Bancorp's only branches in the area were inside Giant Eagle locations; the branches had been a holdover from the Firstar days. By 2020, U.S. Bancorp had organically become Ohio's largest bank by deposits despite not having a presence in the Youngstown and Toledo markets and ahead of major banks based in Ohio (Huntington, Fifth Third Bank & KeyBank), PNC Bank, and Chase Bank.
In January 2011, U.S. Bancorp acquired the assets and deposits of the failed First Community Bank of New Mexico in a transaction facilitated by the FDIC for an asset discount of approximately $380 million (~$521 million in 2024). The acquisition had included 35 offices in New Mexico and 3 offices in Arizona. In January 2012, the company acquired the assets and deposits of the failed Knoxville, Tennessee-based BankEast in a transaction facilitated by the FDIC for an asset discount of approximately $67.5 million (~$90.9 million in 2024). The acquisition had included 10 offices in the Knoxville area. In March 2013, U.S. Bancorp announced that it was acquiring the $57 billion (~$75.5 billion in 2024) municipal bond trustee business from Deutsche Bank. In January 2014, U.S. Bancorp announced the pending acquisition of 94 branch offices of the Charter One Bank in Chicago from the RBS Citizens Financial Group for $315 million (~$410 million in 2024), doubling its market share in Chicago. 13 Charter One branches were closed due to their close proximity to existing U.S. Bank offices. The acquisition was completed in June 2014. In January 2015, chief financial officer Andrew Cecere was promoted to chief operating officer. A year later, Cecere was given the additional position of president.
In January 2017, U.S. Bancorp announced that chairman and CEO Richard Davis was going to hand over his CEO position to president and COO Andrew Cecere in April 2017 while remaining as chairman. Davis officially retired from the company in April 2018 and Cecere became chairman, president and CEO. In November 2017, the bank performed the United States banking industry's first real-time payment transaction using a system set up by The Clearing House. The transaction moved a nominal amount between accounts at BNY Mellon and U.S. Bancorp in three seconds, inaugurating the first new payment clearance and settlement system for the U.S. in over 40 years.
In February 2018, the bank was charged by the Department of Justice with failing to implement measures preventing illegal activities, including one case of abetting. U.S. Bancorp agreed to pay $613 million in fines and implement measures to improve the monitoring of its customer transactions. In September 2018, $505 million was distributed to customers of an illegal payday loan business, AMG Services, whose suspicious activities US Bancorp had failed to report. In September 2018, Fiserv announced that it would acquire MoneyPass from US Bancorp for $690 million (~$846 million in 2024). The deal was finalized in March 2019. The sale did not include Elan's credit card division, which issued some of the most prominent cards including Fidelity, BMW and Mercedes-Benz.
On September 21, 2021, U.S. Bancorp agreed to purchase MUFG Union Bank's consumer business for $8 billion (~$9.11 billion in 2024). It was the bank's biggest deal since 2001 when it merged with Milwaukee-based Firstar Corp. for $21 billion (~$35.4 billion in 2024). The deal with MUFG Union Bank added $58 billion in loans to U.S. Bancorp's current base of $294 billion and will give U.S. Bancorp a large presence on the U.S. West Coast, especially California. The combined bank was expected to have $723 billion in assets. U.S. regulatory approval for the merger was announced on October 16, 2022, and was completed as of December 1, 2022.
In August 2023, Mitsubishi UFJ Financial Group, former parent company of MUFG Union Bank it sold 8 months earlier to U.S. Bancorp, announced it would be buying a $936 million stake in U.S. Bancorp. The deal swaps debt with equity, strengthening U.S. Bancorp's alliance with Japan's largest bank.
Gunjan Kedia became CEO of U.S. Bancorp in mid-April 2025.
In January 2026, US Bancorp announced a deal to buy BTIG—a financial services firm that specializes in investment banking, sales and trading, research and prime brokerage—for up to $1 billion in cash and stock. The deal involved a $362.5 million cash payment, 6.6 million shares and up to $275 million in cash payable over three years pending the achievement certain performance targets.
Notable Community Work
In May 2020, the U.S. Bancorp Center in downtown Minneapolis was damaged by rioting during the George Floyd protests in Minneapolis–Saint Paul. Two other bank branch locations on East Lake Street in Minneapolis were destroyed by arson. US Bancorp rebuilt the damaged branch location at 919 East Lake Street and donated the property at 2800 East Lake Street for redevelopment as an affordable housing project.
In May 2022, Bancorp announced a five-year community benefits plan, developed in coordination with the NCRC and the CRC as part of the planned acquisition of MUFG Union Bank. The $100 billion community plan is set over five years and is focusing on supporting equitable access to capital for low- and moderate-income communities and communities of color.
Controversies
In December 2019, the bank dismissed Emily James, a Portland, Ore., call-center employee, and her supervisor, after James gave $20 (~$25.00 in 2025) of her own money to Marc Eugenio. On Christmas Eve, Eugenio ran out of gasoline and cash, and he was stranded at a gas station when his U.S. Bank debit card was rejected because funds he had deposited two days earlier had not yet been released into his account. After an unsuccessful attempt to release the funds, James met Eugenio at the gas station during her break and offered him $20 from her own pocket as a Christmas Eve act of kindness. She was fired from her job for violating company policy, but rehired after an investigation prompted by an article from Nicolas Kristof was published in The New York Times.
Notable corporate buildings
U.S. Bank owns corporate naming rights to U.S. Bank Stadium in Minneapolis, Minnesota.
Źródło: Wikipedia (Angielski), CC BY-SA 4.0 · Zobacz w Wikipedii ↗
Wyniki 10-letnie Trendy przychodów, zysku netto, marż i EPS
Wycena Wskaźniki P/E, P/S, P/B, EV/EBITDA — czy akcje są drogie, czy tanie?
| Wskaźnik | Trend 5-letni | USB | średnia z 5 lat | Mediana porównawcza | Werdykt |
|---|---|---|---|---|---|
| P/E (TTM) | 11.5średnia z 5 lat ≈12.0 | ≈12.0 | 13.3 | Niedowartościowany | |
| P/S (TTM) | 3.0średnia z 5 lat ≈2.9 | ≈2.9 | 3.5 | Niedowartościowany | |
| P/B (MRQ) | 1.3średnia z 5 lat ≈1.3 | ≈1.3 | 1.4 | Wartość godziwa | |
| Price / Cash Flow (Cena / Przepływy pieniężne) | 11.2średnia z 5 lat ≈7.5 | ≈7.5 | 14.6 | Niedowartościowany | |
| Cena / Wartość księgowa materialna (MRQ) | 1.4średnia z 5 lat ≈1.9 | ≈1.9 | · | · | |
| PEG Ratio (Współczynnik PEG) | ≈1.3 | · | · | · |
Mediana porównawcza jest obliczana na znormalizowanej podstawie dla każdej metryki i może nie zawsze odpowiadać podstawie TTM/MRQ pokazanej dla tej akcji.
Rentowność Marże brutto, operacyjne i netto; ROE, ROA, ROIC
| Wskaźnik | Trend 5-letni | USB | średnia z 5 lat | Mediana porównawcza | Werdykt |
|---|---|---|---|---|---|
| Marża przed opodatkowaniem (TTM) | 34.4%średnia z 5 lat ≈32.3% | ≈32.3% | 35.6% | Słaby | |
| Marża Zysku Netto (TTM) | 27.5%średnia z 5 lat ≈25.6% | ≈25.6% | 28.2% | Zgodnie z | |
| ROA (TTM) | 1.2%średnia z 5 lat ≈1.0% | ≈1.0% | 1.1% | Zgodnie z | |
| ROE (TTM) | 12.7%średnia z 5 lat ≈11.9% | ≈11.9% | 11.8% | Najwyższa półka |
Zdrowie finansowe Dług, płynność, wypłacalność — siła bilansu
| Wskaźnik | Trend 5-letni | USB | średnia z 5 lat | Mediana porównawcza | Werdykt |
|---|---|---|---|---|---|
| Dług / Kapitał Własny (MRQ) | 0.6średnia z 5 lat ≈0.3 | ≈0.3 | 0.2 | Wysokie zadłużenie |
Rozwój Wzrost przychodów, EPS i zysku netto: r/r, CAGR 3-letni, CAGR 5-letni
| Wskaźnik | Trend 5-letni | USB | średnia z 5 lat | Mediana porównawcza | Werdykt |
|---|---|---|---|---|---|
| Revenue YoY (Przychody R/R) | 4.4%średnia z 5 lat ≈5.9% | ≈5.9% | · | · | |
| Revenue CAGR 3Y (Przychody CAGR 3L) | 5.7% | · | · | · | |
| EPS YoY | 21.9%średnia z 5 lat ≈13.1% | ≈13.1% | · | · | |
| Net Income YoY (Zysk Netto R/R) | 20.2%średnia z 5 lat ≈12.6% | ≈12.6% | · | · | |
| EPS CAGR 3Y (CAGR z EPS 3 lata) | 7.8%średnia z 5 lat ≈0.20% | ≈0.20% | · | · | |
| EPS CAGR 5Y (CAGR z EPS 5 lat) | 8.6% | · | · | · | |
| Net Income CAGR 3Y (CAGR z zysku netto 3 lata) | 9.1%średnia z 5 lat ≈1.6% | ≈1.6% | · | · | |
| Net Income CAGR 5Y (CAGR z zysku netto 5 lat) | 8.8% | · | · | · |
Efektywność kapitałowa Rotacja aktywów, rotacja zapasów, rotacja należności
| Wskaźnik | Trend 5-letni | USB | średnia z 5 lat | Mediana porównawcza | Werdykt |
|---|---|---|---|---|---|
| Asset Turnover (Rotacja aktywów) | 0.0średnia z 5 lat ≈0.0 | ≈0.0 | 0.0 | Najwyższa półka | |
| Revenue / Employee (Przychody / pracownika) | ≈$409.4K | · | · | · |
wartość · ≈ średnia z 5 lat · mediana branżowa · werdykt względem mediany
Dywidendy Stopa dywidendy, wskaźnik wypłaty, historia dywidend, 5-letni CAGR
| Data ex-dywidendy | Kwota | Waluta | Stopa zwrotu |
|---|---|---|---|
| Cze 30, 2026 | $0,52 | USD | ≈3.4% |
| Mar 31, 2026 | $0,52 | USD | ≈4.0% |
| Gru 31, 2025 | $0,52 | USD | ≈3.8% |
| Wrz 30, 2025 | $0,52 | USD | ≈4.2% |
| Cze 30, 2025 | $0,50 | USD | ≈4.4% |
| Mar 31, 2025 | $0,50 | USD | ≈4.7% |
| Gru 31, 2024 | $0,50 | USD | ≈4.1% |
| Wrz 30, 2024 | $0,50 | USD | ≈4.3% |
| Cze 28, 2024 | $0,49 | USD | ≈4.9% |
| Mar 27, 2024 | $0,49 | USD | ≈4.4% |
| Gru 28, 2023 | $0,49 | USD | ≈4.4% |
| Wrz 28, 2023 | $0,48 | USD | ≈5.9% |
| Cze 29, 2023 | $0,48 | USD | ≈5.9% |
| Mar 30, 2023 | $0,48 | USD | ≈5.4% |
| Gru 29, 2022 | $0,48 | USD | ≈4.3% |
| Wrz 29, 2022 | $0,48 | USD | ≈4.6% |
| Cze 29, 2022 | $0,46 | USD | ≈4.0% |
| Mar 30, 2022 | $0,46 | USD | ≈3.3% |
| Gru 30, 2021 | $0,46 | USD | ≈3.1% |
| Wrz 29, 2021 | $0,46 | USD | ≈2.9% |
Historia zysków EPS faktyczny vs szacowany, zaskoczenie %, wskaźnik trafień, data następnych wyników
| Okres | Raport | EPS Actual | EPS Szacowany | Niespodzianka |
|---|---|---|---|---|
| 30 czerwca 2026 | Lip 16, 2026 | $1.35 | $1.29 | 4.7% |
| 31 marca 2026 | $1.18 | $1.16 | 2.1% | |
| 31 grudnia 2025 | $1.26 | $1.20 | 4.9% | |
| 30 września 2025 | $1.22 | $1.14 | 7.4% | |
| 30 czerwca 2025 | $1.11 | $1.08 | 2.8% | |
| 31 marca 2025 | $1.03 | $0.99 | 4.2% |
Pełne podstawowe wskaźniki Wszystkie wskaźniki roczne — rachunek zysków i strat, bilans, przepływy pieniężne
Rachunek zysków i strat
| Wskaźnik | Trend | 2025 | 2024 | 2023 | 2022 | 2021 | 2020 | 2019 | 2018 | 2017 | 2016 | 2015 | 2014 |
|---|---|---|---|---|---|---|---|---|---|---|---|---|---|
| Revenue | $28.66B | $27.45B | $28.14B | $24.30B | · | · | · | $22.64B | $21.90B | $21.31B | $20.31B | $20.16B | |
| Interest Expense | · | · | $12.61B | $3.22B | $993M | $2.02B | $4.44B | $3.25B | $1.97B | $1.47B | $1.40B | $1.45B | |
| Interest Income | $30.97B | $31.67B | $30.01B | $17.95B | $13.49B | $14.84B | $17.49B | $16.17B | $14.35B | $13.13B | $12.40B | $12.23B | |
| Pretax Income | $9.52B | $7.91B | $6.87B | $7.30B | $10.17B | $6.05B | $8.59B | $8.68B | $7.52B | $8.11B | $8.03B | $8.00B | |
| Income Tax | $1.92B | $1.58B | $1.41B | $1.46B | $2.18B | $1.07B | $1.65B | $1.55B | $1.26B | $2.16B | $2.10B | $2.09B | |
| Net Income | $7.57B | $6.30B | $5.43B | $5.83B | $7.96B | $4.96B | $6.91B | $7.10B | $6.22B | $5.89B | $5.88B | $5.85B | |
| EPS (Basic) | $4.62 | $3.79 | $3.27 | $3.69 | $5.11 | $3.06 | $4.16 | $4.15 | $3.53 | $3.25 | $3.18 | $3.10 | |
| EPS (Diluted) | $4.62 | $3.79 | $3.27 | $3.69 | $5.10 | $3.06 | $4.16 | $4.14 | $3.51 | $3.24 | $3.16 | $3.08 | |
| Shares (Basic) | 1,557,000,000 | 1,560,000,000 | 1,543,000,000 | 1,489,000,000 | 1,489,000,000 | 1,509,000,000 | 1,581,000,000 | 1,634,000,000 | 1,677,000,000 | 1,718,000,000 | 1,764,000,000 | 1,803,000,000 | |
| Shares (Diluted) | 1,558,000,000 | 1,561,000,000 | 1,543,000,000 | 1,490,000,000 | 1,490,000,000 | 1,510,000,000 | 1,583,000,000 | 1,638,000,000 | 1,683,000,000 | 1,724,000,000 | 1,772,000,000 | 1,813,000,000 |
Bilans
| Wskaźnik | Trend | 2025 | 2024 | 2023 | 2022 | 2021 | 2020 | 2019 | 2018 | 2017 | 2016 | 2015 | 2014 |
|---|---|---|---|---|---|---|---|---|---|---|---|---|---|
| PP&E (Net) | · | · | · | $3.86B | $3.31B | $3.47B | $3.70B | $2.46B | $2.43B | $2.44B | $2.51B | $2.62B | |
| PP&E (Gross) | · | · | · | $8.93B | $8.25B | $8.62B | $8.66B | $7.25B | $7.06B | $6.85B | $6.72B | $6.73B | |
| Accum. Depreciation | · | · | · | $5.07B | $4.95B | $5.15B | $4.95B | $4.79B | $4.63B | $4.41B | $4.21B | $4.11B | |
| Goodwill | $12.63B | $12.54B | $12.49B | $12.37B | $10.26B | $9.92B | $9.65B | $9.37B | $9.43B | $9.34B | $9.36B | $9.39B | |
| Intangibles | $4.90B | $5.55B | $6.08B | $7.16B | $3.74B | $2.86B | $3.22B | $3.39B | $3.23B | $3.30B | $3.35B | $3.16B | |
| Total Assets | $692.35B | $678.32B | $663.49B | $674.80B | $573.28B | $553.90B | $495.43B | $467.37B | $462.04B | $445.96B | $421.85B | $402.53B | |
| Short-term Debt | $17.16B | $15.52B | $15.28B | $31.22B | $11.80B | $11.77B | $23.72B | $14.14B | $16.65B | $13.96B | $27.88B | $29.89B | |
| Total Liabilities | $626.69B | $619.28B | $607.72B | $623.57B | $517.90B | $500.18B | $442.94B | $415.72B | $412.37B | $398.03B | $375.04B | $358.36B | |
| Long-term Debt | · | · | · | $39.83B | $32.12B | $41.30B | $40.17B | $41.34B | $32.26B | $33.32B | $32.08B | $32.26B | |
| Total Debt | $17.16B | $15.52B | $15.28B | $31.22B | $11.80B | $11.77B | $23.72B | $14.14B | $16.65B | $13.96B | $27.88B | · | |
| Common Stock | $21M | $21M | $21M | $21M | $21M | $21M | $21M | $21M | $21M | $21M | $21M | $21M | |
| Retained Earnings | $80.91B | $76.86B | $74.03B | $71.90B | $69.20B | $64.19B | $63.19B | $59.06B | $54.14B | $50.15B | $46.38B | $42.53B | |
| Treasury Stock | $24.28B | $24.07B | $24.13B | $25.27B | $27.27B | $25.93B | $24.44B | $20.19B | $17.60B | $15.28B | $13.12B | $11.24B | |
| AOCI | $-6.99B | $-9.76B | $-10.10B | $-11.41B | $-1.94B | $322M | $-1.37B | $-2.32B | $-1.40B | $-1.53B | $-1.02B | $-896M | |
| Stockholders' Equity | $65.19B | $58.58B | $55.31B | $50.77B | $54.92B | $53.09B | $51.85B | $51.03B | $49.04B | $47.30B | $46.13B | $43.48B | |
| Liabilities + Equity | $692.35B | $678.32B | $663.49B | $674.80B | $573.28B | $553.90B | $495.43B | $467.37B | $462.04B | $445.96B | $421.85B | $402.53B | |
| Shares Outstanding | 1,555,000,000 | 1,560,000,000 | 1,558,000,000 | 1,531,000,000 | 1,484,000,000 | 1,507,000,000 | 1,534,000,000 | 1,608,000,000 | 1,656,000,000 | 1,697,000,000 | 1,745,000,000 | 1,786,000,000 |
Przepływy pieniężne
| Wskaźnik | Trend | 2025 | 2024 | 2023 | 2022 | 2021 | 2020 | 2019 | 2018 | 2017 | 2016 | 2015 | 2014 |
|---|---|---|---|---|---|---|---|---|---|---|---|---|---|
| Deferred Tax | $308M | $29M | $-509M | · | · | · | · | · | · | · | · | · | |
| Amort. of Intangibles | $498M | $569M | $636M | $215M | $159M | $176M | $168M | $161M | $175M | $179M | $174M | $199M | |
| Operating Cash Flow | $7.97B | $11.35B | $8.39B | $21.12B | $9.87B | $3.72B | $4.89B | $10.56B | $6.47B | $5.34B | $8.78B | $5.33B | |
| Investing Cash Flow | $-20.54B | $-24.53B | $18.93B | $7.50B | $-57.49B | $-15.44B | $-21.56B | $-8.98B | $-12.13B | $-17.96B | · | · | |
| Debt Issued | $10.36B | $12.02B | $15.58B | $8.73B | $2.63B | $14.50B | $9.90B | $12.08B | $9.43B | $10.71B | $5.07B | $16.39B | |
| Net Debt Issued | $1.31B | $5.97B | $11.50B | $1.81B | $-8.81B | $25M | $-1.22B | $9.15B | $-1.08B | $1.22B | $-244M | · | |
| Stock Issued | $45M | $32M | $951M | $21M | $43M | $15M | $88M | $86M | $159M | $355M | $295M | $453M | |
| Stock Repurchased | $489M | $173M | $62M | $69M | $1.55B | $1.67B | $4.53B | $2.82B | $2.63B | $2.56B | $2.19B | $2.20B | |
| Net Stock Activity | $-444M | $-141M | $889M | $-48M | $-1.51B | $-1.66B | $-4.44B | $-2.74B | $-2.47B | $-2.20B | $-1.90B | · | |
| Dividends Paid | $3.17B | $3.09B | $2.97B | $2.78B | $2.58B | $2.55B | $2.44B | $2.09B | $1.93B | $1.81B | $1.78B | $1.73B | |
| Financing Cash Flow | $2.25B | $8.82B | $-20.00B | $-3.98B | $13.94B | $51.90B | $17.62B | $361M | $9.45B | $17.18B | · | · | |
| Net Change in Cash | $-9.61B | $-4.69B | $7.65B | $24.64B | $-33.67B | $40.17B | $952M | $1.95B | $3.80B | · | · | · | |
| Taxes Paid | $544M | $499M | $645M | · | · | · | · | · | · | · | · | · |
Rentowność
| Wskaźnik | Trend | 2025 | 2024 | 2023 | 2022 | 2021 | 2020 | 2019 | 2018 | 2017 | 2016 | 2015 | 2014 |
|---|---|---|---|---|---|---|---|---|---|---|---|---|---|
| Net Margin | 26.4% | 22.9% | 19.3% | 24.1% | 35.0% | 21.3% | 30.2% | 31.4% | 28.2% | 27.6% | 28.9% | · | |
| Pretax Margin | 33.2% | 28.8% | 24.4% | 30.2% | 44.7% | 26.1% | 37.6% | 38.3% | 34.1% | 38.0% | 39.5% | · | |
| ROA | 1.1% | 0.94% | 0.81% | 0.93% | 1.4% | 0.95% | 1.4% | 1.5% | 1.4% | 1.4% | 1.4% | · | |
| ROE | 12.2% | 11.1% | 10.2% | 11.0% | 14.7% | 9.4% | 13.4% | 14.2% | 12.9% | 12.6% | 13.1% | · |
Płynność i wypłacalność
| Wskaźnik | Trend | 2025 | 2024 | 2023 | 2022 | 2021 | 2020 | 2019 | 2018 | 2017 | 2016 | 2015 | 2014 |
|---|---|---|---|---|---|---|---|---|---|---|---|---|---|
| Debt / Equity | 0.3 | 0.3 | 0.3 | 0.6 | 0.2 | 0.2 | 0.5 | 0.3 | 0.3 | 0.3 | 0.6 | · |
Efektywność
| Wskaźnik | Trend | 2025 | 2024 | 2023 | 2022 | 2021 | 2020 | 2019 | 2018 | 2017 | 2016 | 2015 | 2014 |
|---|---|---|---|---|---|---|---|---|---|---|---|---|---|
| Asset Turnover | 0.0 | 0.0 | 0.0 | 0.0 | 0.0 | 0.0 | 0.0 | 0.0 | 0.0 | 0.0 | 0.0 | · |
Na akcję
| Wskaźnik | Trend | 2025 | 2024 | 2023 | 2022 | 2021 | 2020 | 2019 | 2018 | 2017 | 2016 | 2015 | 2014 |
|---|---|---|---|---|---|---|---|---|---|---|---|---|---|
| Book Value / Share | $40.75 | $36.61 | $34.57 | $33.84 | $36.61 | $35.40 | $34.57 | $31.89 | $28.85 | $27.82 | $27.14 | · | |
| Revenue / Share | $18.39 | $17.59 | $18.24 | $16.23 | $15.25 | $15.38 | $14.46 | $13.82 | $13.11 | $12.36 | $11.46 | · | |
| Cash Flow / Share | $5.12 | $7.22 | $5.47 | $14.17 | $6.62 | $2.46 | $3.09 | $6.45 | $3.85 | $3.10 | $4.96 | · | |
| Dividend / Share | $2.04 | $1.98 | $1.93 | $1.88 | $1.76 | $1.68 | $1.58 | $1.34 | $1.16 | $1.07 | $1.01 | $0.96 | |
| EPS (TTM) | $4.62 | $3.79 | $3.27 | $3.69 | $5.10 | $3.06 | $4.16 | $4.14 | $3.51 | $3.24 | $3.16 | $3.08 |
Stopy Wzrostu
| Wskaźnik | Trend | 2025 | 2024 | 2023 | 2022 | 2021 | 2020 | 2019 | 2018 | 2017 | 2016 | 2015 | 2014 |
|---|---|---|---|---|---|---|---|---|---|---|---|---|---|
| Revenue YoY | 4.4% | -2.5% | 15.8% | · | · | · | · | · | · | · | · | · | |
| Revenue CAGR 3Y | 5.7% | · | · | · | · | · | · | · | · | · | · | · | |
| EPS YoY | 21.9% | 15.9% | -11.4% | -27.7% | 66.7% | · | · | · | · | · | · | · | |
| EPS CAGR 3Y | 7.8% | -9.4% | 2.2% | · | · | · | · | · | · | · | · | · | |
| EPS CAGR 5Y | 8.6% | · | · | · | · | · | · | · | · | · | · | · | |
| Net Income YoY | 20.2% | 16.0% | -6.8% | -26.9% | 60.6% | · | · | · | · | · | · | · | |
| Net Income CAGR 3Y | 9.1% | -7.5% | 3.1% | · | · | · | · | · | · | · | · | · | |
| Net Income CAGR 5Y | 8.8% | · | · | · | · | · | · | · | · | · | · | · | |
| Dividends Paid CAGR 5Y | 4.4% | · | · | · | · | · | · | · | · | · | · | · |
Wycena (TTM)
| Wskaźnik | Trend | 2025 | 2024 | 2023 | 2022 | 2021 | 2020 | 2019 | 2018 | 2017 | 2016 | 2015 | 2014 |
|---|---|---|---|---|---|---|---|---|---|---|---|---|---|
| Revenue TTM | $28.66B | $27.45B | $28.14B | $24.30B | $23.02B | $23.02B | $23.02B | $22.64B | $21.90B | $21.31B | $20.31B | $20.16B | |
| Net Income TTM | $7.57B | $6.30B | $5.43B | $5.83B | $7.96B | $4.96B | $6.91B | $7.10B | $6.22B | $5.89B | $5.88B | $5.85B | |
| Market Cap | $85.38B | $76.53B | $69.25B | $65.42B | $84.25B | $69.89B | $88.94B | $73.12B | $91.09B | $87.33B | $72.54B | · | |
| P/E | 11.5 | 12.6 | 13.2 | 11.8 | 11.0 | 15.2 | 14.3 | 11.0 | 15.3 | 15.9 | 13.5 | 14.6 | |
| P/S | 3.0 | 2.8 | 2.5 | 2.7 | 3.7 | 3.0 | 3.9 | 3.2 | 4.2 | 4.1 | 3.6 | · | |
| P/B | 1.3 | 1.3 | 1.3 | 1.3 | 1.5 | 1.3 | 1.7 | 1.4 | 1.9 | 1.8 | 1.6 | · | |
| P / Tangible Book | 1.8 | 1.9 | 1.9 | 2.1 | 2.1 | 1.7 | · | · | · | · | · | · | |
| P / Cash Flow | 10.7 | 6.8 | 8.2 | 3.1 | 8.5 | 18.8 | 18.2 | 6.9 | 14.1 | 16.4 | 8.3 | · | |
| Dividend Yield | 3.7% | 4.0% | 4.3% | 4.2% | 3.1% | 3.6% | 2.8% | 2.9% | 2.1% | 2.1% | 2.5% | · | |
| Earnings Yield | 8.7% | 7.9% | 7.6% | 8.5% | 9.1% | 6.6% | 7.0% | 9.1% | 6.6% | 6.3% | 7.4% | 6.9% | |
| Payout Ratio | 41.9% | 49.1% | 54.7% | 47.7% | 32.4% | 51.5% | 35.3% | 29.5% | 31.0% | 30.7% | 30.2% | · | |
| Annual Payout | $3.17B | $3.09B | $2.97B | $2.78B | $2.58B | $2.55B | $2.44B | $2.09B | $1.93B | $1.81B | $1.78B | $1.73B |
Rachunek zysków i strat
| Wskaźnik | Trend | Q2 2026 | Q1 2026 | Q4 2025 | Q3 2025 | Q2 2025 | Q1 2025 | Q4 2024 | Q3 2024 | Q2 2024 | Q1 2024 | Q4 2023 | Q3 2023 | Q2 2023 | Q1 2023 | Q4 2022 | Q3 2022 |
|---|---|---|---|---|---|---|---|---|---|---|---|---|---|---|---|---|---|
| Revenue | $7.71B | $7.29B | $7.37B | $7.33B | $7.00B | $6.96B | $7.01B | $6.86B | $6.87B | $6.71B | $6.76B | $7.03B | $7.17B | $7.17B | $6.37B | $6.33B | |
| Interest Expense | · | · | · | · | · | · | · | · | · | $3.78B | · | $3.52B | $3.11B | $2.33B | · | $901M | |
| Interest Income | $7.60B | $7.84B | $7.92B | $7.93B | $7.60B | $7.52B | $7.83B | $8.09B | $7.99B | $7.76B | $7.76B | $7.75B | $7.53B | $6.96B | $5.97B | $4.73B | |
| Pretax Income | $2.72B | $2.42B | $2.53B | $2.53B | $2.29B | $2.16B | $2.11B | $2.07B | $2.06B | $1.67B | $1.00B | $1.96B | $1.75B | $2.16B | $1.10B | $2.30B | |
| Income Tax | $537M | $469M | $482M | $524M | $472M | $443M | $438M | $350M | $445M | $347M | $139M | $431M | $382M | $455M | $171M | $481M | |
| Net Income | $2.18B | $1.95B | $2.04B | $2.00B | $1.81B | $1.71B | $1.66B | $1.71B | $1.60B | $1.32B | $847M | $1.52B | $1.36B | $1.70B | $925M | $1.81B | |
| EPS (Basic) | $1.35 | $1.18 | $1.26 | $1.22 | $1.11 | $1.03 | $1.01 | $1.03 | $0.97 | $0.78 | $0.48 | $0.91 | $0.84 | $1.04 | $0.55 | $1.16 | |
| EPS (Diluted) | $1.35 | $1.18 | $1.26 | $1.22 | $1.11 | $1.03 | $1.01 | $1.03 | $0.97 | $0.78 | $0.48 | $0.91 | $0.84 | $1.04 | $0.55 | $1.16 | |
| Shares (Basic) | 1,554,000,000 | 1,554,000,000 | · | 1,557,000,000 | 1,559,000,000 | 1,559,000,000 | · | 1,561,000,000 | 1,560,000,000 | 1,559,000,000 | · | 1,548,000,000 | 1,533,000,000 | 1,532,000,000 | · | 1,486,000,000 | |
| Shares (Diluted) | 1,555,000,000 | 1,555,000,000 | · | 1,557,000,000 | 1,559,000,000 | 1,560,000,000 | · | 1,561,000,000 | 1,561,000,000 | 1,559,000,000 | · | 1,549,000,000 | 1,533,000,000 | 1,532,000,000 | · | 1,486,000,000 |
Bilans
| Wskaźnik | Trend | Q2 2026 | Q1 2026 | Q4 2025 | Q3 2025 | Q2 2025 | Q1 2025 | Q4 2024 | Q3 2024 | Q2 2024 | Q1 2024 | Q4 2023 | Q3 2023 | Q2 2023 | Q1 2023 | Q4 2022 | Q3 2022 |
|---|---|---|---|---|---|---|---|---|---|---|---|---|---|---|---|---|---|
| PP&E (Net) | · | · | · | · | · | · | · | · | · | · | · | $3.62B | $3.69B | $3.73B | · | $3.15B | |
| Goodwill | $13.23B | $12.62B | $12.63B | $12.63B | $12.64B | $12.55B | $12.54B | $12.57B | $12.48B | $12.48B | $12.49B | $12.47B | $12.49B | $12.56B | $12.37B | $10.12B | |
| Intangibles | $5.00B | $4.80B | $4.90B | $5.15B | $5.29B | $5.38B | $5.55B | $5.49B | $5.76B | $6.03B | · | $6.43B | $6.63B | $6.88B | · | $4.60B | |
| Total Assets | $725.92B | $701.00B | $692.35B | $695.36B | $686.37B | $676.49B | $678.32B | $686.47B | $680.06B | $683.61B | · | $668.04B | $680.83B | $682.38B | · | $600.97B | |
| Short-term Debt | $37.34B | $17.86B | $17.16B | $15.45B | $15.04B | $17.16B | $15.52B | $23.71B | $16.56B | $17.10B | · | $21.90B | $32.33B | $56.88B | · | $25.07B | |
| Total Liabilities | $658.02B | $634.75B | $626.69B | $631.56B | $624.47B | $615.93B | $619.28B | $627.15B | $623.17B | $627.57B | · | $614.46B | $627.34B | $628.92B | · | $553.00B | |
| Long-term Debt | · | · | · | · | · | · | · | · | · | · | · | $43.07B | $45.28B | $42.05B | · | $32.23B | |
| Total Debt | $37.34B | $17.86B | · | $15.45B | $15.04B | $17.16B | · | $23.71B | $16.56B | $17.10B | · | $21.90B | $32.33B | $56.88B | · | $25.07B | |
| Common Stock | $21M | $21M | $21M | $21M | $21M | $21M | $21M | $21M | $21M | $21M | · | $21M | $21M | $21M | · | $21M | |
| Retained Earnings | $83.24B | $81.94B | $80.91B | $79.74B | $78.65B | $77.69B | $76.86B | $76.06B | $75.23B | $74.47B | · | $74.02B | $73.36B | $72.81B | · | $71.78B | |
| Treasury Stock | $24.30B | $24.39B | $24.28B | $24.23B | $24.14B | $24.06B | $24.07B | $24.01B | $24.02B | $24.02B | · | $24.17B | $25.19B | $25.19B | · | $27.19B | |
| AOCI | $-7.11B | $-7.22B | $-6.99B | $-7.75B | $-8.61B | $-9.04B | $-9.76B | $-8.75B | $-10.31B | $-10.35B | · | $-12.26B | $-10.72B | $-10.15B | · | $-12.50B | |
| Stockholders' Equity | $67.43B | $65.79B | $65.19B | $63.34B | $61.44B | $60.10B | $58.58B | $58.86B | $56.42B | $55.57B | · | $53.11B | $53.02B | $52.99B | · | $47.51B | |
| Liabilities + Equity | $725.92B | $701.00B | $692.35B | $695.36B | $686.37B | $676.49B | $678.32B | $686.47B | $680.06B | $683.61B | · | $668.04B | $680.83B | $682.38B | · | $600.97B | |
| Shares Outstanding | 1,558,000,000 | 1,555,000,000 | 1,600,000,000 | 1,556,000,000 | 1,558,000,000 | 1,560,000,000 | 1,560,000,000 | 1,561,000,000 | 1,560,000,000 | 1,560,000,000 | 1,558,000,000 | 1,557,000,000 | 1,533,000,000 | 1,533,000,000 | 1,531,000,000 | 1,486,000,000 |
Przepływy pieniężne
| Wskaźnik | Trend | Q2 2026 | Q1 2026 | Q4 2025 | Q3 2025 | Q2 2025 | Q1 2025 | Q4 2024 | Q3 2024 | Q2 2024 | Q1 2024 | Q4 2023 | Q3 2023 | Q2 2023 | Q1 2023 | Q4 2022 | Q3 2022 |
|---|---|---|---|---|---|---|---|---|---|---|---|---|---|---|---|---|---|
| Amort. of Intangibles | $114M | $110M | $126M | $125M | $124M | $123M | $139M | $142M | $142M | $146M | $156M | $161M | $159M | $160M | $85M | $43M | |
| Operating Cash Flow | $4.82B | $1.34B | $2.84B | $3.39B | $2.03B | $-308M | $4.84B | $972M | $2.87B | $2.66B | $362M | $3.87B | $3.32B | $842M | $6.89B | $3.50B | |
| Investing Cash Flow | $-6.38B | $-5.35B | $-16.85B | $230M | $-1.37B | $-2.55B | $-12.88B | $1.62B | $-8.33B | $-4.95B | $1.80B | $5.64B | $6.55B | $4.94B | $34.58B | $-7.56B | |
| Debt Issued | $4.10B | $3.29B | $69M | $964M | $5.74B | $3.59B | $3.21B | $3.86B | $1.38B | $3.56B | $8.33B | $24M | $3.53B | $3.70B | $3.10B | $3.42B | |
| Net Debt Issued | · | $64M | · | · | · | $1.49B | · | · | · | $1.39B | · | · | · | $2.11B | · | · | |
| Stock Issued | $3M | $16M | $13M | $10M | $6M | $16M | $10M | $8M | $1M | $13M | $9M | $936M | $0 | $6M | $5M | $0 | |
| Stock Repurchased | $201M | $276M | $122M | $101M | $106M | $160M | $122M | $1M | $1M | $49M | $17M | $1M | $0 | $44M | $14M | $0 | |
| Net Stock Activity | · | $-260M | · | · | · | $-144M | · | · | · | $-36M | · | · | · | $-38M | · | · | |
| Dividends Paid | $812M | $816M | $813M | $784M | $784M | $787M | $785M | $768M | $769M | $770M | $751M | $740M | $739M | $740M | $716M | $687M | |
| Financing Cash Flow | $19.70B | $5.67B | $-6.44B | $5.21B | $7.13B | $-3.90B | $-8.70B | $5.14B | $-5.70B | $18.09B | $-5.65B | $-15.80B | $-5.45B | $6.90B | $-29.57B | $6.58B | |
| Net Change in Cash | $18.07B | $1.53B | $-19.75B | $8.83B | $7.79B | $-6.49B | $-17.06B | $7.73B | $-11.15B | $15.79B | $-3.16B | $-6.29B | $4.41B | $12.69B | $11.89B | $2.53B |
Rentowność
| Wskaźnik | Trend | Q2 2026 | Q1 2026 | Q4 2025 | Q3 2025 | Q2 2025 | Q1 2025 | Q4 2024 | Q3 2024 | Q2 2024 | Q1 2024 | Q4 2023 | Q3 2023 | Q2 2023 | Q1 2023 | Q4 2022 | Q3 2022 |
|---|---|---|---|---|---|---|---|---|---|---|---|---|---|---|---|---|---|
| Net Margin | 28.2% | 26.7% | · | 27.3% | 25.9% | 24.6% | · | 25.0% | 23.3% | 19.6% | · | 21.7% | 19.1% | 23.8% | · | 28.8% | |
| Pretax Margin | 35.3% | 33.2% | · | 34.5% | 32.7% | 31.0% | · | 30.2% | 29.9% | 24.9% | · | 27.8% | 24.5% | 30.2% | · | 36.5% | |
| ROA | 0.31% | 0.28% | · | 0.29% | 0.27% | 0.25% | · | 0.25% | 0.24% | 0.19% | · | 0.24% | 0.21% | 0.27% | · | 0.31% | |
| ROE | 3.4% | 3.1% | · | 3.3% | 3.1% | 3.0% | · | 3.1% | 2.9% | 2.4% | · | 3.0% | 2.7% | 3.3% | · | 3.6% |
Płynność i wypłacalność
| Wskaźnik | Trend | Q2 2026 | Q1 2026 | Q4 2025 | Q3 2025 | Q2 2025 | Q1 2025 | Q4 2024 | Q3 2024 | Q2 2024 | Q1 2024 | Q4 2023 | Q3 2023 | Q2 2023 | Q1 2023 | Q4 2022 | Q3 2022 |
|---|---|---|---|---|---|---|---|---|---|---|---|---|---|---|---|---|---|
| Debt / Equity | 0.6 | 0.3 | · | 0.2 | 0.2 | 0.3 | · | 0.4 | 0.3 | 0.3 | · | 0.4 | 0.6 | 1.1 | · | 0.5 |
Efektywność
| Wskaźnik | Trend | Q2 2026 | Q1 2026 | Q4 2025 | Q3 2025 | Q2 2025 | Q1 2025 | Q4 2024 | Q3 2024 | Q2 2024 | Q1 2024 | Q4 2023 | Q3 2023 | Q2 2023 | Q1 2023 | Q4 2022 | Q3 2022 |
|---|---|---|---|---|---|---|---|---|---|---|---|---|---|---|---|---|---|
| Asset Turnover | 0.0 | 0.0 | · | 0.0 | 0.0 | 0.0 | · | 0.0 | 0.0 | 0.0 | · | 0.0 | 0.0 | 0.0 | · | 0.0 |
Na akcję
| Wskaźnik | Trend | Q2 2026 | Q1 2026 | Q4 2025 | Q3 2025 | Q2 2025 | Q1 2025 | Q4 2024 | Q3 2024 | Q2 2024 | Q1 2024 | Q4 2023 | Q3 2023 | Q2 2023 | Q1 2023 | Q4 2022 | Q3 2022 |
|---|---|---|---|---|---|---|---|---|---|---|---|---|---|---|---|---|---|
| Book Value / Share | $43.28 | $42.31 | · | $40.71 | $39.43 | $38.52 | · | $37.71 | $36.17 | $35.62 | · | $34.11 | $34.59 | $34.57 | · | $31.97 | |
| Revenue / Share | $4.96 | $4.69 | · | $4.71 | $4.49 | $4.46 | · | $4.40 | $4.40 | $4.31 | · | $4.54 | $4.66 | $4.66 | · | $4.24 | |
| Cash Flow / Share | · | $0.86 | · | · | · | $-0.18 | · | · | · | $1.71 | · | · | · | $0.55 | · | · | |
| Dividend / Share | $0.52 | $0.52 | $0.52 | $0.52 | $0.50 | $0.50 | $0.50 | $0.50 | $0.49 | $0.49 | $0.49 | $0.48 | $0.48 | $0.48 | $0.48 | $0.48 | |
| EPS (TTM) | $5.01 | $4.77 | · | $4.37 | $4.18 | $4.04 | · | $3.26 | $3.14 | $3.01 | · | $3.34 | $3.59 | $3.74 | · | $4.21 |
Wycena (TTM)
| Wskaźnik | Trend | Q2 2026 | Q1 2026 | Q4 2025 | Q3 2025 | Q2 2025 | Q1 2025 | Q4 2024 | Q3 2024 | Q2 2024 | Q1 2024 | Q4 2023 | Q3 2023 | Q2 2023 | Q1 2023 | Q4 2022 | Q3 2022 |
|---|---|---|---|---|---|---|---|---|---|---|---|---|---|---|---|---|---|
| Revenue TTM | $29.69B | $28.99B | · | $28.30B | $27.84B | $27.70B | · | $27.21B | $27.38B | $27.68B | · | $27.75B | $27.04B | · | · | · | |
| Net Income TTM | $8.17B | $7.81B | · | $7.19B | $6.90B | $6.69B | · | $5.48B | $5.29B | $5.05B | · | $5.51B | $5.80B | $5.97B | · | $6.57B | |
| Market Cap | $94.10B | $80.88B | · | $75.20B | $70.50B | $65.86B | · | $71.38B | $61.93B | $69.73B | · | $51.47B | $50.65B | $55.26B | · | $59.92B | |
| P/E | 12.1 | 10.9 | · | 11.1 | 10.8 | 10.5 | · | 14.0 | 12.6 | 14.9 | · | 9.9 | 9.2 | 9.6 | · | 9.6 | |
| P/S | 3.2 | 2.8 | · | 2.7 | 2.5 | 2.4 | · | 2.6 | 2.3 | 2.5 | · | 1.9 | 1.9 | · | · | · | |
| P/B | 1.4 | 1.2 | · | 1.2 | 1.1 | 1.1 | · | 1.2 | 1.1 | 1.3 | · | 1.0 | 1.0 | 1.0 | · | 1.3 | |
| P / Tangible Book | 1.9 | 1.7 | · | 1.7 | 1.6 | 1.6 | · | 1.7 | 1.6 | 1.9 | · | 1.5 | 1.5 | 1.6 | · | 1.8 | |
| P / Cash Flow | · | 60.4 | · | · | · | -231.1 | · | · | · | 26.2 | · | · | · | 65.6 | · | · | |
| Dividend Yield | 3.4% | 4.0% | · | 4.2% | 4.4% | 4.7% | · | 4.3% | 4.9% | 4.3% | · | 5.7% | 5.7% | 5.1% | · | 4.6% | |
| Earnings Yield | 8.3% | 9.2% | · | 9.0% | 9.2% | 9.6% | · | 7.1% | 7.9% | 6.7% | · | 10.1% | 10.9% | 10.4% | · | 10.4% | |
| Payout Ratio | · | 41.9% | · | · | · | 46.1% | · | · | · | 58.4% | · | · | · | 43.6% | · | · | |
| Annual Payout | $3.23B | $3.20B | · | $3.14B | $3.12B | $3.11B | · | $3.06B | $3.03B | $3.00B | · | $2.94B | $2.88B | $2.83B | · | $2.75B |
Najnowszy okres po lewej · wartości null pokazane jako ·
Sprawozdania finansowe Rachunek zysków i strat, bilans, przepływy pieniężne — roczne, ostatnie 5 lat
| Wskaźnik | 2025-12-31 | 2024-12-31 | 2023-12-31 | 2022-12-31 | 2021-12-31 |
|---|---|---|---|---|---|
| Przychody | $28.66B | $27.45B | $28.14B | $24.30B | · |
| Zysk netto | $7.57B | $6.30B | $5.43B | $5.83B | $7.96B |
| Rozwodniony EPS | $4.62 | $3.79 | $3.27 | $3.69 | $5.10 |
| Wskaźnik | 2025-12-31 | 2024-12-31 | 2023-12-31 | 2022-12-31 | 2021-12-31 |
|---|---|---|---|---|---|
| Dług / Kapitał Własny | 0.3 | 0.3 | 0.3 | 0.6 | 0.2 |
Zbyt mało danych fundamentalnych, aby utworzyć to sprawozdanie.
Właściciele instytucjonalni (13F) 2 258 emitentów · $82.8B łącznie · Na dzień 30 września 2026
Instytucje, które zgłaszają posiadanie tych akcji w swoich kwartalnych zgłoszeniach SEC Form 13F. Tylko pozycje długie; pojedynczy zgłaszający może pojawić się dwukrotnie dla oddzielnych transz opcji. Duże przeciwstawne pozycje put/call zazwyczaj odzwierciedlają działalność market-makingową lub zabezpieczone zapasy, a nie przekonanie kierunkowe.
| Nowe pozycje | Zamknięte pozycje | Zwiększone | Zmniejszony | Zmiana liczby akcji netto |
|---|---|---|---|---|
| 189 (+3 vs poprzedni kw.) | 90 (-39 vs poprzedni kw.) | 765 (-16 vs poprzedni kw.) | 782 (+37 vs poprzedni kw.) | +36.0M |
Porównano z Q1 2026. Zgłoszenia SEC Form 13F są wymagane w ciągu 45 dni od końca kwartału plus krótki bufor dla spóźnionych zgłoszeń — kwartały mieszczące się jeszcze w tym terminie są pomijane na rzecz ostatniej w pełni zgłoszonej pary.
| Instytucja | Wartość | Akcje | % z śledzonych 13F | Typ |
|---|---|---|---|---|
| VANGUARD GROUP INC | $7 810 665 141 | 146 376 783 | 9,44% | Akcje |
| BlackRock, Inc. | $7 679 088 204 | 127 137 222 | 9,28% | Akcje |
| VANGUARD CAPITAL MANAGEMENT LLC | $6 118 671 664 | 101 302 511 | 7,39% | Akcje |
| STATE STREET CORP | $4 454 862 335 | 73 137 322 | 5,38% | Akcje |
| JPMORGAN CHASE & CO | $3 657 559 980 | 59 686 029 | 4,42% | Akcje |
| FMR LLC | $3 097 593 548 | 51 284 661 | 3,74% | Akcje |
| MUFG BANK, LTD. | $2 680 198 962 | 44 374 155 | 3,24% | Akcje |
| GEODE CAPITAL MANAGEMENT, LLC | $2 361 358 317 | 39 253 077 | 2,85% | Akcje |
| MORGAN STANLEY | $1 845 400 144 | 30 552 978 | 2,23% | Akcje |
| VANGUARD PORTFOLIO MANAGEMENT LLC | $1 812 269 022 | 30 004 454 | 2,19% | Akcje |
| Davis Selected Advisers | $1 295 909 823 | 21 453 510 | 1,57% | Akcje |
| NORGES BANK | $1 204 395 992 | 19 940 331 | 1,46% | Akcje |
| Invesco Ltd. | $1 195 703 214 | 19 796 411 | 1,44% | Akcje |
| Aristotle Capital Management, LLC | $1 062 632 246 | 17 593 197 | 1,28% | Akcje |
| NORTHERN TRUST CORP | $1 035 377 767 | 17 142 016 | 1,25% | Akcje |
| ROYAL BANK OF CANADA | $969 304 000 | 16 048 112 | 1,17% | Akcje |
| BANK OF AMERICA CORP /DE/ | $919 586 393 | 15 224 940 | 1,11% | Akcje |
| Grantham, Mayo, Van Otterloo & Co. LLC | $899 067 070 | 14 885 214 | 1,09% | Akcje |
| GOLDMAN SACHS GROUP INC | $887 068 552 | 14 686 566 | 1,07% | Akcje |
| FEDERATED HERMES, INC. | $712 544 960 | 11 797 102 | 0,86% | Akcje |
| FIRST TRUST ADVISORS LP | $668 779 833 | 11 072 514 | 0,81% | Akcje |
| UBS AM, a distinct business unit of UBS ASSET MANAGEMENT AMERICAS LLC | $651 707 093 | 12 530 419 | 0,79% | Akcje |
| HOTCHKIS & WILEY CAPITAL MANAGEMENT LLC | $638 194 373 | 10 566 132 | 0,77% | Akcje |
| DIMENSIONAL FUND ADVISORS LP | $631 579 600 | 10 454 788 | 0,76% | Akcje |
| CHARLES SCHWAB INVESTMENT MANAGEMENT INC | $631 205 972 | 10 450 430 | 0,76% | Akcje |
| FRANKLIN RESOURCES INC | $606 423 690 | 10 040 127 | 0,73% | Akcje |
| Legal & General Group Plc | $598 716 325 | 9 912 522 | 0,72% | Akcje |
| Capital Research Global Investors | $551 501 407 | 9 130 818 | 0,67% | Akcje |
| First Eagle Investment Management, LLC | $551 032 694 | 9 123 058 | 0,67% | Akcje |
| Bank of New York Mellon Corp | $536 456 941 | 8 881 737 | 0,65% | Akcje |
| VANGUARD FIDUCIARY TRUST CO | $526 373 558 | 8 714 794 | 0,64% | Akcje |
| VICTORY CAPITAL MANAGEMENT INC | $461 477 316 | 7 640 353 | 0,56% | Akcje |
| AMERIPRISE FINANCIAL INC | $455 126 969 | 7 533 756 | 0,55% | Akcje |
| AMERICAN CENTURY COMPANIES INC | $429 364 661 | 7 108 684 | 0,52% | Akcje |
| BARCLAYS PLC | $411 690 388 | 6 816 066 | 0,50% | Akcje |
| US BANCORP \DE\ | $400 830 217 | 6 636 256 | 0,48% | Akcje |
| STATE FARM MUTUAL AUTOMOBILE INSURANCE CO | $393 537 589 | 6 515 523 | 0,48% | Akcje |
| Amundi | $385 132 322 | 6 376 362 | 0,47% | Akcje |
| ENVESTNET ASSET MANAGEMENT INC | $383 498 250 | 6 349 309 | 0,46% | Akcje |
| BROWN BROTHERS HARRIMAN & CO | $345 364 724 | 5 717 959 | 0,42% | Akcje |
| DEUTSCHE BANK AG\ | $340 364 569 | 5 635 175 | 0,41% | Akcje |
| WELLS FARGO & COMPANY/MN | $328 128 739 | 5 432 595 | 0,40% | Akcje |
| UBS Group AG | $325 022 733 | 5 381 171 | 0,39% | Akcje |
| Fisher Asset Management, LLC | $284 501 475 | 4 710 288 | 0,34% | Akcje |
| ALLIANCEBERNSTEIN L.P. | $279 181 826 | 5 367 849 | 0,34% | Akcje |
| BANK OF MONTREAL /CAN/ | $272 617 494 | 4 513 535 | 0,33% | Akcje |
| RAYMOND JAMES FINANCIAL INC | $271 180 697 | 4 489 746 | 0,33% | Akcje |
| AQR CAPITAL MANAGEMENT LLC | $268 878 063 | 4 451 623 | 0,32% | Akcje |
| Balyasny Asset Management L.P. | $267 767 515 | 4 433 237 | 0,32% | Akcje |
| HSBC HOLDINGS PLC | $265 820 996 | 4 394 393 | 0,32% | Akcje |
Aktywiści i właściciele 5%+ 4 akcje
Inwestorzy, którzy złożyli SEC Schedule 13D — posiadanie beneficjentów powyżej 5% z zamiarem wpływania na emitenta (udziały aktywistów, kampanie zarządu, M&A). Każdy wiersz pokazuje najnowszy znany stan pozycji tego zgłaszającego.
| Zgłaszający | Złożono | Udział | Status | Cel | Zgłoszenie |
|---|---|---|---|---|---|
| U.S. Bancorp ×3 zgłoszenia | 9 stycznia 2003 | · | Pierwotne zgłoszenie | Inwestycja pasywna | SEC |
| Niezgłoszona osoba raportująca | 2 maja 2002 | · | Pierwotne zgłoszenie | · | SEC |
| Niezgłoszona osoba raportująca | 9 kwietnia 2002 | · | Pierwotne zgłoszenie | · | SEC |
| Niezgłoszona osoba raportująca | 28 listopada 2001 | · | Pierwotne zgłoszenie | · | SEC |
Purpose is an automated classification of the filer's own stated purpose (SEC Item 4) — not investment advice. "—" means no clear purpose was stated or the text could not be classified.
Insiderzy spółki 83 insiderów · 21 dyrektorzy generalni · 14 dyrektorzy
| Insider | Rola | Ostatnia aktywność | Posiadane akcje | Kupna 12m | Sprzedaże 12m | Netto 12m |
|---|---|---|---|---|---|---|
| Gunjan Kedia | President & CEO | 28 sierpnia 2026 M | 426 262 | 0 | 1 | $-1 700 643 |
| Kathleen A Rogers | Vice Chairman and CFO | 18 lutego 2016 A | 60 416 | 0 | 0 | $0 |
| David M Moffett | Vice Chairman and CFO | 17 stycznia 2007 A | 91 709 | 0 | 0 | $0 |
| James L Chosy | Senior EVP and General Counsel | 23 lipca 2026 M | 252 684 | 0 | 2 | $-2 714 371 |
| Stephen L Philipson | Vice Chair | 20 lipca 2026 S | 74 969 | 0 | 1 | $-2 328 030 |
| Richard B Payne JR | Vice Chairman | 18 lutego 2016 A | 126 139 | 0 | 0 | $0 |
| JOSEPH PAMELA A | Vice Chairman | 11 maja 2015 M | 218 999 | 0 | 0 | $0 |
| Joseph C Hoesley | Vice Chairman | 20 lutego 2015 M | 107 523 | 0 | 0 | $0 |
| Michael S. Lafontaine | EVP, Chief Oper. Risk Officer | 9 maja 2014 S | 20 259 | 0 | 0 | $0 |
| Howell D. Mccullough III | EVP and Chief Strategy Officer | 20 lutego 2014 A | 31 868 | 0 | 0 | $0 |
| Richard J Hidy | EVP and Chief Risk Officer | 13 listopada 2013 M | 68 051 | 0 | 0 | $0 |
| Richard C Hartnack | Vice Chairman | 16 lutego 2013 M | 148 943 | 0 | 0 | $0 |
| Lee R Mitau | EVP, General Counsel, and Sec. | 16 lutego 2013 M | 54 385 | 0 | 0 | $0 |
| Diane L Thormodsgard | Vice Chairman | 11 maja 2010 G | 45 527 | 0 | 0 | $0 |
| Joseph M Otting | Vice Chairman | 5 kwietnia 2010 F | 50 146 | 0 | 0 | $0 |
| William L Chenevich | Vice Chairman | 2 marca 2010 M | 76 324 | 0 | 0 | $0 |
| Michael J Doyle | EVP, Chief Credit Officer | 15 maja 2007 M | 33 061 | 0 | 0 | $0 |
| Dennis O Battles | Executive Vice President | 16 lutego 2006 F | 43 997 | 0 | 0 | $0 |
| Joseph E Hasten | Vice Chairman | 17 maja 2005 M | 117 613 | 0 | 0 | $0 |
| GRZEDZINSKI EDWARD | Vice Chairman | 3 listopada 2004 | · | 0 | 0 | $0 |
| Andrew S Duff | Vice Chairman | 31 grudnia 2003 J | 63 626 | 0 | 0 | $0 |
| Joel W Johnson | Dyrektor | 29 stycznia 2016 A | 13 568 | 0 | 0 | $0 |
| Patrick T Stokes | Dyrektor | 29 stycznia 2016 A | 17 122 | 0 | 0 | $0 |
| Jerry W Levin | Dyrektor | 22 stycznia 2015 A | 0 | 0 | 0 | $0 |
| Victoria Buyniski Gluckman | Dyrektor | 22 stycznia 2015 A | 594 | 0 | 0 | $0 |
| BELTON Y MARC | Dyrektor | 22 stycznia 2015 A | 10 400 | 0 | 0 | $0 |
| Richard G Reiten | Dyrektor | 19 stycznia 2012 A | 9 912 | 0 | 0 | $0 |
| Warren R Staley | Dyrektor | 16 stycznia 2008 A | · | 0 | 0 | $0 |
| Peter H Coors | Dyrektor | 16 stycznia 2008 A | 21 481 | 0 | 0 | $0 |
| Jerry A Grundhofer | Dyrektor | 23 października 2007 M | 449 304 | 0 | 0 | $0 |
| John J Stollenwerk | Dyrektor | 18 stycznia 2005 A | · | 0 | 0 | $0 |
| Delbert Winston Johnson | Dyrektor | 20 stycznia 2004 A | 34 384 | 0 | 0 | $0 |
| John F Grundhofer | Dyrektor | 20 stycznia 2004 A | 0 | 0 | 0 | $0 |
| John C Dannemiller | Dyrektor | 20 stycznia 2004 A | 15 700 | 0 | 0 | $0 |
| Venkatachari Dilip | · | 5 maja 2026 S | 51 292 | 0 | 1 | $-1 916 661 |
| Loretta E Reynolds | · | 23 kwietnia 2026 A | · | 0 | 0 | $0 |
| Kimberly N Ellison-Taylor | · | 23 kwietnia 2026 A | · | 0 | 0 | $0 |
| Dorothy J Bridges | · | 23 kwietnia 2026 A | · | 0 | 0 | $0 |
| Yusuf I Mehdi | · | 23 kwietnia 2026 A | · | 0 | 0 | $0 |
| Aleem Gillani | · | 23 kwietnia 2026 A | 15 000 | 0 | 0 | $0 |
| Alan B. Colberg | · | 23 kwietnia 2026 A | 10 050 | 0 | 0 | $0 |
| Elizabeth Buse | · | 23 kwietnia 2026 A | · | 0 | 0 | $0 |
| Richard P Mckenney | · | 23 kwietnia 2026 A | 20 000 | 0 | 0 | $0 |
| John Wiehoff | · | 23 kwietnia 2026 A | · | 0 | 0 | $0 |
| Roland A Hernandez | · | 23 kwietnia 2026 A | · | 0 | 0 | $0 |
| Warner L Baxter | · | 23 kwietnia 2026 A | · | 0 | 0 | $0 |
| Jodi L Richard | · | 21 kwietnia 2026 S | 207 251 | 0 | 1 | $-2 280 000 |
| Arijit Roy | · | 6 marca 2026 A | 47 412 | 0 | 0 | $0 |
| Courtney Kelso | · | 5 marca 2026 A | 25 354 | 0 | 0 | $0 |
| John C Stern | · | 5 marca 2026 A | 107 485 | 0 | 0 | $0 |
| Souheil Badran | · | 5 marca 2026 A | 100 798 | 0 | 0 | $0 |
| Elcio R.T. Barcelos | · | 5 marca 2026 A | 119 922 | 0 | 1 | $-1 005 230 |
| Lisa R Stark | · | 5 marca 2026 A | 53 166 | 0 | 0 | $0 |
| Mark G. Runkel | · | 5 marca 2026 A | 117 933 | 0 | 1 | $-1 952 627 |
| Andrew Cecere | · | 2 marca 2026 F | 1 404 824 | 0 | 1 | $-6 508 221 |
| Terrance R Dolan | · | 3 marca 2025 F | 243 507 | 0 | 0 | $0 |
| Scott W. Wine | · | 16 grudnia 2024 A | 30 438 | 0 | 0 | $0 |
| Shailesh M Kotwal | · | 17 października 2024 S | 136 076 | 0 | 0 | $0 |
| Kimberly J Harris | · | 18 kwietnia 2024 A | · | 0 | 0 | $0 |
| Timothy A Welsh | · | 5 marca 2024 F | 166 194 | 0 | 0 | $0 |
| Katherine B Quinn | · | 5 marca 2023 F | 142 338 | 0 | 0 | $0 |
| Jeffry H. Von Gillern | · | 5 marca 2023 F | 175 754 | 0 | 0 | $0 |
| Olivia F Kirtley | · | 16 grudnia 2022 A | 0 | 0 | 0 | $0 |
| Karen S Lynch | · | 17 grudnia 2021 A | · | 0 | 0 | $0 |
| Marc N Casper | · | 23 grudnia 2020 A | · | 0 | 0 | $0 |
| Leslie V Godridge | · | 19 lutego 2020 F | 41 776 | 0 | 0 | $0 |
| Derek J White | · | 14 lutego 2020 F | 39 363 | 0 | 0 | $0 |
| Ismat Aziz | · | 14 lutego 2020 F | 29 009 | 0 | 0 | $0 |
| Arthur D Collins JR | · | 27 grudnia 2019 A | 0 | 0 | 0 | $0 |
| David B Omaley | · | 13 września 2019 S | 191 754 | 0 | 0 | $0 |
| Odell M Owens | · | 1 lipca 2019 I | 0 | 0 | 0 | $0 |
| Doreen Woo Ho | · | 18 kwietnia 2019 A | 0 | 0 | 0 | $0 |
| Craig D Schnuck | · | 18 kwietnia 2019 A | 0 | 0 | 0 | $0 |
| John R. Elmore | · | 19 lutego 2019 F | 83 577 | 0 | 0 | $0 |
| Craig E Gifford | · | 19 lutego 2019 F | 57 845 | 0 | 0 | $0 |
| James B Kelligrew | · | 18 września 2018 G | 0 | 0 | 0 | $0 |
| P.W. Parker | · | 20 lutego 2018 M | 319 255 | 0 | 0 | $0 |
| Richard K Davis | · | 20 lutego 2018 F | 974 867 | 0 | 0 | $0 |
| Jennie P Carlson | · | 20 lutego 2018 F | 76 656 | 0 | 0 | $0 |
| Douglas M Baker JR | · | 18 stycznia 2018 A | 1 000 | 0 | 0 | $0 |
| Kent V. Stone | · | 20 lipca 2017 A | 102 639 | 0 | 0 | $0 |
| Thomas E Petry | · | 1 kwietnia 2005 I | 6 800 | 0 | 0 | $0 |
| Linda L Ahlers | · | 18 stycznia 2005 A | · | 0 | 0 | $0 |
Insiderzy z zgłoszeń SEC Form 3/4/5; netto = tylko otwarty rynek P/S
Posiadanie ETF-ów Posiadane przez 167 funduszy ETF
Waga odzwierciedla wyłącznie bezpośrednie udziały kapitałowe (N-PORT); fundusze oparte na dźwigni lub instrumentach pochodnych mogą posiadać dodatkowe ekspozycje na swapy, które nie są pokazane.
| Fundusz | Waga | Jednostki | Na dzień | Źródło |
|---|---|---|---|---|
| IAT · iShares Trust | 15,04% | 1 569 808 SH | 11 września 2026 | Dziennie |
| DFNL · Davis Fundamental ETF Trust | 6,33% | 481 931 NS | 31 lipca 2026 | N-PORT |
| DUSA · Davis Fundamental ETF Trust | 6,11% | 1 233 086 NS | 31 lipca 2026 | N-PORT |
| PAYR · Federated Hermes ETF Trust | 4,15% | 37 622 NS | 31 lipca 2026 | N-PORT |
| KBWB · Invesco Exchange-Traded Fund Trust … | 4,12% | 4 380 853 SH | 1 października 2026 | Dziennie |
| FDV · Federated Hermes ETF Trust | 3,80% | 530 469 NS | 31 lipca 2026 | N-PORT |
| PGF · Invesco Exchange-Traded Fund Trust | 3,09% | 1 143 487 | 1 października 2026 | Dziennie |
| VMAX · Lattice Strategies Trust | 2,08% | 16 245 NS | 31 lipca 2026 | N-PORT |
| SPDV · ETF Series Solutions | 2,03% | 42 421 NS | 31 lipca 2026 | N-PORT |
| NUDV · Nushares ETF Trust | 1,82% | 14 506 NS | 31 lipca 2026 | N-PORT |
| RDVI · First Trust Exchange-Traded Fund IV | 1,63% | 928 533 NS | 31 lipca 2026 | N-PORT |
| PGX · Invesco Exchange-Traded Fund Trust … | 1,54% | 3 369 352 | 1 października 2026 | Dziennie |
| FFLV · FIDELITY COVINGTON TRUST | 1,54% | 4 012 NS | 31 lipca 2026 | N-PORT |
| PEY · Invesco Exchange-Traded Fund Trust | 1,53% | 281 838 SH | 1 października 2026 | Dziennie |
| IYF · iShares Trust | 1,48% | 1 037 411 SH | 11 września 2026 | Dziennie |
| VRP · Invesco Exchange-Traded Fund Trust … | 1,47% | 33 765 803 | 1 października 2026 | Dziennie |
| PWV · Invesco Exchange-Traded Fund Trust | 1,43% | 444 318 SH | 1 października 2026 | Dziennie |
| FDVV · FIDELITY COVINGTON TRUST | 1,42% | 2 290 318 NS | 31 lipca 2026 | N-PORT |
| DWLD · Davis Fundamental ETF Trust | 1,42% | 137 724 NS | 31 lipca 2026 | N-PORT |
| DVY · iShares Trust | 1,37% | 5 158 772 SH | 11 września 2026 | Dziennie |
| IMCV · iShares Trust | 1,36% | 253 110 SH | 11 września 2026 | Dziennie |
| IYG · iShares Trust | 1,34% | 470 793 SH | 11 września 2026 | Dziennie |
| RSPF · Invesco Exchange-Traded Fund Trust | 1,32% | 83 788 SH | 1 października 2026 | Dziennie |
| PFF · iShares Trust | 1,28% | 8 051 037 SH | 11 września 2026 | Dziennie |
| SPVM · Invesco Exchange-Traded Fund Trust | 1,20% | 26 901 SH | 1 października 2026 | Dziennie |
| VFH · VANGUARD WORLD FUND | 1,10% | 2 528 501 SH | 19 sierpnia 2026 | Dziennie |
| FNCL · FIDELITY COVINGTON TRUST | 1,08% | 407 682 NS | 31 lipca 2026 | N-PORT |
| NULC · Nushares ETF Trust | 0,99% | 11 070 NS | 31 lipca 2026 | N-PORT |
| REVS · Columbia ETF Trust I | 0,97% | 51 550 NS | 31 lipca 2026 | N-PORT |
| EQWL · Invesco Exchange-Traded Fund Trust | 0,96% | 453 552 SH | 1 października 2026 | Dziennie |
| FBCV · FIDELITY COVINGTON TRUST | 0,87% | 24 424 NS | 31 lipca 2026 | N-PORT |
| SPLV · Invesco Exchange-Traded Fund Trust … | 0,85% | 1 011 816 SH | 1 października 2026 | Dziennie |
| JGLO · J.P. Morgan Exchange-Traded Fund Tr… | 0,83% | 877 822 NS | 31 lipca 2026 | N-PORT |
| FAS · Direxion Shares ETF Trust | 0,82% | 305 879 NS | 31 lipca 2026 | N-PORT |
| VFVA · VANGUARD WELLINGTON FUND | 0,73% | 102 592 SH | 19 sierpnia 2026 | Dziennie |
| GSY · Invesco Actively Managed Exchange-T… | 0,71% | 27 000 000 | 1 października 2026 | Dziennie |
| QDEF · FlexShares Trust | 0,70% | 61 008 NS | 31 lipca 2026 | N-PORT |
| QDF · FlexShares Trust | 0,69% | 243 273 NS | 31 lipca 2026 | N-PORT |
| IMCB · iShares Trust | 0,68% | 182 234 SH | 11 września 2026 | Dziennie |
| FTLS · First Trust Exchange-Traded Fund III | 0,65% | 258 548 NS | 31 lipca 2026 | N-PORT |
| FDMO · FIDELITY COVINGTON TRUST | 0,64% | 91 400 NS | 31 lipca 2026 | N-PORT |
| IIGD · Invesco Exchange-Traded Self-Indexe… | 0,63% | 192 000 | 30 września 2026 | Dziennie |
| FXO · First Trust Exchange-Traded AlphaDE… | 0,63% | 112 132 NS | 31 lipca 2026 | N-PORT |
| IXG · iShares Trust | 0,61% | 67 605 SH | 11 września 2026 | Dziennie |
| FTA · First Trust Exchange-Traded AlphaDE… | 0,52% | 116 279 NS | 31 lipca 2026 | N-PORT |
| RPV · Invesco Exchange-Traded Fund Trust | 0,51% | 143 824 SH | 1 października 2026 | Dziennie |
| VLUE · iShares Trust | 0,51% | 787 518 SH | 11 września 2026 | Dziennie |
| NULV · Nushares ETF Trust | 0,50% | 173 490 NS | 31 lipca 2026 | N-PORT |
| RECS · Columbia ETF Trust I | 0,49% | 455 073 NS | 31 lipca 2026 | N-PORT |
| FBUF · Fidelity Greenwood Street Trust | 0,48% | 1 824 NS | 31 lipca 2026 | N-PORT |
| EVUS · iShares Trust | 0,47% | 28 763 SH | 11 września 2026 | Dziennie |
| HELO · J.P. Morgan Exchange-Traded Fund Tr… | 0,47% | 345 271 NS | 31 lipca 2026 | N-PORT |
| VRIG · Invesco Actively Managed Exchange-T… | 0,46% | 8 600 000 | 1 października 2026 | Dziennie |
| DFLV · Dimensional ETF Trust | 0,46% | 493 892 NS | 31 lipca 2026 | N-PORT |
| SPMO · Invesco Exchange-Traded Fund Trust … | 0,45% | 1 797 957 SH | 1 października 2026 | Dziennie |
| JDIV · J.P. Morgan Exchange-Traded Fund Tr… | 0,45% | 912 NS | 31 lipca 2026 | N-PORT |
| MGV · VANGUARD WORLD FUND | 0,44% | 975 674 SH | 19 sierpnia 2026 | Dziennie |
| PFIG · Invesco Exchange-Traded Fund Trust … | 0,43% | 632 000 | 1 października 2026 | Dziennie |
| JVAL · J.P. Morgan Exchange-Traded Fund Tr… | 0,41% | 54 513 NS | 31 lipca 2026 | N-PORT |
| USXF · iShares Trust | 0,39% | 92 543 SH | 11 września 2026 | Dziennie |
| VYM · VANGUARD WHITEHALL FUNDS | 0,39% | 6 212 830 SH | 19 sierpnia 2026 | Dziennie |
| SUSA · iShares Trust | 0,38% | 246 844 SH | 11 września 2026 | Dziennie |
| QLC · FlexShares Trust | 0,38% | 60 928 NS | 31 lipca 2026 | N-PORT |
| DFUV · Dimensional ETF Trust | 0,37% | 909 307 NS | 31 lipca 2026 | N-PORT |
| FHEQ · Fidelity Greenwood Street Trust | 0,37% | 53 889 NS | 31 lipca 2026 | N-PORT |
| IWX · iShares Trust | 0,36% | 225 005 SH | 11 września 2026 | Dziennie |
| VTV · VANGUARD INDEX FUNDS | 0,35% | 14 756 505 SH | 19 sierpnia 2026 | Dziennie |
| PFM · Invesco Exchange-Traded Fund Trust | 0,33% | 44 215 SH | 1 października 2026 | Dziennie |
| DIVB · iShares Trust | 0,33% | 106 811 SH | 11 września 2026 | Dziennie |
| IVE · iShares Trust | 0,33% | 2 579 193 SH | 11 września 2026 | Dziennie |
| VOOV · VANGUARD ADMIRAL FUNDS | 0,32% | 357 541 SH | 19 sierpnia 2026 | Dziennie |
| JPUS · J.P. Morgan Exchange-Traded Fund Tr… | 0,32% | 22 967 NS | 31 lipca 2026 | N-PORT |
| IUSV · iShares Trust | 0,31% | 1 359 785 SH | 11 września 2026 | Dziennie |
| BSCR · Invesco Exchange-Traded Self-Indexe… | 0,30% | 13 646 000 | 1 października 2026 | Dziennie |
| BSCU · Invesco Exchange-Traded Self-Indexe… | 0,29% | 9 288 000 | 1 października 2026 | Dziennie |
| IQSU · New York Life Investments ETF Trust | 0,29% | 15 068 NS | 31 lipca 2026 | N-PORT |
| SUSL · iShares Trust | 0,29% | 54 977 SH | 11 września 2026 | Dziennie |
| ESG · FlexShares Trust | 0,28% | 5 940 NS | 31 lipca 2026 | N-PORT |
| ILCV · iShares Trust | 0,28% | 60 604 SH | 11 września 2026 | Dziennie |
| FEX · First Trust Exchange-Traded AlphaDE… | 0,28% | 69 987 NS | 31 lipca 2026 | N-PORT |
| VFMO · VANGUARD WELLINGTON FUND | 0,28% | 93 617 SH | 19 sierpnia 2026 | Dziennie |
| ACVF · ETF Opportunities Trust | 0,27% | 6 630 NS | 31 lipca 2026 | N-PORT |
| FAB · First Trust Exchange-Traded AlphaDE… | 0,26% | 7 022 NS | 31 lipca 2026 | N-PORT |
| IWD · iShares Trust | 0,26% | 3 458 340 SH | 11 września 2026 | Dziennie |
| VONV · VANGUARD SCOTTSDALE FUNDS | 0,26% | 939 443 SH | 19 sierpnia 2026 | Dziennie |
| PRF · Invesco Exchange-Traded Fund Trust | 0,24% | 410 103 SH | 1 października 2026 | Dziennie |
| EGLE · Global X Funds | 0,23% | 79 NS | 31 lipca 2026 | N-PORT |
| ESGU · iShares Trust | 0,22% | 620 026 SH | 11 września 2026 | Dziennie |
| SIZE · iShares Trust | 0,21% | 14 652 SH | 11 września 2026 | Dziennie |
| DYNF · BlackRock ETF Trust | 0,21% | 1 416 340 SH | 11 września 2026 | Dziennie |
| RWL · Invesco Exchange-Traded Fund Trust … | 0,21% | 349 243 SH | 1 października 2026 | Dziennie |
| OEF · iShares Trust | 0,20% | 657 104 SH | 11 września 2026 | Dziennie |
| EUSA · iShares, Inc. | 0,20% | 62 115 SH | 11 września 2026 | Dziennie |
| VFMV · VANGUARD WELLINGTON FUND | 0,20% | 13 667 SH | 19 sierpnia 2026 | Dziennie |
| BSCS · Invesco Exchange-Traded Self-Indexe… | 0,20% | 6 886 000 | 1 października 2026 | Dziennie |
| RSP · Invesco Exchange-Traded Fund Trust | 0,19% | 3 149 414 SH | 1 października 2026 | Dziennie |
| MGC · VANGUARD WORLD FUND | 0,18% | 309 897 SH | 19 sierpnia 2026 | Dziennie |
| TOPC · iShares Trust | 0,18% | 945 SH | 11 września 2026 | Dziennie |
| CATH · Global X Funds | 0,17% | 35 741 NS | 31 lipca 2026 | N-PORT |
| IWL · iShares Trust | 0,17% | 60 303 SH | 11 września 2026 | Dziennie |
| XVV · iShares Trust | 0,17% | 17 893 SH | 11 września 2026 | Dziennie |
| ESGV · VANGUARD WORLD FUND | 0,16% | 351 863 SH | 19 sierpnia 2026 | Dziennie |
| QVML · Invesco Exchange-Traded Fund Trust … | 0,16% | 45 550 SH | 1 października 2026 | Dziennie |
| CHRI · Global X Funds | 0,16% | 201 NS | 31 lipca 2026 | N-PORT |
| XTR · Global X Funds | 0,16% | 119 NS | 31 lipca 2026 | N-PORT |
| GTOS · Invesco Actively Managed Exchange-T… | 0,16% | 181 000 | 1 października 2026 | Dziennie |
| ROUS · Lattice Strategies Trust | 0,15% | 17 222 NS | 31 lipca 2026 | N-PORT |
| BBUS · J.P. Morgan Exchange-Traded Fund Tr… | 0,15% | 214 346 NS | 31 lipca 2026 | N-PORT |
| PTLC · Pacer Funds Trust | 0,15% | 78 628 NS | 31 lipca 2026 | N-PORT |
| XYLD · Global X Funds | 0,15% | 78 033 NS | 31 lipca 2026 | N-PORT |
| XRMI · Global X Funds | 0,15% | 1 201 NS | 31 lipca 2026 | N-PORT |
| VOTE · TCW ETF Trust | 0,15% | 26 291 NS | 31 lipca 2026 | N-PORT |
| XCLR · Global X Funds | 0,15% | 85 NS | 31 lipca 2026 | N-PORT |
| VOO · VANGUARD INDEX FUNDS | 0,15% | 40 321 571 SH | 19 sierpnia 2026 | Dziennie |
| VV · VANGUARD INDEX FUNDS | 0,15% | 1 812 934 SH | 19 sierpnia 2026 | Dziennie |
| XYLG · Global X Funds | 0,15% | 1 509 NS | 31 lipca 2026 | N-PORT |
| IVV · iShares Trust | 0,15% | 19 566 038 SH | 11 września 2026 | Dziennie |
| DCOR · Dimensional ETF Trust | 0,15% | 78 043 NS | 31 lipca 2026 | N-PORT |
| BKLC · BNY Mellon ETF Trust | 0,15% | 127 503 NS | 31 lipca 2026 | N-PORT |
| ILCB · iShares Trust | 0,15% | 30 269 SH | 11 września 2026 | Dziennie |
| VOXP · Advisors Series Trust | 0,14% | 132 NS | 31 lipca 2026 | N-PORT |
| DFUS · Dimensional ETF Trust | 0,14% | 471 479 NS | 31 lipca 2026 | N-PORT |
| VONE · VANGUARD SCOTTSDALE FUNDS | 0,14% | 258 237 SH | 19 sierpnia 2026 | Dziennie |
| TOV · EA Series Trust | 0,14% | 5 899 NS | 31 lipca 2026 | N-PORT |
| SPUU · Direxion Shares ETF Trust | 0,14% | 5 857 NS | 31 lipca 2026 | N-PORT |
| PBP · Invesco Exchange-Traded Fund Trust | 0,14% | 9 269 SH | 1 października 2026 | Dziennie |
| IWB · iShares Trust | 0,14% | 1 078 178 SH | 11 września 2026 | Dziennie |
| QDPL · Pacer Funds Trust | 0,14% | 37 382 NS | 31 lipca 2026 | N-PORT |
| IYY · iShares Trust | 0,14% | 66 364 SH | 11 września 2026 | Dziennie |
| PBUS · Invesco Exchange-Traded Fund Trust … | 0,14% | 269 083 SH | 1 października 2026 | Dziennie |
| DFAU · Dimensional ETF Trust | 0,14% | 271 246 NS | 31 lipca 2026 | N-PORT |
| IWV · iShares Trust | 0,13% | 430 827 SH | 11 września 2026 | Dziennie |
| ITOT · iShares Trust | 0,13% | 2 020 960 SH | 11 września 2026 | Dziennie |
| VTI · VANGUARD INDEX FUNDS | 0,13% | 49 278 050 SH | 19 sierpnia 2026 | Dziennie |
| VTHR · VANGUARD SCOTTSDALE FUNDS | 0,13% | 130 908 SH | 19 sierpnia 2026 | Dziennie |
| LGDX · Tidal Trust III | 0,13% | 2 842 NS | 31 lipca 2026 | N-PORT |
| TILT · FlexShares Trust | 0,13% | 43 450 NS | 31 lipca 2026 | N-PORT |
| HCMT · Direxion Shares ETF Trust | 0,12% | 10 803 NS | 31 lipca 2026 | N-PORT |
| DFAC · Dimensional ETF Trust | 0,12% | 912 704 NS | 31 lipca 2026 | N-PORT |
| PHDG · Invesco Actively Managed Exchange-T… | 0,12% | 1 231 SH | 1 października 2026 | Dziennie |
| SPXL · Direxion Shares ETF Trust | 0,11% | 121 355 NS | 31 lipca 2026 | N-PORT |
| TOK · iShares Trust | 0,11% | 4 269 SH | 11 września 2026 | Dziennie |
| URTH · iShares, Inc. | 0,11% | 139 316 SH | 11 września 2026 | Dziennie |
| JFLI · J.P. Morgan Exchange-Traded Fund Tr… | 0,10% | 768 NS | 31 lipca 2026 | N-PORT |
| ACWI · iShares Trust | 0,09% | 485 385 SH | 11 września 2026 | Dziennie |
| USCL · iShares Trust | 0,09% | 41 171 SH | 11 września 2026 | Dziennie |
| CRBN · iShares Trust | 0,09% | 16 977 SH | 11 września 2026 | Dziennie |
| DFSU · Dimensional ETF Trust | 0,09% | 32 245 NS | 31 lipca 2026 | N-PORT |
| VT · VANGUARD INTERNATIONAL EQUITY INDEX… | 0,08% | 1 274 120 SH | 19 sierpnia 2026 | Dziennie |
| DXUV · Dimensional ETF Trust | 0,07% | 6 439 NS | 31 lipca 2026 | N-PORT |
| EQAL · Invesco Exchange-Traded Fund Trust … | 0,06% | 8 429 SH | 1 października 2026 | Dziennie |
| HDUS · Lattice Strategies Trust | 0,06% | 1 878 NS | 31 lipca 2026 | N-PORT |
| GTO · Invesco Actively Managed Exchange-T… | 0,04% | 1 224 000 | 1 października 2026 | Dziennie |
| NEAR · iShares U.S. ETF Trust | 0,01% | 355 000 SH | 9 września 2026 | Dziennie |
| BIV · VANGUARD BOND INDEX FUNDS | · | · | 15 lipca 2026 | Dziennie |
| BSV · VANGUARD BOND INDEX FUNDS | · | · | 15 lipca 2026 | Dziennie |
| BND · VANGUARD BOND INDEX FUNDS | · | · | 15 lipca 2026 | Dziennie |
| VUSB · VANGUARD BOND INDEX FUNDS | · | · | 15 lipca 2026 | Dziennie |
| VCRB · VANGUARD MALVERN FUNDS | · | · | 15 lipca 2026 | Dziennie |
| VPLS · VANGUARD MALVERN FUNDS | · | · | 15 lipca 2026 | Dziennie |
| VSDB · VANGUARD MALVERN FUNDS | · | · | 15 lipca 2026 | Dziennie |
| VGMS · VANGUARD MALVERN FUNDS | · | · | 15 lipca 2026 | Dziennie |
| VCSH · VANGUARD SCOTTSDALE FUNDS | · | · | 15 lipca 2026 | Dziennie |
| VCIT · VANGUARD SCOTTSDALE FUNDS | · | · | 15 lipca 2026 | Dziennie |
| VTC · VANGUARD SCOTTSDALE FUNDS | · | · | 30 lipca 2026 | Dziennie |
| BNDW · VANGUARD SCOTTSDALE FUNDS | · | · | 30 lipca 2026 | Dziennie |
| VCEB · VANGUARD WORLD FUND | · | · | 30 lipca 2026 | Dziennie |
USB Konsensus analityków Bycze i niedźwiedzie opinie analityków, 12-miesięczny cel cenowy, potencjał wzrostu
12-miesięczny cel cenowy
21 analityków · 2026-09-30Średnia cel $70.43 +22,5%
Porównanie z porównywalnymi firmami (podbranża GICS) Kluczowe metryki w porównaniu do konkurentów z sektora
Podstawa R/R, ceny według zamknięcia z ostatniego końca roku obrotowego każdej spółki.
| Ticker | Kapitalizacja Rynkowa | P/E | Przychody r/r | Marża Netto | ROE | Marża brutto |
|---|---|---|---|---|---|---|
| USB | $85.38B | 11.5 | 4.4% | 26.4% | 12.2% | · |
| JPM | $868.77B | 16.1 | 2.8% | 31.3% | 16.1% | · |
| BAC | $396.69B | 14.4 | 6.8% | 27.0% | 10.1% | · |
| WFC | $288.23B | 14.9 | 1.7% | 25.5% | 11.8% | · |
| C | · | 16.7 | 5.6% | 16.8% | 6.8% | · |
| PNC | $81.40B | 12.6 | 7.2% | 30.3% | 12.2% | · |
| FITB | · | · | · | · | · | · |
| FCNCA | · | · | · | · | · | · |
| KEY | $22.75B | 13.6 | 62.6% | 24.3% | 9.2% | · |
| FRBT | · | · | · | · | · | · |
Najnowsze wiadomości Najnowsze nagłówki wspominające o tej firmie
Moje wskaźniki Twoja osobista lista obserwowanych — wybrane wiersze z Pełnych Fundamentów
Wybierz wskaźniki, które są dla Ciebie ważne — kliknij + obok dowolnego wiersza w sekcji Pełne dane fundamentalne powyżej.
Twój wybór został zapisany i będzie Ci towarzyszył we wszystkich tickerach.