T AT&T Inc.
About AT&T Inc. Company overview from Wikipedia
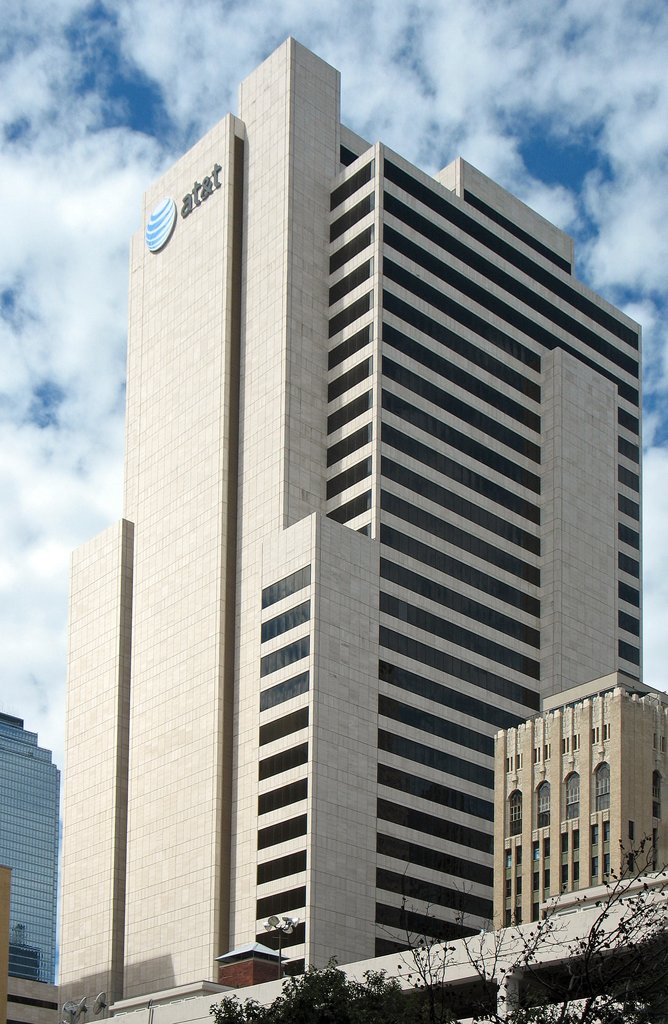
AT&T Inc., an abbreviation of its predecessor's original name, the American Telephone and Telegraph Company, is an American multinational telecommunications company headquartered at the Whitacre Tower in Downtown Dallas, Texas. AT&T is the world's third-largest telecommunications company by revenue, the third-largest wireless carrier in the United States behind T-Mobile and Verizon, and the nation's largest fiber internet provider. On the New York Stock Exchange, AT&T trades under the ticker symbol "T", and has a market capitalization of $186.83 billion. On the Fortune 500 (2025), AT&T ranked 37th among the largest American businesses and reported revenues of $125.6 billion.
Read more
AT&T Inc., an abbreviation of its predecessor's original name, the American Telephone and Telegraph Company, is an American multinational telecommunications company headquartered at the Whitacre Tower in Downtown Dallas, Texas. AT&T is the world's third-largest telecommunications company by revenue, the third-largest wireless carrier in the United States behind T-Mobile and Verizon, and the nation's largest fiber internet provider. On the New York Stock Exchange, AT&T trades under the ticker symbol "T", and has a market capitalization of $186.83 billion. On the Fortune 500 (2025), AT&T ranked 37th among the largest American businesses and reported revenues of $125.6 billion.
AT&T has over 240 million subscribers worldwide, and its operations are split into two main segments: Communications, which offers wireless services, broadband options, and business solutions, along with Latin America, which provides wireless networking in Mexico. Even after spinning off DirecTV, AT&T still offers bundling deals with it. While AT&T traces its history to the original company founded in 1885, the modern version began on January 1, 1984, as Southwestern Bell Corporation (SBC Communications) after the Bell System breakup. The original AT&T was created by American Bell Telephone on March 5, 1885, as a long-distance subsidiary, and later merged with its corporate parent in 1889. Over time, AT&T developed a natural monopoly in telephony, dominating telecommunications for much of the 20th century and earning the nickname "Ma Bell".
The U.S. Department of Justice filed an antitrust lawsuit against AT&T under the Sherman Antitrust Act, arguing it held unfair advantages over other telecom companies through the Bell System. Despite fighting the case, AT&T settled in 1982 to break up the Bell System into seven independent companies. AT&T was allowed to retain its long-lines and technology divisions and ventured into new industries. SBC, which originated from ADT Inc., was the smallest "Baby Bell" and grew by acquiring Pacific Telesis and Ameritech. AT&T later spun off Lucent Technologies along with its wireless and broadband units, leading to an uncertain future. In 2005, SBC Communications bought AT&T Corporation and adopted its branding to become the modern AT&T.
Since reforming, AT&T bought BellSouth, reuniting four of the seven Baby Bells and taking control of Cingular Wireless (now AT&T Mobility). AT&T also shifted toward content distribution by launching U-verse TV, acquiring DirecTV, and expanding into entertainment with the purchase of Time Warner. These moves were intended to transform AT&T into a vertically integrated media-telecom giant, but lackluster synergies led to DirecTV being sold to TPG Inc., and WarnerMedia merging with Discovery, Inc. to form Warner Bros. Discovery. Today, AT&T is focusing its efforts on 5G connectivity and fiber networks.
Historical overview
Origin and growth (1877–1981)
After patenting the telephone on March 7, 1876, Alexander Graham Bell and his associates co-founded the Bell Telephone Company on July 9, 1877, with members like Thomas A. Watson, Gardiner Greene Hubbard and Thomas A. Sanders. Although Bell was viewed as the company's founder, he lost interest in telephony by the 1890s and sold off his stock holdings. Bell Telephone focused on building local telephone exchanges and oversaw the first commercial exchange in New Haven, Connecticut. Bell Telephone expanded quickly, and over 700 telephones were in use across the country by 1877. An early rival was Western Union, then the leading telegraph company, which also owned Western Electric, a major equipment manufacturer. In 1880, construction began on what would eventually become AT&T Long Lines. Bell acquired Western Electric in 1881 and established the American Telephone and Telegraph Company on March 3, 1885.
Theodore Newton Vail served as the company's first President but stepped down after a few years. When Alexander Graham Bell's telephone patent expired, more than 6,000 telephony companies emerged, resulting in a major downturn for Bell Telephone. On December 30, 1899, American Bell transferred its subsidiaries to AT&T, giving the long-distance company control over Western Electric, Bell Laboratories, Western Union, the Bell System, and the international holdings of Northern Electric, IBT, and Bell Canada. AT&T controlled over 80% of the U.S. telephone system market by 1907 and Theodore Newton Vail rejoined the company as its President. Vail negotiated with competitors, charging them fees for connecting to AT&T's long-distance network. These practices led the Justice Department to attempt to break up AT&T, but a settlement was reached through the Kingsbury Commitment on December 13, 1913. It brought federal oversight into AT&T and led its Bell System monopoly to become federally regulated.
In 1921, AT&T served over 64% of the nearly 14 million U.S. telephones, and its dominance continued into the 1930s, with its market share reaching 83% of all U.S. telephones, 98% of long-distance lines, and 90% of equipment manufacturing. Through this, AT&T became a natural monopoly, with each of its subsidiaries giving it an unrivaled position in telecommunications. Federal oversight sustained AT&T's monopoly through the Great Depression, World War II, and the postwar era, but following the 1974 modification of the final judgment, the DOJ filed an antitrust lawsuit against AT&T. The case, United States of America v. American Telephone & Telegraph Co., et al., lasted for nearly eight years until AT&T settled in 1982 in exchange for divesting the Bell System monopoly. The Bell System was separated into seven independently operated telecom companies on January 1, 1984.
Breakup and restructuring (1982–2004)
In 1982, U.S. regulators broke up the AT&T monopoly, requiring AT&T to divest its local subsidiaries, which it did by grouping them into seven individual companies. These new companies were known as Regional Bell Operating Companies, or more informally, Baby Bells. Southwestern Bell Corporation (SBC) was one of the companies created by the breakup of AT&T Corp. (later renamed SBC Communications Inc.).
AT&T continued to operate long-distance services but faced increasing competition from competitors such as MCI and Sprint.
AT&T soon started a series of acquisitions, including the 1987 acquisition of Metromedia's mobile business and the acquisition of several cable companies in the early 1990s. Meanwhile, in the latter half of the 1990s, SBC acquired several other telecommunications companies, including two Baby Bells (Pacific Telesis Group and Ameritech Corporation), while selling its cable business. In early 1997, C. Michael Armstrong was named CEO, and Armstrong appointed John Zeglis as president later that year. By 1998, the company was in the top 15 of the Fortune 500, and by 1999, when Zeglis assumed the positions of chairman and CEO of AT&T Wireless, AT&T was part of the Dow Jones Industrial Average (lasting through 2015). Zeglis ended his service as president of AT&T in 2001 and resigned from his positions at AT&T Wireless in 2004.
Rebranding and major acquisitions (2005–2013)
On November 18, 2005, SBC Communications purchased its former parent, AT&T Corporation, for $16 billion. After this purchase, SBC adopted the better-known AT&T name and brand, with the original AT&T Corporation still existing as the long-distance landline subsidiary of the merged company. The current AT&T Inc. claims the original AT&T Corporation's history (dating to 1877) as its own, but retains SBC's pre-2005 corporate structure and stock price history. As well, all SEC filings before 2005 are under SBC, not AT&T.
AT&T made an attempt in 2011 to purchase T-Mobile for a $39 billion stock and cash offer. The bid was withdrawn after the takeover company faced significant regulatory and legal hurdles, along with heavy resistance from the U.S. government. Per the original acquisition agreement, T-Mobile received $3 billion in cash as well as access to $1 billion worth of AT&T-held wireless spectrum.
In September 2013, AT&T announced it would expand into Latin America through a collaboration with América Móvil. In December 2013, AT&T announced plans to sell its Connecticut wireline operations to Stamford-based Frontier Communications. AT&T acquired BellSouth Corporation on December 29, 2006, following FCC approval. The transaction consolidated ownership and management of Cingular Wireless. AT&T rebranded its wireless retail stores from Cingular to AT&T in January 2007.
Recent developments (2013–present)
Media pivot and divestiture
In late 2014, AT&T purchased Mexican cellular carrier Iusacell, and two months later, it purchased the Mexican wireless business of NII Holdings. AT&T merged the two companies to create AT&T Mexico. In July 2015, AT&T purchased DirecTV for $48.5 billion. AT&T then announced plans to converge its existing U-verse home internet and IPTV brands with DirecTV, to create AT&T Entertainment.
On October 22, 2016, AT&T announced a deal to buy Time Warner for $108.7 billion in an effort to increase its media holdings. On November 20, 2017, Assistant Attorney General Makan Delrahim filed a lawsuit for the United States Department of Justice Antitrust Division to block the merger with Time Warner, stating it "will harm competition, result in higher bills for consumers and less innovation." On June 12, 2018, U.S. District Court Judge Richard J. Leon ruled that the merger could go forward. The merger closed two days afterwards, with Time Warner becoming a wholly owned subsidiary of AT&T. A day later, the company was renamed WarnerMedia. Three months after completing the acquisition, AT&T reorganized into four main units: Communications, including consumer and business wireline telephony, AT&T Mobility, and consumer entertainment video services; WarnerMedia, including Turner cable television networks, Warner Bros. film and television production, and HBO; AT&T Latin America, consisting of wireless service in Mexico and video in Latin America and the Caribbean under the Vrio brand; and Advertising and Analytics, since renamed Xandr.
On July 13, 2017, it was reported that AT&T would introduce a cloud-based DVR streaming service. It hoped to create a unified platform across DirecTV and its DirecTV Now streaming service, with U-verse to be added shortly afterward. The service, named HBO Max, launched in May 2020. On September 12, 2017, it was reported that AT&T planned to launch a new cable TV-like service for delivery over-the-top over its own or a competitor's broadband network sometime the following year. On March 7, 2018, the company prepared to sell a minority stake of DirecTV Latin America through an IPO, creating a new holding company for those assets named Vrio Corp. On April 18, just a day before the public debut of Vrio, AT&T canceled the IPO due to market conditions.
As of 2019, AT&T was the world's largest telecommunications company. AT&T is also the largest provider of mobile telephone services and the largest provider of fixed telephone (landline) services in the United States. In September 2019, activist investor Elliott Management revealed that it had purchased $3.2 billion of AT&T stock (a 1.2% equity interest), and had pushed for the company to divest assets to improve its share value. On March 4, 2020, AT&T announced its intent to perform major cost-cutting moves, including cuts to capital investment, and plans to promote AT&T TV (which officially launched nationally on March 2) as its primary pay television service offering. AT&T stated it would still primarily promote DirecTV "where cable broadband is not prevalent", and as a specialty option. On April 24, 2020, AT&T announced that effective July 1, 2020, company COO John Stankey would replace Randall L. Stephenson as CEO of AT&T. It was also acknowledged that AT&T's acquisitions of DirecTV and Time Warner had by this point resulted in a massive debt burden of $200 billion for the company.
As a result of planned cost cutting programs, the sale of Warner Bros. Interactive Entertainment was proposed, but ultimately abandoned due to COVID-19 pandemic-related growth in the video gaming industry, as well as a positive reception to upcoming DC Comics, Lego Star Wars, and Harry Potter titles from fans and critics.
Crunchyroll was sold to Sony's Funimation for US$1.175 billion in December 2020, with the acquisition closing in August 2021. On February 25, 2021, AT&T announced that it would spin off DirecTV, U-Verse TV, and DirecTV Stream into a separate entity, selling a 30% stake to TPG Capital (owners of Astound Broadband cable), while retaining a 70% stake in the new standalone company. The deal was closed on August 2, 2021. On May 17, 2021, AT&T announced plans to relinquish its equity interest in WarnerMedia, and have it merge with Discovery, Inc. in a US$43 billion deal to establish a new media company. Electronic Arts, which was a bidder in the proposed sale of Warner Bros. Interactive Entertainment, purchased the mobile gaming studio Playdemic from WBIE for US$1.4 billion in June 2021. In September 2021, Fox Corporation acquired TMZ from WarnerMedia in a deal worth about $50 million with TMZ being operated under the Fox Entertainment division.
On December 21, 2021, AT&T announced that they had agreed to sell Xandr (and AppNexus) to Microsoft for an undisclosed price. The deal was completed in June 2022. On April 8, 2022, the spinoff of WarnerMedia and its subsequent merger with Discovery, Inc. to form Warner Bros. Discovery was completed. As a result of this merger, HBO Max and other video services were dropped from AT&T's unlimited plan offering. On May 21, 2025, AT&T announced an agreement to purchase Lumen Technologies' mass-market fiber business, extending AT&T's terrestrial broadband connectivity footprint across additional states in the US. The transaction excludes Lumen's legacy copper-based consumer telephone network which is slated to be retired in the upcoming years. The transaction closed on February 2, 2026. On July 2, 2025, AT&T and TPG Capital closed the sale of the remaining 70% stake in DirecTV.
On September 12, 2025, AT&T announced its partnership with Gigs to enable more U.S. tech companies like Klarna or Walmart's OnePay to launch their own mobile services.
2024 Snowflake data breach
In 2024, AT&T was one of several clients of Snowflake Inc. that had data stolen as part of the mass 2024 Snowflake data breach. Phone and text logs from May 1, 2022 to October 31, 2022 of "nearly all" AT&T customers were exposed as part of the breach. This hack is the first cyber incident in which the Justice Department has asked a company to delay filing a disclosure with the SEC because of potential national security or public safety concerns.
AT&T was also reported to have been affected by a 2024 attack from the Salt Typhoon advanced persistent threat linked to the Chinese government.
Company structure
AT&T Communications: AT&T Communications is the principal segment of AT&T and has more than 100 million American customers.
Facilities and regions
AT&T’s global headquarters has been at Whitacre Tower in Dallas, Texas since 2008. In January 2026, the company announced it would be moving its headquarters from Dallas to a 54-acre (22 ha) campus in Plano, Texas. The move is expected to begin in late 2028.
AT&T Inc. previously relocated its corporate headquarters to San Antonio from St. Louis, Missouri, in 1992, when it was named Southwestern Bell Corporation. The company's Telecom Operations group, which serves residential and regional business customers in 22 U.S. states, remains in San Antonio. Atlanta, Georgia, continues to be the headquarters for AT&T Mobility, with significant offices in Redmond and Bothell, Washington. Bedminster, New Jersey, is the headquarters for the company's Global Business Services group and AT&T Labs. St. Louis continues as home to the company's Directory operations, AT&T Advertising Solutions.
AT&T also offers services in many locations throughout the Asia Pacific; its regional headquarters is located in Hong Kong. The company is also active in Mexico, where it completed acquisitions of Iusacell and Nextel Mexico to form AT&T Mexico.
Board of directors
As of February 2026, AT&T's board of directors consists of the following members:
Executive management
John Stankey – Chief executive officer
Thaddeus Arroyo – Chief Strategy and Development Officer
Pascal Desroches – Senior Executive Vice President & Chief financial officer
Ed Gillespie – Senior Executive Vice President – External and Legislative Affairs
Kellyn Smith Kenny – Chief Marketing & Growth Officer
Lori Lee – CEO – AT&T Latin America & Global Marketing Officer
Jeremy Legg – Chief Technology Officer, AT&T Services, Inc.
David R. McAtee II – Senior Executive Vice President and General counsel
Jeff McElfresh – Chief operating officer
Landline operating companies
Of the eight companies that were part of the breakup of the Bell System, the following five are part of the current AT&T:
Ameritech, acquired by SBC in 1999
AT&T Corp., acquired by SBC in 2005
BellSouth, acquired by AT&T in 2006
Pacific Telesis, acquired by SBC in 1997
Southwestern Bell, rebranded as SBC Communications in 1995
In addition, in May 2025, AT&T announced the purchase of Lumen Technologies' mass-market fiber connectivity business which brought former Baby Bell US West's territory into its terrestrial service footprint.
Baby Bells chart
Current states
Wireline connections
AT&T provides wireline (copper-based) service in 22 states:
AT&T plans to retire copper-based service in most of its US footprint by 2030 and transition most customers to fiber-optic based service. Customers not served by its fiber-optic network will be offered its wireless-based AT&T Phone – Advanced service.
Fiber-optic connections
As of 2026, AT&T provides fiber–to–the–premises connectivity in 32 states:
Former operating companies
The following companies have become defunct or were sold under SBC/AT&T ownership:
Woodbury Telephone merged with Southern New England Telephone on June 1, 2007.
Southern New England Telephone was sold to Frontier Communications in 2014.
Decline of rural landlines
Of the Baby Bells, Ameritech sold some of its Wisconsin landlines to CenturyTel in 1998; BellSouth sold some of its lines to MebTel during the 2000s; US West sold many historically Bell landlines to Lynch Communications and Pacific Telecom in the 1990s; Verizon sold many of its New England lines to FairPoint Communications in 2008 and sold its Frontier West Virginia operations to Frontier Communications in 2010.
On October 25, 2014, Frontier Communications took over control of the AT&T landline network in Connecticut after being approved by state utility regulators. The deal was worth about $2 billion and included Frontier inheriting about 2,500 of AT&T's employees and many of AT&T's buildings.
Political involvement
According to OpenSecrets, AT&T was the fourteenth-largest donor to United States federal political campaigns and committees from 1989 to 2019, having contributed more than US$84.1 million, 58% of which went to Republicans and 42% of which went to Democrats. In 2005, AT&T was among 53 entities that contributed the maximum of $250,000 to the second inauguration of President George W. Bush. Bill Leahy, representing AT&T, sits on the Private Enterprise Board of the American Legislative Exchange Council (ALEC). ALEC is a nonprofit organization of conservative state legislators and private sector representatives that drafts and shares model state-level legislation for distribution among state governments in the United States.
During the period of 1998 to 2019, the company expended US$380.1 million on lobbying in the United States. A key political issue for AT&T has been the question of which businesses win the right to profit by providing broadband internet access in the United States. The company has also lobbied in support of several federal bills. AT&T supported the Federal Communications Commission Process Reform Act of 2013 (H.R. 3675; 113th Congress), a bill that would make a number of changes to procedures that the U.S. Federal Communications Commission (FCC) follows in its rulemaking processes. The FCC would have to act in a more transparent way as a result of this bill, forced to accept public input about regulations. AT&T's Executive Vice President of Federal Relations, Tim McKone, said that the bill's "much needed institutional reforms will help arm the agency with the tools to keep pace with the Internet speed of today's marketplace. It will also ensure that outmoded regulatory practices for today's competitive marketplace are properly placed in the dustbin of history."
In May 2018, reports emerged that AT&T made 12 monthly payments between January and December 2017 to Essential Consultants, a company set up by President Donald Trump's lawyer Michael Cohen, totaling $600,000. Although initial reports on May 8 mentioned only four monthly payments totaling $200,000, documents obtained by The Washington Post on May 10 confirmed the figure of 12 payments, which had begun three days after the President was sworn into office. AT&T confirmed the report the same day. The report from The Washington Post, as well as additional reporting from Bloomberg, revealed the payments had been made for Cohen to "provide guidance" relating to the attempted $85 billion merger with Time Warner, to gain information on the Trump administration's planned tax reforms, as well as about potential changes to net neutrality policies under the new FCC. Chairman of the FCC Ajit Pai denied Cohen ever inquired about net neutrality on AT&T's behalf. A spokesperson for AT&T said that the company had been contacted by the Special Counsel investigation led by Robert Mueller regarding the payments, and had provided all the information requested in November and December 2017.
In early 2019, the Democratic House Judiciary requested records related to the AT&T-Time Warner merger from the White House.
While it has expressed support for LGBTQ causes, AT&T has also donated to sponsors of legislation described by some as anti-transgender in several US states, especially those predominantly Republican-governed, including Arkansas, Tennessee, North Carolina, Texas, and Florida.
Historical financial performance
The financial performance of the company is reported to shareholders on an annual basis and is a matter of public record. Where performance has been restated, the most recent statement of performance from an annual report is used.
Carbon footprint
AT&T reported total CO2e emissions (direct + indirect) for the twelve months ending December 31, 2020 at 5,788 kt (−737 / −11.3% y-o-y) and plans to reduce emissions by 63% by 2030 from a 2015 base year. This science-based target is aligned with the Paris Agreement to limit global warming to 1.5 °C above pre-industrial levels.
Criticism and controversies
Hemisphere database
The company maintains a database of call detail records of all telephone calls that have passed through its network since 1987. AT&T employees work at High Intensity Drug Trafficking Area offices (operated by the Office of National Drug Control Policy) in Los Angeles, Atlanta, and Houston so data can be quickly turned over to law enforcement agencies. Records are requested via an administrative subpoena, without the involvement of a court or grand jury.
Censorship
In September 2007, AT&T changed its legal policy to state that "AT&T may immediately terminate or suspend all or a portion of your Service, any Member ID, electronic mail address, IP address, Universal Resource Locator or domain name used by you, without notice for conduct that AT&T believes ... (c) tends to damage the name or reputation of AT&T, or its parents, affiliates and subsidiaries." By October 10, 2007, AT&T had altered the terms and conditions for its Internet service to explicitly support freedom of expression by its subscribers, after an outcry claiming the company had given itself the right to censor its subscribers' transmissions.
Privacy controversy
In 2006, the Electronic Frontier Foundation lodged the class action lawsuit Hepting v. AT&T, which alleged that AT&T had allowed agents of the National Security Agency (NSA) to monitor phone and Internet communications of AT&T customers without warrants. If true, this would violate the Foreign Intelligence Surveillance Act of 1978 and the First and Fourth Amendments of the U.S. Constitution. AT&T has yet to confirm or deny that monitoring by the NSA is occurring. In April 2006, retired former AT&T technician Mark Klein lodged an affidavit supporting this allegation. The US Department of Justice stated it would intervene in this lawsuit by means of State Secrets Privilege.
In July 2006, the United States District Court for the Northern District of California – in which the suit was filed – rejected a federal government motion to dismiss the case. The motion to dismiss, which invoked the State Secrets Privilege, had argued that any court review of the alleged partnership between the federal government and AT&T would harm national security. The case was immediately appealed to the Ninth Circuit. It was dismissed on June 3, 2009, citing retroactive legislation in the FISA Amendments Act.
In May 2006, USA Today reported that all international and domestic calling records had been handed over to the National Security Agency by AT&T, Verizon, SBC, and BellSouth for the purpose of creating a massive calling database. The portions of the new AT&T that had been part of SBC Communications before November 18, 2005, were not mentioned.
On June 21, 2006, the San Francisco Chronicle reported that AT&T had rewritten rules on its privacy policy. The policy, which took effect June 23, 2006, says that "AT&T – not customers – owns customers' confidential info and can use it 'to protect its legitimate business interests, safeguard others, or respond to legal process.'"
On August 22, 2007, National Intelligence Director Mike McConnell confirmed that AT&T was one of the telecommunications companies that assisted with the government's warrantless wire-tapping program on calls between foreign and domestic sources.
On November 8, 2007, Mark Klein, a former AT&T technician, told Keith Olbermann of MSNBC that all Internet traffic passing over AT&T lines was copied into a locked room at the company's San Francisco office – to which only employees with National Security Agency clearance had access.
AT&T keeps for five to seven years a record of who text messages whom and the date and time, but not the content of the messages.
AT&T has a one star privacy rating from the Electronic Frontier Foundation.
Copyright enforcement
In January 2008, reports emerged that the company planned to begin filtering all Internet traffic which passed through its network for intellectual property violations. Media commentators speculated that if this plan was implemented, it would have led to a mass exodus of subscribers from AT&T, although Internet traffic of non-subscribers may have gone through the company's network anyway. Internet freedom proponents used these developments as justification for government-mandated network neutrality.
Under AT&T's current copyright enforcement program, content owners may notify AT&T when they allege unlawful sharing of material. The program is based on IP addresses visible to content owners in peer-to-peer networks, not on filtering. AT&T has terminated the broadband service of some customers accused of copyright infringement.
Discrimination against local public-access television channels
In 2009, AT&T was accused by community media groups of discriminating against local public, educational, and government access (PEG) cable TV channels, by "impositions that will severely restrict the audience".
According to Barbara Popovic, executive director of the Chicago public-access service CAN-TV, the new AT&T U-verse system forced all Public-access television into a special menu system, denying normal functionality such as channel numbers, access to the standard program guide, and DVR recording. The Ratepayer Advocates division of the California Public Utilities Commission reported: "Instead of putting the stations on individual channels, AT&T has bundled community stations into a generic channel that can only be navigated through a complex and lengthy process."
Sue Buske (president of telecommunications consulting firm the Buske Group and a former head of the National Federation of Local Cable Programmers/Alliance for Community Media) argued that this is "an overall attack [...] on public access across the [United States], the place in the dial around cities and communities where people can make their own media in their own communities".
Information security
In June 2010, a hacker group known as Goatse Security discovered a vulnerability within AT&T that could allow anyone to uncover email addresses belonging to customers of AT&T 3G service for the Apple iPad. These email addresses could be accessed without a protective password. Using a script, Goatse Security collected thousands of email addresses from AT&T. Goatse Security informed AT&T about the security flaw through a third party. Goatse Security then disclosed around 114,000 of these emails to Gawker Media, which published an article about the security flaw and disclosure in Valleywag. Praetorian Security Group criticized the web application that Goatse Security exploited as "poorly designed".
In April 2015, AT&T was fined $25 million over data security breaches, marking the largest fine issued by the Federal Communications Commission (FCC) for breaking data privacy laws. The investigation revealed the theft of details of approximately 280,000 people from call centers in Mexico, Colombia, and the Philippines.
In March 2024, AT&T confirmed the 2021 leak of contact information for over 7.6 million current users, as well as 65 million former ones. The leaked records may contain "full name, email address, mailing address, phone number, social security number, date of birth, AT&T account number and passcode". Multiple class-action lawsuits have been filed as a result.
In July 2024, the company stated it experienced a new breach, the largest to date. The company notified around 110 million customers who were affected.
Accusations of enabling fraud
In March 2012, the United States federal government announced a lawsuit against AT&T. The specific accusations state that AT&T "violated the False Claims Act by facilitating and seeking federal payment for IP Relay calls by international callers who were ineligible for the service and sought to use it for fraudulent purposes. The complaint alleges that, out of fears that fraudulent call volume would drop after the registration deadline, AT&T knowingly adopted a non-compliant registration system that did not verify whether the user was located within the United States. The complaint further contends that AT&T continued to employ this system even with the knowledge that it facilitated the use of IP Relay by fraudulent foreign callers, which accounted for up to 95 percent of AT&T's call volume. The government's complaint alleges that AT&T improperly billed the TRS Fund for reimbursement of these calls and received millions of dollars in federal payments as a result." In 2013, AT&T entered into a consent decree with the FCC and paid a total of $21.75 million.
Aaron Slator controversy
On April 28, 2015, AT&T announced that it had fired Aaron Slator, President of Content and Advertising Sales, for sending text messages critics described as racist. African-American employee Knoyme King filed a $100 million defamation lawsuit against Slator. The day before that, protesters arrived at AT&T's headquarters in Dallas and its satellite offices in Los Angeles, as well as at the home of CEO Randall Stephenson, to protest alleged systemic racial policies. According to accounts, the protesters demanded that AT&T begin working with 100% black-owned media companies.
On January 24, 2017, Slator sued AT&T in the Los Angeles Superior Court, accusing the company of defamation and wrongful termination. Slator had been involved in organizing AT&T's planned $48.5 billion acquisition of DirecTV since 2014, and he claimed that when news headlines speculated that his text messages could prevent the acquisition from going through, he was fired as a "scapegoat" by company executives. He also claimed that executive management had known about the text messages since at least late 2013, and had promised him at the time that he would not be fired for them. The company stood by its decision to terminate Slator.
Overcharging government agencies
In 2020, AT&T paid $48 million to settle a lawsuit with 30 government entities. The suit (under the California False Claims Act) related to contractual undertakings to provide services at "the lowest cost available". AT&T denied any wrongdoing in the matter.
One America News Network
An investigative report by Reuters in 2021 revealed that AT&T played a key role in creating, funding, and sustaining One America News Network (OAN), a far-right TV network known for promoting conspiracy theories. According to 2020 sworn testimony by an OAN accountant, 90% of OAN's revenue came from AT&T. According to OAN founder Robert Herring Sr., AT&T wanted to create a conservative network to compete with Fox News. Court documents showed OAN promised to "cast a positive light" on AT&T during newscasts. AT&T denied the allegations. NAACP president Derrick Johnson and comedian John Oliver criticized AT&T for funding OAN.
Leaking data to Wall Street
In March 2021, the U.S. Securities and Exchange Commission (SEC) filed suit against AT&T and three of its executives for violating the Fair Disclosure Rule against making selective disclosures of "material nonpublic information" to analysts and others. The SEC alleged that beginning in early 2016 these executives leaked key information to Wall Street analysts to manipulate revenue forecasts for the company.
In December 2022, without acknowledging any guilt, AT&T agreed to pay $6.25 million in fines to settle the lawsuit. The individual executives were also fined $25,000 each.
Bribery to influence legislation
In October 2022, AT&T agreed to pay a $23 million fine to resolve a federal criminal investigation into the company's efforts to unlawfully influence former Illinois Speaker of the House Michael J. Madigan. Under a deferred prosecution agreement with the US Department of Justice, AT&T admitted that it arranged for payments to an ally of Madigan to influence Madigan's vote in 2017 on legislation that would eliminate AT&T's so-called "Carrier of Last Resort" obligation to provide landline telephone service to all Illinois residents, which was expected to save the company millions of dollars. Madigan also helped to defeat an amendment to a bill that became law in 2018 regarding fees for small cell tower attachments that would have been harmful to AT&T's interests. Former AT&T Illinois President Paul La Schiazza described AT&T's quid pro quo relationship with Madigan in an email to an AT&T employee as "the friends and family plan."
2024 outage and FTC fine
On February 22, 2024, cellular service was disrupted across the United States with "millions" unable to connect to the cellular network. Municipalities reported that AT&T customers were unable to place calls to emergency services, even when using their phone's SOS capability. The blackout prompted the FBI and Department of Homeland Security to launch investigations into the possibility of a cyberattack being the cause of the blackout. AT&T later claimed that the cause was instead a poorly timed server update. Users were later compensated with account credits as a result of the outage. In March, the FCC opened an investigation into the outage.
On September 18, 2024, AT&T was fined $13 million by the Federal Trade Commission (FTC) following a major data breach that exposed millions of customers' personal information. The FTC found that AT&T failed to implement adequate cybersecurity measures and did not promptly notify affected individuals. As part of the settlement, AT&T was required to enhance its data protection practices and provide identity theft protection to those impacted.
Naming rights and sponsorships
Buildings
Whitacre Tower (One AT&T Plaza) – corporate headquarters, Dallas, Texas
AT&T 220 Building – building in Indianapolis, Indiana
AT&T Building – building in Detroit, Michigan
AT&T Building – building in Indianapolis, Indiana
AT&T Building – building in Kingman, Arizona
AT&T Building – (aka "The Batman Building") in Nashville, Tennessee
AT&T Building – building in Omaha, Nebraska
AT&T Building Addition – building in Detroit, Michigan
AT&T Building – building in San Diego
AT&T Center – building in Los Angeles
AT&T Center – building in St. Louis, Missouri
AT&T City Center – building in Birmingham, Alabama
AT&T Corporate Center – building in Chicago, Illinois
AT&T Huron Road Building – skyscraper in Cleveland, Ohio
AT&T Lenox Park Campus – AT&T Mobility Headquarters in DeKalb County just outside Atlanta, Georgia
AT&T Midtown Center – building in Atlanta, Georgia
AT&T Switching Center – building in Los Angeles
AT&T Switching Center – building in Oakland, California
AT&T Switching Center – building in San Francisco
AT&T Tower – building in Minneapolis, Minnesota
AT&T Building – building in Meriden, Connecticut
AT&T Entertainment Group HQ – DirecTV corporate campus in El Segundo, California
Venues
AT&T Field – Chattanooga, Tennessee (formerly BellSouth Park)
AT&T Plaza – Chicago, Illinois (public space that hosts the Cloud Gate sculpture in Millennium Park)
AT&T Performing Arts Center – Dallas, Texas
AT&T Stadium – Arlington, Texas (formerly Cowboys Stadium)
AT&T Stadium – Glen Jean, West Virginia (outdoor open-seating stadium at the Boy Scouts of America's Summit Bechtel Reserve)
Jones AT&T Stadium – Lubbock, Texas (formerly Clifford B. and Audrey Jones Stadium, Jones SBC Stadium)
Sponsorships
100 Thieves (esports)
AT&T Byron Nelson – Irving, Texas (golf)
AT&T Pebble Beach Pro-Am (golf)
Capitanes de la Ciudad de México (basketball)
Chicago Bulls (basketball)
College Football Playoff National Championship
Dallas Stars (ice hockey)
2026 FIFA World Cup
Houston Rockets (basketball)
Major League Soccer and the United States Soccer Federation, including the U.S. men's and U.S. women's national teams and the Major League Soccer All-Star Game from 2009
Mexico national football team
National Collegiate Athletic Association (Corporate Champion)
National Basketball Association, Women's National Basketball Association, NBA G League, USA Basketball and NBA 2K League (basketball, esports)
BMW Sauber (Formula One racing team) – 2005
Scuderia Ferrari (Formula One racing team) – 2005
Williams Racing (Formula One racing team) – 2007 to 2011
Richard Childress Racing #31 car (NASCAR) – 2007 to 2008
Red Bull Racing (Formula One racing team) – technical support and sponsorship, 2011 to 2020
Cloud9, sponsorship since March 2019
Club América – sponsorship since July 19, 2018
Source: Wikipedia, CC BY-SA 4.0 · View on Wikipedia ↗
T Stock Snapshot Price, market cap, P/E, EPS, ROE, debt/equity, 52-week range
T Stock Price Chart Daily OHLCV with technical indicators — pan, zoom, and customize your view
10-Year Performance Revenue, net income, margins and EPS trends
Valuation P/E, P/S, P/B, EV/EBITDA ratios — is the stock expensive or cheap?
Profitability Gross, operating and net margins; ROE, ROA, ROIC
Financial Health Debt, liquidity, solvency — balance sheet strength
Growth Revenue, EPS and net income growth: YoY, 3Y CAGR, 5Y CAGR
Capital Efficiency Asset turnover, inventory turnover, receivables turnover
Dividends Yield, payout ratio, dividend history, 5Y CAGR
| Ex-date | Amount |
|---|---|
| July 10, 2026 | $0.2780 |
| April 10, 2026 | $0.2780 |
| Jan. 12, 2026 | $0.2780 |
| Oct. 10, 2025 | $0.2780 |
| July 10, 2025 | $0.2780 |
| April 10, 2025 | $0.2780 |
| Jan. 10, 2025 | $0.2780 |
| Oct. 10, 2024 | $0.2780 |
| July 10, 2024 | $0.2780 |
| April 9, 2024 | $0.2780 |
| Jan. 9, 2024 | $0.2780 |
| Oct. 6, 2023 | $0.2780 |
| July 7, 2023 | $0.2780 |
| April 6, 2023 | $0.2780 |
| Jan. 9, 2023 | $0.2780 |
| Oct. 6, 2022 | $0.2780 |
| July 8, 2022 | $0.2780 |
| April 13, 2022 | $0.2780 |
| Jan. 7, 2022 | $0.5200 |
| Oct. 7, 2021 | $0.5200 |
T Analyst Consensus Bullish and bearish analyst opinions, 12-month price target, upside
- Strong Buy 9 25.7%
- Buy 11 31.4%
- Hold 14 40.0%
- Sell 1 2.9%
- Strong Sell 0 0.0%
12-Month Price Target
23 analysts · 2026-08-22Earnings History EPS actual vs estimate, surprise %, beat rate, next earnings date
| Period | EPS Actual | EPS Est | Surprise |
|---|---|---|---|
| June 30, 2026 | $0.65 | $0.60 | 0.05% |
| March 31, 2026 | $0.57 | $0.56 | 0.01% |
| Dec. 31, 2025 | $0.52 | $0.47 | 0.05% |
| Sept. 30, 2025 | $0.54 | $0.55 | -0.01% |
| June 30, 2025 | $0.54 | $0.52 | 0.02% |
| March 31, 2025 | $0.51 | $0.50 | 0.01% |
| Sept. 30, 2000 | $0.57 | $0.61 | -0.04% |
| June 30, 2000 | $0.54 | $0.57 | -0.03% |
Peer comparison (GICS sub-industry) Key metrics vs sector peers
| Ticker | Market Cap | P/E | Rev YoY | Net Margin | ROE | Gross Margin |
|---|---|---|---|---|---|---|
| T | $189.31B | 8.2 | 2.7% | 17.5% | 17.7% | — |
| VZ | $174.79B | 10.0 | 2.5% | 12.4% | 16.7% | — |
| CMCSA | — | 5.2 | -0.02% | 16.2% | 21.9% | — |
| UNIT | $1.64B | 1.4 | 91.5% | 58.4% | -125.9% | — |
| IDT | — | 19.6 | 2.1% | 6.2% | 27.6% | 36.2% |
| GLIBA | — | -3.7 | 2.9% | -29.5% | -19.9% | — |
| SHEN | $635M | -16.3 | 9.1% | -9.2% | -3.7% | — |
| ATNI | $348M | -16.5 | -0.15% | -2.1% | -3.2% | — |
Full Fundamentals All metrics by year — income statement, balance sheet, cash flow
Income Statement 15
| Metric | Trend | 2025 | 2024 | 2023 | 2022 | 2021 | 2020 | 2019 | 2018 | 2017 | 2016 | 2015 | 2014 |
|---|---|---|---|---|---|---|---|---|---|---|---|---|---|
| Revenue | $125.65B | $122.34B | $122.43B | $120.74B | $134.04B | $143.05B | $181.19B | $170.76B | $160.55B | $163.79B | $146.80B | $132.45B | |
| Cost of Revenue | · | · | · | · | · | · | · | · | · | · | · | $60.61B | |
| SG&A Expense | $28.94B | $28.41B | $28.87B | $28.96B | $29.67B | $30.82B | $39.42B | $36.77B | $35.47B | $36.84B | $32.92B | $39.70B | |
| Operating Expenses | $101.49B | $103.29B | $98.97B | $125.33B | $108.14B | $134.68B | $153.24B | $144.66B | $140.58B | $140.24B | $122.02B | $120.23B | |
| Operating Income | $24.16B | $19.05B | $23.46B | $-4.59B | $25.90B | $8.37B | $27.95B | $26.10B | $19.97B | $23.54B | $24.79B | $12.21B | |
| Interest Expense | · | · | $6.70B | $6.11B | $6.72B | $7.73B | $8.42B | $7.96B | $6.30B | $4.91B | $4.12B | $3.61B | |
| Other Non-op | $7.75B | $2.42B | $1.42B | $5.81B | $9.39B | $-1.09B | $-1.07B | $6.78B | $1.60B | $1.08B | $-52M | $1.58B | |
| Pretax Income | $27.01B | $16.70B | $19.85B | $-3.09B | $29.17B | $-354M | $18.47B | $24.87B | $15.14B | $19.81B | $20.69B | $10.36B | |
| Income Tax | $3.62B | $4.45B | $4.22B | $3.78B | $5.39B | $1.17B | $3.49B | $4.92B | $-14.71B | $6.48B | $7.00B | $3.62B | |
| Net Income | $21.95B | $10.95B | $14.40B | $-8.52B | $20.08B | $-5.18B | $13.90B | $19.37B | $29.45B | $12.98B | $13.35B | $6.44B | |
| EPS (Basic) | $3.04 | $1.49 | $1.97 | $-1.13 | $2.77 | $-0.75 | $1.90 | $2.85 | $4.77 | $2.10 | $2.37 | $1.24 | |
| EPS (Diluted) | $3.04 | $1.49 | $1.97 | $-1.13 | $2.73 | $-0.75 | $1.89 | $2.85 | $4.76 | $2.10 | $2.37 | $1.24 | |
| Shares (Basic) | 7,169,000,000 | 7,199,000,000 | 7,181,000,000 | 7,166,000,000 | 7,168,000,000 | 7,157,000,000 | 7,319,000,000 | 6,778,000,000 | 6,164,000,000 | 6,168,000,000 | 5,628,000,000 | 5,205,000,000 | |
| Shares (Diluted) | 7,179,000,000 | 7,204,000,000 | 7,258,000,000 | 7,587,000,000 | 7,503,000,000 | 7,466,000,000 | 7,348,000,000 | 6,806,000,000 | 6,183,000,000 | 6,189,000,000 | 5,646,000,000 | 5,221,000,000 | |
| EBITDA | $45.05B | $39.63B | $42.24B | $13.43B | $46.21B | $34.92B | $56.17B | $54.53B | $45.34B | $50.19B | $46.80B | $30.02B |
Balance Sheet 30
| Metric | Trend | 2025 | 2024 | 2023 | 2022 | 2021 | 2020 | 2019 | 2018 | 2017 | 2016 | 2015 | 2014 |
|---|---|---|---|---|---|---|---|---|---|---|---|---|---|
| Cash & Equivalents | $18.23B | $3.30B | $6.72B | $3.70B | $19.22B | $7.92B | $9.70B | $5.20B | $50.50B | $5.79B | $5.12B | $8.60B | |
| Short-term Investments | · | · | · | · | · | · | · | · | · | · | · | $1.89B | |
| Receivables | $8.84B | $9.64B | $10.29B | $11.47B | $12.31B | $20.21B | $22.64B | $26.47B | $16.52B | $16.79B | $16.53B | $14.53B | |
| Inventory | $2.42B | $2.27B | $2.18B | $3.12B | · | $3.59B | $2.86B | $2.77B | $2.23B | $2.04B | $4.03B | $1.93B | |
| Prepaid Expense | $19.23B | $15.96B | $17.27B | $3.12B | $3.33B | $3.69B | $1.63B | $2.05B | $1.37B | $1.55B | $1.07B | $831M | |
| Other Current Assets | · | · | $17.27B | $14.82B | $16.13B | $18.36B | $18.36B | $17.70B | $10.76B | $14.23B | $13.27B | $9.64B | |
| Current Assets | $48.73B | $31.17B | $36.46B | $33.11B | $170.77B | $52.01B | $54.76B | $51.43B | $79.15B | $38.37B | $35.99B | $33.61B | |
| PP&E (Net) | · | · | · | · | · | · | $130.13B | $131.47B | $125.22B | $124.90B | $124.45B | $112.90B | |
| PP&E (Gross) | · | · | · | · | · | · | $333.54B | $330.69B | $313.50B | $319.65B | $306.23B | $282.30B | |
| Accum. Depreciation | · | · | · | · | · | · | $203.41B | $199.22B | $188.28B | $194.75B | $181.78B | $169.40B | |
| Goodwill | $63.42B | $63.43B | $67.85B | $67.89B | $92.74B | $92.81B | $146.24B | $146.37B | $105.45B | $105.21B | $104.57B | $69.69B | |
| Other Non-current Assets | $19.33B | $17.83B | $19.60B | $19.61B | $19.25B | $23.62B | $22.75B | $24.81B | $18.44B | $16.81B | $15.35B | $13.43B | |
| Total Assets | $420.20B | $394.80B | $407.06B | $402.85B | $551.62B | $525.76B | $551.67B | $531.86B | $444.10B | $403.82B | $402.67B | $296.83B | |
| Accounts Payable | $38.51B | $27.43B | $27.31B | $31.10B | $29.51B | $31.84B | $29.64B | $27.02B | $24.44B | $22.03B | $21.05B | $14.98B | |
| Short-term Debt | $0 | $0 | $2.09B | $866M | $6.59B | $0 | $0 | $3.05B | $0 | · | · | $0 | |
| Current Liabilities | $53.78B | $46.87B | $51.13B | $56.17B | $106.23B | $63.44B | $68.91B | $64.42B | $81.39B | $50.58B | $47.82B | $37.28B | |
| Capital Leases | $18.94B | $17.39B | $17.57B | $18.66B | $18.96B | $22.20B | $21.80B | $0 | · | · | · | · | |
| Deferred Tax | $58.31B | $58.94B | $58.67B | $57.03B | $53.77B | $60.47B | $59.50B | $57.75B | $43.18B | $58.72B | $55.09B | $38.44B | |
| Other Non-current Liabilities | $25.10B | $23.90B | $23.70B | $28.85B | $25.24B | $28.36B | $29.42B | $30.23B | $19.75B | $21.75B | $22.26B | $17.99B | |
| Total Liabilities | · | · | · | · | · | · | · | · | · | · | $279.03B | $206.56B | |
| Long-term Debt | $134.72B | $122.12B | $133.40B | $133.21B | $167.48B | $155.21B | $161.11B | · | · | · | · | · | |
| Total Debt | $0 | $0 | $2.09B | $866M | $6.59B | · | $0 | $3.05B | · | · | · | $0 | |
| Common Stock | $7.62B | $7.62B | $7.62B | $7.62B | $7.62B | $7.62B | $7.62B | $7.62B | $6.50B | $6.50B | $6.50B | $6.50B | |
| Paid-in Capital | · | · | · | · | · | · | $126.28B | · | · | · | · | · | |
| Retained Earnings | $15.77B | $1.87B | $-5.01B | $-19.41B | $42.35B | $37.46B | $57.94B | $58.75B | $50.50B | $34.73B | $33.67B | $31.08B | |
| Treasury Stock | $18.53B | $15.02B | $16.13B | $17.08B | $17.28B | $17.91B | $13.09B | $12.06B | $12.71B | $12.66B | $12.59B | $47.03B | |
| AOCI | $-860M | $795M | $2.30B | $2.77B | $3.53B | $4.33B | $5.47B | $4.25B | $7.02B | $4.96B | $5.33B | $8.06B | |
| Stockholders' Equity | $126.49B | $118.25B | $117.44B | $106.46B | $183.85B | $179.24B | $201.93B | $193.88B | $142.01B | $124.11B | $123.64B | $90.27B | |
| Liabilities + Equity | $420.20B | $394.80B | $407.06B | $402.85B | $551.62B | $525.76B | $551.67B | $531.86B | $444.10B | $403.82B | $402.67B | $296.83B | |
| Shares Outstanding | 7,621,000,000 | 7,621,000,000 | 7,621,000,000 | 7,621,000,000 | 7,621,000,000 | 7,621,000,000 | 7,621,000,000 | 7,621,000,000 | 6,495,000,000 | 6,495,000,000 | 6,495,000,000 | 6,495,000,000 |
Cash Flow 17
| Metric | Trend | 2025 | 2024 | 2023 | 2022 | 2021 | 2020 | 2019 | 2018 | 2017 | 2016 | 2015 | 2014 |
|---|---|---|---|---|---|---|---|---|---|---|---|---|---|
| D&A | $20.89B | $20.58B | $18.78B | $18.02B | $17.85B | $22.52B | $28.22B | $28.43B | $24.39B | $25.85B | $22.02B | $18.27B | |
| Deferred Tax | · | $1.57B | $3.04B | $2.98B | $7.41B | $2.15B | $1.81B | $4.93B | $-15.27B | $2.95B | $4.12B | $1.95B | |
| Amort. of Intangibles | · | · | · | · | $4.29B | $8.24B | $7.93B | $8.35B | $4.63B | $5.19B | $2.73B | $500M | |
| Other Non-cash | $-2.56B | $5.67B | $2.10B | $23.34B | $-6.23B | $18.11B | $4.74B | $-4.81B | $1.25B | · | $-3.60B | $5.07B | |
| Operating Cash Flow | $40.28B | $38.77B | $38.31B | $35.81B | $37.17B | $37.48B | $48.67B | $43.60B | $38.01B | $38.44B | $35.88B | $31.34B | |
| CapEx | $20.84B | $20.26B | $17.85B | $19.63B | $15.54B | $14.69B | $19.64B | $21.25B | $20.65B | $21.52B | $19.22B | $21.20B | |
| Investing Cash Flow | $-18.78B | $-17.49B | $-19.66B | · | $-32.09B | $-13.55B | $-16.69B | $-63.15B | $-18.94B | $-23.32B | $-49.14B | $-18.34B | |
| Debt Issued | $14.03B | $19M | $10.00B | $2.98B | $9.93B | $31.99B | $17.04B | $41.88B | $48.79B | $10.14B | $33.97B | $15.93B | |
| Net Debt Issued | $8.50B | $-10.28B | $-2.04B | $-22.14B | $6.79B | $-7.98B | $-10.55B | $-10.77B | $36.45B | $-683M | $23.93B | $5.53B | |
| Stock Repurchased | $4.50B | $215M | $194M | $890M | $202M | $5.50B | $2.42B | $609M | $463M | $512M | $269M | $1.62B | |
| Net Stock Activity | $-4.50B | $-215M | $-194M | $-890M | $-202M | $-5.50B | $-2.42B | $-609M | $-463M | $-512M | $-269M | $-1.62B | |
| Dividends Paid | $8.18B | $8.21B | $8.14B | $9.86B | $15.07B | $14.96B | $14.89B | $13.41B | $12.04B | $11.80B | $10.20B | $9.55B | |
| Financing Cash Flow | $-6.39B | $-24.71B | $-15.61B | · | $1.58B | $-32.01B | $-25.08B | $-25.99B | $25.93B | $-14.46B | $9.78B | $-7.74B | |
| Net Change in Cash | · | · | · | · | $11.45B | $-2.42B | $6.89B | $-45.53B | $45.00B | $662M | $-3.48B | $5.26B | |
| Taxes Paid | $1.35B | $2.46B | $1.60B | $592M | $252M | $577M | $1.42B | $-354M | $2.01B | $3.72B | $1.85B | $1.53B | |
| Free Cash Flow | $19.44B | $18.51B | $20.46B | $16.19B | $25.43B | $27.45B | $29.23B | $22.84B | $18.50B | $17.83B | $16.66B | $10.14B | |
| Levered FCF | · | · | $15.18B | $2.62B | $19.94B | $16.85B | $22.40B | $16.46B | $6.08B | $14.52B | $13.94B | $7.77B |
Profitability 7
| Metric | Trend | 2025 | 2024 | 2023 | 2022 | 2021 | 2020 | 2019 | 2018 | 2017 | 2016 | 2015 | 2014 |
|---|---|---|---|---|---|---|---|---|---|---|---|---|---|
| Operating Margin | 19.2% | 15.6% | 19.2% | -3.8% | 13.8% | 3.7% | 15.4% | 15.3% | 13.1% | 14.9% | 16.9% | 8.9% | |
| Net Margin | 17.5% | 8.9% | 11.8% | -7.1% | 11.9% | -3.0% | 7.7% | 11.3% | 18.3% | · | 9.1% | 4.7% | |
| Pretax Margin | 21.5% | 13.7% | 16.2% | -2.6% | 16.0% | -1.7% | 10.2% | 14.6% | 9.4% | 12.1% | 14.1% | 7.5% | |
| EBITDA Margin | 35.9% | 32.4% | 34.5% | 11.1% | 27.4% | 20.3% | 31.0% | 31.9% | 28.2% | 30.6% | 31.9% | 22.7% | |
| ROA | 5.4% | 2.7% | 3.6% | -1.8% | 3.7% | -0.96% | 2.6% | 4.0% | 7.0% | · | 3.3% | 2.1% | |
| ROE | 17.7% | 9.3% | 12.2% | -6.9% | 11.0% | -2.8% | 7.0% | 10.2% | 22.1% | · | 10.8% | 6.9% | |
| ROIC | 16.5% | 11.8% | 15.4% | -9.5% | 9.8% | 4.8% | 11.2% | 10.6% | 29.1% | 13.2% | 13.3% | 8.8% |
Liquidity & Solvency 4
| Metric | Trend | 2025 | 2024 | 2023 | 2022 | 2021 | 2020 | 2019 | 2018 | 2017 | 2016 | 2015 | 2014 |
|---|---|---|---|---|---|---|---|---|---|---|---|---|---|
| Current Ratio | 0.9 | 0.7 | 0.7 | 0.6 | 0.7 | 0.8 | 0.8 | 0.8 | 1.0 | 0.8 | 0.8 | 0.9 | |
| Quick Ratio | 0.5 | 0.3 | 0.3 | 0.3 | 0.5 | 0.5 | 0.5 | 0.5 | 0.8 | 0.4 | 0.5 | 0.7 | |
| Debt / Equity | 0.0 | 0.0 | 0.0 | 0.0 | 0.0 | · | 0.0 | 0.0 | · | · | · | 0.0 | |
| Interest Coverage | · | · | 3.5 | -0.8 | 3.4 | 0.8 | 3.3 | 3.3 | 3.3 | 5.0 | 6.0 | 3.3 |
Efficiency 3
| Metric | Trend | 2025 | 2024 | 2023 | 2022 | 2021 | 2020 | 2019 | 2018 | 2017 | 2016 | 2015 | 2014 |
|---|---|---|---|---|---|---|---|---|---|---|---|---|---|
| Asset Turnover | 0.3 | 0.3 | 0.3 | 0.3 | 0.3 | 0.3 | 0.3 | 0.3 | 0.4 | 0.4 | 0.4 | 0.5 | |
| Inventory Turnover | · | · | · | · | · | · | · | · | · | · | · | 39.3 | |
| Receivables Turnover | 13.6 | 12.3 | 11.3 | 10.2 | 8.9 | 8.0 | 7.4 | 7.9 | 9.6 | 9.8 | 8.9 | 9.6 |
Growth Rates 8
| Metric | Trend | 2025 | 2024 | 2023 | 2022 | 2021 | 2020 | 2019 | 2018 | 2017 | 2016 | 2015 | 2014 |
|---|---|---|---|---|---|---|---|---|---|---|---|---|---|
| Revenue YoY | 2.7% | -0.08% | 1.4% | -9.9% | -6.3% | · | · | · | · | · | · | · | |
| Revenue CAGR 3Y | 1.3% | -3.0% | -5.1% | · | · | · | · | · | · | · | · | · | |
| Revenue CAGR 5Y | -2.6% | · | · | · | · | · | · | · | · | · | · | · | |
| EPS YoY | 104.0% | -24.4% | · | · | · | · | · | · | · | · | · | · | |
| EPS CAGR 3Y | · | -18.3% | · | · | · | · | · | · | · | · | · | · | |
| Net Income YoY | 100.5% | -24.0% | · | · | · | · | · | · | · | · | · | · | |
| Net Income CAGR 3Y | · | -18.3% | · | · | · | · | · | · | · | · | · | · | |
| Dividend CAGR 5Y | -11.4% | · | · | · | · | · | · | · | · | · | · | · |
Valuation (TTM) 17
| Metric | Trend | 2025 | 2024 | 2023 | 2022 | 2021 | 2020 | 2019 | 2018 | 2017 | 2016 | 2015 | 2014 |
|---|---|---|---|---|---|---|---|---|---|---|---|---|---|
| Revenue TTM | $125.65B | $122.34B | $122.43B | $120.74B | $134.04B | $143.05B | $181.19B | $170.76B | $160.55B | $163.79B | $146.80B | $132.45B | |
| Net Income TTM | $21.95B | $10.95B | $14.40B | $-8.52B | $20.08B | $-5.18B | $13.90B | $19.37B | $29.45B | $12.98B | $13.35B | $6.44B | |
| Market Cap | $189.31B | $173.53B | $127.88B | $140.30B | $141.60B | $165.54B | $224.95B | $164.28B | $190.73B | $208.63B | $168.80B | $164.78B | |
| Enterprise Value | $171.07B | $170.23B | $123.25B | $137.47B | $127.02B | · | $212.82B | $162.12B | · | · | · | $154.29B | |
| P/E | 8.2 | 15.3 | 8.5 | -16.3 | 6.8 | -29.0 | 15.6 | 7.6 | 6.2 | 15.3 | 11.0 | 20.5 | |
| P/S | 1.5 | 1.4 | 1.0 | 1.2 | 1.1 | 1.2 | 1.2 | 1.0 | 1.2 | 1.3 | 1.1 | 1.2 | |
| P/B | 1.5 | 1.5 | 1.1 | 1.3 | 0.8 | 0.9 | 1.1 | 0.8 | 1.3 | 1.7 | 1.4 | 1.9 | |
| P / Tangible Book | 3.0 | 3.2 | 2.6 | 3.6 | 1.6 | 1.9 | · | · | · | · | · | · | |
| P / Cash Flow | 4.7 | 4.5 | 3.3 | 3.9 | 3.4 | 3.8 | 4.6 | 3.8 | 4.9 | 5.3 | 4.7 | 5.3 | |
| P / FCF | 9.7 | 9.4 | 6.2 | 8.7 | 5.6 | 6.0 | 7.7 | 7.2 | 10.3 | 11.7 | 10.1 | 16.3 | |
| EV / EBITDA | 3.8 | 4.3 | 2.9 | 10.2 | 2.7 | · | 3.8 | 3.0 | · | · | · | 5.1 | |
| EV / FCF | 8.8 | 9.2 | 6.0 | 8.5 | 5.0 | · | 7.3 | 7.1 | · | · | · | 15.2 | |
| EV / Revenue | 1.4 | 1.4 | 1.0 | 1.1 | 0.9 | · | 1.2 | 0.9 | · | · | · | 1.2 | |
| Dividend Yield | 4.3% | 4.7% | 6.4% | 7.0% | 10.6% | 9.0% | 6.6% | 8.2% | 6.3% | 5.7% | 6.0% | 5.8% | |
| Earnings Yield | 12.2% | 6.5% | 11.7% | -6.1% | 14.7% | -3.5% | 6.4% | 13.2% | 16.2% | 6.5% | 9.1% | 4.9% | |
| Payout Ratio | 37.3% | 75.0% | 56.5% | -115.7% | 75.0% | -288.9% | 107.1% | 69.2% | 40.9% | · | 76.4% | 153.5% | |
| Annual Payout | $8.18B | $8.21B | $8.14B | $9.86B | $15.07B | $14.96B | $14.89B | $13.41B | $12.04B | $11.80B | $10.20B | $9.55B |
Income Statement 15
| Metric | Trend | Q1 2026 | Q4 2025 | Q3 2025 | Q2 2025 | Q1 2025 | Q4 2024 | Q3 2024 | Q2 2024 | Q1 2024 | Q4 2023 | Q3 2023 | Q2 2023 | Q1 2023 | Q4 2022 | Q3 2022 | Q2 2022 |
|---|---|---|---|---|---|---|---|---|---|---|---|---|---|---|---|---|---|
| Revenue | $31.51B | $33.47B | $30.71B | $30.85B | $30.63B | $32.30B | $30.21B | $29.80B | $30.03B | $32.02B | $30.35B | $29.92B | $30.14B | $31.34B | $30.04B | $29.64B | |
| Cost of Revenue | · | · | · | · | · | · | · | · | · | · | $160M | · | · | · | · | · | |
| SG&A Expense | $7.32B | $7.40B | $7.45B | $6.95B | $7.14B | $7.39B | $6.96B | $7.04B | $7.02B | $7.49B | $7.21B | $7.01B | $7.17B | $7.52B | $7.20B | $7.26B | |
| Operating Expenses | $24.85B | $27.68B | $24.59B | $24.35B | $24.87B | $26.97B | $28.10B | $24.04B | $24.18B | $26.75B | $24.57B | $23.51B | $24.14B | $52.44B | $24.03B | $24.69B | |
| Operating Income | $6.66B | $5.79B | $6.12B | $6.50B | $5.75B | $5.33B | $2.12B | $5.76B | $5.85B | $5.27B | $5.78B | $6.41B | $6.00B | $-21.09B | $6.01B | $4.96B | |
| Interest Expense | · | · | · | · | · | · | · | $1.70B | $1.72B | · | $1.66B | $1.61B | $1.71B | · | $1.42B | $1.50B | |
| Other Non-op | $594M | $278M | $6.25B | $767M | $455M | $569M | $717M | $682M | $451M | $-946M | $440M | $987M | $935M | $-919M | $2.27B | $2.30B | |
| Pretax Income | $5.40B | $4.26B | $10.65B | $6.10B | $5.99B | $5.31B | $1.43B | $5.09B | $4.87B | $2.94B | $4.98B | $6.17B | $5.77B | $-23.20B | $7.25B | $6.26B | |
| Income Tax | $1.18B | $109M | $976M | $1.24B | $1.30B | $900M | $1.28B | $1.14B | $1.12B | $354M | $1.15B | $1.40B | $1.31B | $-77M | $908M | $1.51B | |
| Net Income | $3.83B | $3.79B | $9.31B | $4.50B | $4.35B | $4.08B | $-174M | $3.60B | $3.44B | $2.19B | $3.50B | $4.49B | $4.23B | $-23.52B | $6.03B | $4.16B | |
| EPS (Basic) | $0.54 | $0.52 | $1.29 | $0.62 | $0.61 | $0.56 | $-0.03 | $0.49 | $0.47 | $0.30 | $0.48 | $0.61 | $0.58 | $-3.19 | $0.83 | $0.57 | |
| EPS (Diluted) | $0.54 | $0.52 | $1.29 | $0.62 | $0.61 | $0.56 | $-0.03 | $0.49 | $0.47 | $0.31 | $0.48 | $0.61 | $0.57 | $-3.14 | $0.80 | $0.56 | |
| Shares (Basic) | 7,017,000,000 | -14,409,000,000 | 7,156,000,000 | 7,209,000,000 | 7,213,000,000 | -14,391,000,000 | 7,202,000,000 | 7,196,000,000 | 7,192,000,000 | -14,352,000,000 | 7,185,000,000 | 7,180,000,000 | 7,168,000,000 | -14,340,000,000 | 7,153,000,000 | 7,169,000,000 | |
| Shares (Diluted) | 7,027,000,000 | -14,432,000,000 | 7,169,000,000 | 7,219,000,000 | 7,223,000,000 | -14,395,000,000 | 7,208,000,000 | 7,198,000,000 | 7,193,000,000 | -14,581,000,000 | 7,185,000,000 | 7,180,000,000 | 7,474,000,000 | -15,227,000,000 | 7,647,000,000 | 7,611,000,000 | |
| EBITDA | $11.62B | · | $11.44B | $11.75B | $10.94B | · | $7.20B | $10.83B | $10.89B | · | $10.49B | $11.08B | $10.63B | · | $10.53B | $9.41B |
Balance Sheet 22
| Metric | Trend | Q1 2026 | Q4 2025 | Q3 2025 | Q2 2025 | Q1 2025 | Q4 2024 | Q3 2024 | Q2 2024 | Q1 2024 | Q4 2023 | Q3 2023 | Q2 2023 | Q1 2023 | Q4 2022 | Q3 2022 | Q2 2022 |
|---|---|---|---|---|---|---|---|---|---|---|---|---|---|---|---|---|---|
| Cash & Equivalents | $11.96B | $18.23B | $20.27B | $10.50B | $6.88B | $3.30B | $2.59B | $3.09B | $3.52B | $6.72B | $7.54B | $9.53B | $2.82B | $3.70B | $2.42B | $4.02B | |
| Receivables | $8.34B | $8.84B | $8.94B | $8.84B | $9.23B | $9.64B | $9.07B | $9.69B | $9.58B | · | $8.96B | $9.30B | $10.21B | · | $11.38B | $11.38B | |
| Inventory | $2.45B | · | $2.89B | $2.36B | $2.59B | · | $2.53B | $1.82B | $2.13B | · | $2.52B | $2.35B | $2.79B | · | · | · | |
| Prepaid Expense | $23.53B | $19.23B | $22.48B | $17.61B | $15.07B | $15.96B | $15.62B | $15.27B | $15.22B | · | $16.60B | $15.49B | $14.08B | · | $14.55B | $15.76B | |
| Current Assets | $46.28B | $48.73B | $54.58B | $39.31B | $33.78B | $31.17B | $29.80B | $29.87B | $30.45B | · | $35.62B | $36.67B | $29.90B | · | $32.30B | $34.48B | |
| Goodwill | $63.84B | $63.42B | $63.42B | $63.43B | $63.43B | $63.43B | $63.43B | $67.85B | $67.85B | · | $67.85B | $67.85B | $67.89B | · | $92.72B | $92.75B | |
| Other Non-current Assets | $18.80B | $19.33B | $18.55B | $18.36B | $17.25B | $17.83B | $19.07B | $18.81B | $19.02B | · | $19.43B | $20.40B | $20.34B | · | $19.43B | $18.81B | |
| Total Assets | $421.19B | $420.20B | $423.21B | $405.49B | $397.47B | $394.80B | $393.72B | $398.03B | $399.43B | · | $406.70B | $408.45B | $400.87B | · | $426.46B | $426.43B | |
| Accounts Payable | $37.30B | $29.91B | $36.59B | $33.29B | $33.11B | $27.43B | $31.93B | $31.17B | $31.97B | · | $34.66B | $33.04B | $38.39B | · | $36.64B | $36.66B | |
| Short-term Debt | · | $0 | · | · | · | $0 | · | · | · | · | · | · | · | · | · | · | |
| Current Liabilities | $50.42B | $53.78B | $53.88B | $48.56B | $48.00B | $46.87B | $40.66B | $42.43B | $44.83B | · | $51.68B | $54.16B | $58.15B | · | $52.26B | $49.19B | |
| Capital Leases | $18.91B | $18.94B | $19.02B | $17.76B | $17.43B | $17.39B | $17.33B | $17.17B | $17.29B | · | $17.73B | $18.31B | $18.41B | · | $18.74B | $18.75B | |
| Deferred Tax | $59.11B | $58.31B | $59.30B | $59.79B | $59.14B | $58.94B | $58.46B | $58.92B | $58.82B | · | $58.67B | $57.97B | $57.29B | · | $56.05B | $55.30B | |
| Other Non-current Liabilities | $25.11B | $25.10B | $25.45B | $23.86B | $24.75B | $23.90B | $23.88B | $24.08B | $23.44B | · | $25.59B | $25.26B | $27.88B | · | $29.43B | $28.36B | |
| Long-term Debt | · | $134.72B | · | · | · | $122.12B | · | · | · | · | · | · | · | · | · | · | |
| Common Stock | $7.62B | $7.62B | $7.62B | $7.62B | $7.62B | $7.62B | $7.62B | $7.62B | $7.62B | · | $7.62B | $7.62B | $7.62B | · | $7.62B | $7.62B | |
| Retained Earnings | $17.62B | $15.77B | $13.97B | $6.68B | $4.21B | $1.87B | $-185M | $2M | $-1.57B | · | $-7.20B | $-10.70B | $-15.19B | · | $6.13B | $2.13B | |
| Treasury Stock | $20.27B | $18.53B | $16.70B | $15.21B | $14.25B | $15.02B | $15.09B | $15.27B | $15.28B | · | $16.15B | $16.16B | $16.17B | · | $17.15B | $17.16B | |
| AOCI | $-1.39B | $-860M | $-648M | $-200M | $-142M | $795M | $648M | $1.44B | $2.17B | · | $2.54B | $2.31B | $2.35B | · | $2.87B | $2.31B | |
| Stockholders' Equity | $125.62B | $126.49B | $126.75B | $121.39B | $119.86B | $118.25B | $116.28B | $119.35B | $118.62B | $117.44B | $117.86B | $116.08B | $108.35B | $106.46B | $139.98B | $135.31B | |
| Liabilities + Equity | $421.19B | $420.20B | $423.21B | $405.49B | $397.47B | $394.80B | $393.72B | $398.03B | $399.43B | · | $406.70B | $408.45B | $400.87B | · | $426.46B | $426.43B | |
| Shares Outstanding | · | 7,621,000,000 | · | · | 7,621,000,000 | 7,621,000,000 | 7,621,000,000 | 7,621,000,000 | 7,621,000,000 | 7,621,000,000 | 7,621,000,000 | 7,621,000,000 | 7,621,000,000 | 7,621,000,000 | 7,621,000,000 | 7,621,000,000 |
Cash Flow 16
| Metric | Trend | Q1 2026 | Q4 2025 | Q3 2025 | Q2 2025 | Q1 2025 | Q4 2024 | Q3 2024 | Q2 2024 | Q1 2024 | Q4 2023 | Q3 2023 | Q2 2023 | Q1 2023 | Q4 2022 | Q3 2022 | Q2 2022 |
|---|---|---|---|---|---|---|---|---|---|---|---|---|---|---|---|---|---|
| D&A | $4.97B | $5.13B | $5.32B | $5.25B | $5.19B | $5.37B | $5.09B | $5.07B | $5.05B | $4.77B | $4.71B | $4.67B | $4.63B | $4.59B | $4.51B | $4.45B | |
| Deferred Tax | · | · | · | · | · | · | $608M | $724M | $479M | · | $1.33B | $1.31B | $529M | $28M | $623M | $1.39B | |
| Other Non-cash | $-1.20B | · | · | · | $-492M | · | · | · | $-1.42B | · | · | · | $-2.71B | · | · | · | |
| Operating Cash Flow | $7.59B | $11.32B | $10.15B | $9.76B | $9.05B | $11.90B | $10.23B | $9.09B | $7.55B | $11.38B | $10.34B | $9.92B | $6.68B | $10.35B | $10.09B | $9.64B | |
| CapEx | $4.88B | $6.78B | $4.89B | $4.90B | $4.28B | $6.84B | $5.30B | $4.36B | $3.76B | $4.60B | $4.65B | $4.27B | $4.33B | $4.23B | $5.92B | $4.73B | |
| Investing Cash Flow | · | $-4.34B | $-3.39B | $-6.09B | $-4.96B | $-5.36B | $-5.15B | $-4.02B | $-2.96B | $-5.87B | $-4.54B | $-5.42B | $-3.82B | · | · | · | |
| Debt Issued | $8.10B | $0 | $7.60B | $3.47B | $2.96B | $15M | $2M | $2M | $0 | $371M | $0 | $6.27B | $3.37B | $2.50B | $0 | $0 | |
| Net Debt Issued | $2.85B | · | · | · | $1.43B | · | · | · | $-4.68B | · | · | · | $-2.58B | · | $-199M | $-23.42B | |
| Stock Repurchased | $2.48B | $1.83B | $1.49B | $961M | $218M | $13M | $43M | $2M | $157M | $4M | $1M | $1M | $188M | $15M | $3M | $675M | |
| Net Stock Activity | $-2.48B | · | · | · | $-218M | · | · | · | $-157M | · | · | · | $-188M | · | · | · | |
| Dividends Paid | $2.00B | $2.01B | $2.03B | $2.04B | $2.09B | $2.04B | $2.04B | $2.10B | $2.03B | $2.02B | $2.02B | $2.08B | $2.01B | $2.01B | $2.01B | $2.09B | |
| Financing Cash Flow | · | $-8.78B | $2.99B | $-45M | $-553M | $-5.85B | $-5.56B | $-5.48B | $-7.82B | $-6.33B | $-7.75B | $2.18B | $-3.71B | · | · | · | |
| Net Change in Cash | $-6.20B | · | · | · | $3.54B | · | · | · | · | · | · | · | · | · | · | · | |
| Taxes Paid | $1M | $456M | $17M | $869M | $11M | $1.57B | $583M | $308M | $-9M | $841M | $423M | $325M | $10M | $192M | $62M | $171M | |
| Free Cash Flow | $2.72B | · | · | · | $4.77B | · | · | · | $3.79B | · | · | · | $2.34B | · | · | · | |
| Levered FCF | · | · | · | · | · | · | · | · | $2.46B | · | · | · | $1.02B | · | · | · |
Profitability 7
| Metric | Trend | Q1 2026 | Q4 2025 | Q3 2025 | Q2 2025 | Q1 2025 | Q4 2024 | Q3 2024 | Q2 2024 | Q1 2024 | Q4 2023 | Q3 2023 | Q2 2023 | Q1 2023 | Q4 2022 | Q3 2022 | Q2 2022 |
|---|---|---|---|---|---|---|---|---|---|---|---|---|---|---|---|---|---|
| Operating Margin | 21.1% | · | 19.9% | 21.1% | 18.8% | · | 7.0% | 19.3% | 19.5% | · | 19.1% | 21.4% | 19.9% | · | 20.0% | 16.7% | |
| Net Margin | 12.2% | · | 30.3% | 14.6% | 14.2% | · | -0.58% | 12.1% | 11.5% | · | 11.5% | 15.0% | 14.0% | · | 20.1% | 14.0% | |
| Pretax Margin | 17.1% | · | 34.7% | 19.8% | 19.6% | · | 4.7% | 17.1% | 16.2% | · | 16.4% | 20.6% | 19.1% | · | 24.1% | 21.1% | |
| EBITDA Margin | 36.9% | · | 37.2% | 38.1% | 35.7% | · | 23.8% | 36.4% | 36.3% | · | 34.5% | 37.0% | 35.3% | · | 35.0% | 31.7% | |
| ROA | 0.94% | · | 2.3% | 1.1% | 1.1% | · | -0.04% | 0.89% | 0.86% | · | 0.84% | 1.1% | 0.86% | · | 1.2% | 0.85% | |
| ROE | 3.1% | · | 7.7% | 3.7% | 3.6% | · | -0.15% | 3.1% | 3.0% | · | 2.7% | 3.6% | 2.9% | · | 3.6% | 2.6% | |
| ROIC | 4.1% | · | 4.4% | 4.3% | 3.8% | · | 0.18% | 3.7% | 3.8% | · | 3.8% | 4.3% | 4.3% | · | 3.8% | 2.8% |
Liquidity & Solvency 3
| Metric | Trend | Q1 2026 | Q4 2025 | Q3 2025 | Q2 2025 | Q1 2025 | Q4 2024 | Q3 2024 | Q2 2024 | Q1 2024 | Q4 2023 | Q3 2023 | Q2 2023 | Q1 2023 | Q4 2022 | Q3 2022 | Q2 2022 |
|---|---|---|---|---|---|---|---|---|---|---|---|---|---|---|---|---|---|
| Current Ratio | 0.9 | · | 1.0 | 0.8 | 0.7 | · | 0.7 | 0.7 | 0.7 | · | 0.7 | 0.7 | 0.5 | · | 0.6 | 0.7 | |
| Quick Ratio | 0.4 | · | 0.5 | 0.4 | 0.3 | · | 0.3 | 0.3 | 0.3 | · | 0.3 | 0.3 | 0.2 | · | 0.3 | 0.3 | |
| Interest Coverage | · | · | · | · | · | · | · | 3.4 | 3.4 | · | 3.5 | 4.0 | 3.5 | · | 4.2 | 3.3 |
Efficiency 3
| Metric | Trend | Q1 2026 | Q4 2025 | Q3 2025 | Q2 2025 | Q1 2025 | Q4 2024 | Q3 2024 | Q2 2024 | Q1 2024 | Q4 2023 | Q3 2023 | Q2 2023 | Q1 2023 | Q4 2022 | Q3 2022 | Q2 2022 |
|---|---|---|---|---|---|---|---|---|---|---|---|---|---|---|---|---|---|
| Asset Turnover | 0.1 | · | 0.1 | 0.1 | 0.1 | · | 0.1 | 0.1 | 0.1 | · | 0.1 | 0.1 | 0.1 | · | 0.1 | 0.1 | |
| Inventory Turnover | · | · | · | · | · | · | · | · | · | · | 0.1 | · | · | · | · | · | |
| Receivables Turnover | 3.6 | · | 3.4 | 3.3 | 3.3 | · | 3.4 | 3.1 | 3.0 | · | 3.0 | 2.9 | 2.2 | · | 2.0 | 2.1 |
Valuation (TTM) 11
| Metric | Trend | Q1 2026 | Q4 2025 | Q3 2025 | Q2 2025 | Q1 2025 | Q4 2024 | Q3 2024 | Q2 2024 | Q1 2024 | Q4 2023 | Q3 2023 | Q2 2023 | Q1 2023 | Q4 2022 | Q3 2022 | Q2 2022 |
|---|---|---|---|---|---|---|---|---|---|---|---|---|---|---|---|---|---|
| Revenue TTM | $123.69B | · | $122.39B | $121.48B | $120.66B | · | $122.06B | $122.20B | $122.32B | · | $121.75B | $121.44B | $121.17B | · | $120.49B | $121.78B | |
| Net Income TTM | $21.99B | · | $17.99B | $12.27B | $11.22B | · | $10.36B | $15.03B | $15.66B | · | $18.24B | $18.90B | $19.22B | · | $20.91B | $16.45B | |
| Market Cap | · | · | · | · | $215.52B | · | $167.66B | $145.64B | $134.13B | · | $114.47B | $121.55B | $146.70B | · | $116.91B | $159.74B | |
| P/E | 9.5 | · | 11.3 | 17.1 | 18.4 | · | 15.6 | 9.3 | 8.3 | · | 6.1 | 6.3 | 7.5 | · | 5.5 | 9.4 | |
| P/S | · | · | · | · | 1.8 | · | 1.4 | 1.2 | 1.1 | · | 0.9 | 1.0 | 1.2 | · | 1.0 | 1.3 | |
| P/B | · | · | · | · | 1.8 | · | 1.4 | 1.2 | 1.1 | · | 1.0 | 1.0 | 1.4 | · | 0.8 | 1.2 | |
| P / Tangible Book | · | · | · | · | 3.8 | · | 3.2 | 2.8 | 2.6 | · | 2.3 | 2.5 | 3.6 | · | 2.5 | 3.8 | |
| P / Cash Flow | · | · | · | · | 23.8 | · | · | · | 17.8 | · | · | · | 22.0 | · | · | · | |
| P / FCF | · | · | · | · | 45.2 | · | · | · | 35.4 | · | · | · | 62.6 | · | · | · | |
| Earnings Yield | 10.6% | · | 8.8% | 5.8% | 5.5% | · | 6.4% | 10.7% | 12.1% | · | 16.4% | 15.9% | 13.4% | · | 18.3% | 10.6% | |
| Payout Ratio | 52.1% | · | · | · | 48.1% | · | · | · | 59.0% | · | · | · | 47.6% | · | · | · |
Financial Statements Income statement, balance sheet, cash flow — annual, last 5 years
Income Statement
| 2025-12-31 | 2024-12-31 | 2023-12-31 | 2022-12-31 | 2021-12-31 | |
|---|---|---|---|---|---|
| Revenue | $125.65B | $122.34B | $122.43B | $120.74B | $134.04B |
| Operating Margin % | 19.2% | 15.6% | 19.2% | -3.8% | 13.8% |
| Net Income | $21.95B | $10.95B | $14.40B | $-8.52B | $20.08B |
| Diluted EPS | $3.04 | $1.49 | $1.97 | $-1.13 | $2.73 |
Balance Sheet
| 2025-12-31 | 2024-12-31 | 2023-12-31 | 2022-12-31 | 2021-12-31 | |
|---|---|---|---|---|---|
| Debt / Equity | 0.0 | 0.0 | 0.0 | 0.0 | 0.0 |
| Current Ratio | 0.9 | 0.7 | 0.7 | 0.6 | 0.7 |
| Quick Ratio | 0.5 | 0.3 | 0.3 | 0.3 | 0.5 |
Cash Flow
| 2025-12-31 | 2024-12-31 | 2023-12-31 | 2022-12-31 | 2021-12-31 | |
|---|---|---|---|---|---|
| Free Cash Flow | $19.44B | $18.51B | $20.46B | $16.19B | $25.43B |
Latest News Recent headlines mentioning this company
- Elon Musk Says SpaceX Will Try to Catch a Returning Starship This Month
- Dollar Climbs with Crude Prices and T-Note Yields
- D-Wave Quantum Just Got a 240x Boost From AT&T. How to Play QBTS From Here.
- Here's Why the 2027 Social Security COLA Could Be Lower Than Expected
- Manufacturing survey shows inflation worries 'worse than pandemic era,' adding to Fed pressure
- Dollar Finds Support on Higher T-Note Yields
- Stocks Finish Higher as Amazon Leads Megacaps Higher
- AT&T Just Expanded Its Use of D-Wave Quantum's Tech. Time to Buy This Leading Quantum-Computing Stock?
- Why Trump's new tariff blitz is very different this time round
- AT&T’s Q2 Beat Suggests the Wireless Giants Still Have Room to Run
My Metrics Your personal watchlist — selected rows from Full Fundamentals
Pick the metrics that matter to you — click the ➕ next to any row in Full Fundamentals above.
Your selection is saved and follows you across all tickers.
Institutional owners (13F) 2,977 filers · $61.4B total · As of June 30, 2026
Institutions that report holding this stock in their quarterly SEC Form 13F. Long positions only; a single filer may appear twice for separate option legs. Large offsetting put/call legs typically reflect market-making or hedged inventory, not directional conviction.
| New positions | Exited positions | Increased | Decreased | Net shares change |
|---|---|---|---|---|
| 144 (-209 vs prior Q) | 387 (+256 vs prior Q) | 1,119 (-121 vs prior Q) | 1,116 (-3 vs prior Q) | -6.4M |
Compared to Q1 2026. SEC Form 13F filings are due within 45 days of quarter-end plus a short buffer for late filers — quarters still inside that window are skipped in favor of the most recent fully-reported pair.
| Institution | Value | Shares | % of tracked 13F | Type |
|---|---|---|---|---|
| VANGUARD CAPITAL MANAGEMENT LLC | $9,388,752,133 | 453,562,905 | 15.30% | Shares |
| STATE STREET CORP | $6,919,463,789 | 334,273,613 | 11.28% | Shares |
| Newport Trust Company, LLC | $3,699,702,617 | 178,729,595 | 6.03% | Shares |
| GEODE CAPITAL MANAGEMENT, LLC | $3,177,327,321 | 154,111,997 | 5.18% | Shares |
| VANGUARD PORTFOLIO MANAGEMENT LLC | $2,780,451,055 | 134,321,307 | 4.53% | Shares |
| NORGES BANK | $1,640,927,709 | 79,271,870 | 2.67% | Shares |
| GQG Partners LLC | $1,223,364,203 | 59,099,713 | 1.99% | Shares |
| Capital World Investors | $1,221,375,783 | 59,003,661 | 1.99% | Shares |
| CHARLES SCHWAB INVESTMENT MANAGEMENT INC | $1,085,977,869 | 52,462,699 | 1.77% | Shares |
| DIMENSIONAL FUND ADVISORS LP | $1,001,206,145 | 48,367,450 | 1.63% | Shares |
| Capital Research Global Investors | $928,063,697 | 44,833,995 | 1.51% | Shares |
| VANGUARD FIDUCIARY TRUST CO | $807,205,111 | 38,995,416 | 1.32% | Shares |
| AMERIPRISE FINANCIAL INC | $757,565,899 | 36,598,938 | 1.23% | Shares |
| THORNBURG INVESTMENT MANAGEMENT INC | $745,682,579 | 36,023,313 | 1.22% | Shares |
| ARROWSTREET CAPITAL, LIMITED PARTNERSHIP | $635,664,687 | 30,708,439 | 1.04% | Shares |
| GOLDMAN SACHS GROUP INC | $413,355,264 | 19,968,853 | 0.67% | Shares |
| Swiss National Bank | $407,640,629 | 19,692,784 | 0.66% | Shares |
| BlackRock, Inc. | $389,806,585 | 18,831,236 | 0.64% | Shares |
| Sumitomo Mitsui Trust Group, Inc. | $375,903,327 | 18,159,581 | 0.61% | Shares |
| National Pension Service | $369,434,680 | 17,847,086 | 0.60% | Shares |
| FMR LLC | $368,245,940 | 17,789,659 | 0.60% | Shares |
| RAYMOND JAMES FINANCIAL INC | $364,315,636 | 17,599,789 | 0.59% | Shares |
| Mitsubishi UFJ Asset Management Co., Ltd. | $352,680,411 | 17,037,701 | 0.57% | Shares |
| California Public Employees Retirement System | $341,869,898 | 16,515,454 | 0.56% | Shares |
| JANE STREET GROUP, LLC | $332,626,230 | 16,068,900 | 0.54% | Call option |
| ALLIANCEBERNSTEIN L.P. | $329,190,988 | 11,355,329 | 0.54% | Shares |
| Legal & General Group Plc | $323,521,791 | 15,629,072 | 0.53% | Shares |
| VANGUARD ASSET MANAGEMENT, Ltd | $319,200,500 | 15,420,314 | 0.52% | Shares |
| BNP PARIBAS FINANCIAL MARKETS | $318,791,965 | 15,400,578 | 0.52% | Shares |
| CALIFORNIA STATE TEACHERS RETIREMENT SYSTEM | $317,301,899 | 10,945,219 | 0.52% | Shares |
| Vanguard Global Advisers, LLC | $317,291,815 | 15,328,107 | 0.52% | Shares |
| Brandywine Global Investment Management, LLC | $303,770,546 | 12,229,088 | 0.50% | Shares |
| ENVESTNET ASSET MANAGEMENT INC | $291,959,744 | 14,104,393 | 0.48% | Shares |
| BARCLAYS PLC | $289,033,336 | 13,962,963 | 0.47% | Shares |
| Robeco Institutional Asset Management B.V. | $268,815,858 | 12,986,273 | 0.44% | Shares |
| BANK OF AMERICA CORP /DE/ | $268,066,568 | 12,950,076 | 0.44% | Shares |
| D. E. Shaw & Co., Inc. | $267,596,559 | 12,927,370 | 0.44% | Shares |
| LPL Financial LLC | $260,321,681 | 12,575,928 | 0.42% | Shares |
| RHUMBLINE ADVISERS | $243,743,274 | 11,775,030 | 0.40% | Shares |
| UBS Group AG | $243,502,297 | 11,763,396 | 0.40% | Shares |
| STATE FARM MUTUAL AUTOMOBILE INSURANCE CO | $239,764,498 | 11,582,826 | 0.39% | Shares |
| PeakShares LLC | $232,792,000 | 11,246 | 0.38% | Shares |
| Caisse de depot et placement du Quebec | $223,875,903 | 10,815,261 | 0.36% | Shares |
| ASSETMARK, INC | $223,106,096 | 10,778,072 | 0.36% | Shares |
| FRANKLIN RESOURCES INC | $216,672,717 | 10,467,281 | 0.35% | Shares |
| WORLDQUANT MILLENNIUM ADVISORS LLC | $201,104,019 | 9,715,170 | 0.33% | Shares |
| JANE STREET GROUP, LLC | $194,803,560 | 9,410,800 | 0.32% | Put option |
| UBS AM, a distinct business unit of UBS ASSET MANAGEMENT AMERICAS LLC | $189,309,657 | 6,530,171 | 0.31% | Shares |
| BANK OF MONTREAL /CAN/ | $186,612,529 | 9,015,098 | 0.30% | Shares |
| TWO SIGMA ADVISERS, LP | $164,793,528 | 6,634,200 | 0.27% | Shares |
| NEW YORK STATE COMMON RETIREMENT FUND | $150,197,689 | 7,255,927 | 0.24% | Shares |
| PRUDENTIAL FINANCIAL INC | $145,105,820 | 7,009,943 | 0.24% | Shares |
| PFA Pension, Forsikringsaktieselskab | $137,841,017 | 6,658,986 | 0.22% | Shares |
| Ensign Peak Advisors, Inc | $137,580,273 | 6,646,390 | 0.22% | Shares |
| Nuveen Asset Management, LLC | $133,764,851 | 5,874,609 | 0.22% | Shares |
| CANADA PENSION PLAN INVESTMENT BOARD | $130,181,845 | 6,288,978 | 0.21% | Shares |
| AVIVA PLC | $128,742,656 | 6,219,452 | 0.21% | Shares |
| MILLENNIUM MANAGEMENT LLC | $127,325,286 | 6,150,980 | 0.21% | Shares |
| VOLORIDGE INVESTMENT MANAGEMENT, LLC | $127,071,877 | 6,138,738 | 0.21% | Shares |
| MACKENZIE FINANCIAL CORP | $126,067,554 | 6,090,220 | 0.21% | Shares |
| STOREBRAND ASSET MANAGEMENT AS | $126,041,720 | 6,088,972 | 0.21% | Shares |
| Drexel Morgan & Co. | $125,753,328 | 6,075,040 | 0.20% | Shares |
| Universal- Beteiligungs- und Servicegesellschaft mbH | $124,469,546 | 6,019,549 | 0.20% | Shares |
| ADAGE CAPITAL PARTNERS GP, L.L.C. | $124,049,697 | 5,992,739 | 0.20% | Shares |
| STATE BOARD OF ADMINISTRATION OF FLORIDA RETIREMENT SYSTEM | $123,238,402 | 5,953,546 | 0.20% | Shares |
| Cullen Capital Management, LLC | $118,446,958 | 5,722,075 | 0.19% | Shares |
| SCHRODER INVESTMENT MANAGEMENT GROUP | $116,790,953 | 5,642,075 | 0.19% | Shares |
| Mariner, LLC | $116,363,612 | 5,618,477 | 0.19% | Shares |
| WEALTH ENHANCEMENT ADVISORY SERVICES, LLC | $113,060,102 | 5,454,848 | 0.18% | Shares |
| VIRGINIA RETIREMENT SYSTEMS ET Al | $111,636,003 | 4,494,203 | 0.18% | Shares |
| CI INVESTMENTS INC. | $108,119,992 | 5,223,188 | 0.18% | Shares |
| EQUITY INVESTMENT CORP | $104,115,909 | 5,029,754 | 0.17% | Shares |
| APG Asset Management N.V. | $103,594,963 | 5,721,745 | 0.17% | Shares |
| MANUFACTURERS LIFE INSURANCE COMPANY, THE | $102,416,148 | 4,947,640 | 0.17% | Shares |
| Asset Management One Co., Ltd. | $100,963,821 | 3,482,712 | 0.16% | Shares |
| HEALTHCARE OF ONTARIO PENSION PLAN TRUST FUND | $99,778,285 | 4,820,207 | 0.16% | Shares |
| Zurcher Kantonalbank (Zurich Cantonalbank) | $95,725,949 | 4,624,442 | 0.16% | Shares |
| CITIGROUP INC | $93,698,550 | 4,526,500 | 0.15% | Put option |
| CITADEL ADVISORS LLC | $93,170,369 | 4,500,984 | 0.15% | Shares |
| Trexquant Investment LP | $90,721,021 | 4,382,658 | 0.15% | Shares |
| Kodai Capital Management LP | $88,381,108 | 3,125,216 | 0.14% | Shares |
| Mitsubishi UFJ Trust & Banking Corp | $87,260,022 | 4,215,460 | 0.14% | Shares |
| KLP KAPITALFORVALTNING AS | $86,423,825 | 4,175,064 | 0.14% | Shares |
| LETKO, BROSSEAU & ASSOCIATES INC | $86,420,948 | 4,174,925 | 0.14% | Shares |
| Cetera Investment Advisers | $85,744,190 | 4,142,230 | 0.14% | Shares |
| VICTORY CAPITAL MANAGEMENT INC | $84,922,433 | 4,102,533 | 0.14% | Shares |
| STATE OF WISCONSIN INVESTMENT BOARD | $84,124,096 | 4,063,966 | 0.14% | Shares |
| Korea Investment CORP | $83,990,147 | 4,057,495 | 0.14% | Shares |
| AustralianSuper Pty Ltd | $82,956,658 | 4,007,568 | 0.14% | Shares |
| Empower Advisory Group, LLC | $81,763,185 | 3,949,912 | 0.13% | Shares |
| TD Asset Management Inc | $80,927,996 | 3,909,565 | 0.13% | Shares |
| Pictet Asset Management Holding SA | $80,321,071 | 3,880,245 | 0.13% | Shares |
| Balyasny Asset Management L.P. | $78,920,447 | 3,812,582 | 0.13% | Shares |
| Man Group plc | $78,401,954 | 3,787,534 | 0.13% | Shares |
| ROYAL LONDON ASSET MANAGEMENT LTD | $78,355,192 | 3,785,275 | 0.13% | Shares |
| Woodline Partners LP | $77,586,519 | 3,748,141 | 0.13% | Shares |
| UniSuper Management Pty Ltd | $74,893,780 | 3,618,057 | 0.12% | Shares |
| Quantinno Capital Management LP | $74,641,253 | 3,605,857 | 0.12% | Shares |
| Vanguard Investments Australia, Ltd. | $73,762,960 | 3,563,428 | 0.12% | Shares |
| BNP PARIBAS ASSET MANAGEMENT Holding S.A. | $73,606,406 | 3,555,865 | 0.12% | Shares |
Company insiders 81 insiders · 38 officers · 44 directors
| Insider | Role | Last activity | Shares owned | Buys 12m | Sells 12m | Net 12m |
|---|---|---|---|---|---|---|
| John T Stankey | CEO & President | April 30, 2026 A | 77,744 | 0 | 0 | $0 |
| Jason Kilar | CEO, Warner Media, LLC | Feb. 15, 2022 M | 418,077 | 0 | 0 | $0 |
| Brian D Lesser | CEO, Xandr Inc. | Jan. 30, 2020 A | 20,435 | 0 | 0 | $0 |
| John Donovan | CEO, AT&T Communications, LLC | Oct. 1, 2019 F | 203,785 | 0 | 0 | $0 |
| Andrew M Geisse | CEO-AT&T Business Solutions | Dec. 31, 2014 A | 70,078 | 0 | 0 | $0 |
| Rayford Wilkins JR | CEO-AT&T Diversified Bus. | March 30, 2012 A | 24,248 | 0 | 0 | $0 |
| Ronald Spears | Pres. & CEO, AT&T Corp. | Aug. 31, 2010 A | 3,852 | 0 | 0 | $0 |
| Stanley T Sigman | Pres.&CEO-AT&T Mobility | July 31, 2007 A | 67,681 | 0 | 0 | $0 |
| Edward E Whitacre JR | Chairman, CEO and President | May 31, 2007 A | 2,454 | 0 | 0 | $0 |
| Pascal Desroches | Sr. Exec VP and CFO | April 30, 2026 A | 127,149 | 0 | 0 | $0 |
| Richard G Lindner | Sr. Exec. VP and CFO | May 31, 2011 A | 5,638 | 0 | 0 | $0 |
| David W Dorman | President | Nov. 23, 2005 S | 156,698 | 0 | 0 | $0 |
| John H Atterbury III | Group President-IP Services | April 29, 2005 A | 99,662 | 0 | 0 | $0 |
| William M Daley | President | May 15, 2004 D | 28,350 | 0 | 0 | $0 |
| Jeffery S. Mcelfresh | Chief Operating Officer | April 30, 2026 A | 179,230 | 0 | 0 | $0 |
| Sanders S Sabrina | SVP-ChiefActngOfcr&Controller | April 30, 2026 A | 1,964 | 0 | 0 | $0 |
| Lori M Lee | Global Mktg Ofr & SEVP Intl | April 30, 2026 A | 8,784 | 0 | 0 | $0 |
| David R Mcatee II | Sr. Exec. VP and Gen. Counsel | Feb. 18, 2026 G | 250,254 | 0 | 0 | $0 |
| Darcie M. Cakaric | SEVP and Chief HR Officer | Feb. 13, 2026 M | 8,730 | 0 | 0 | $0 |
| Jeremy Alan Legg | Chief Technology Officer | Jan. 29, 2026 D | 0 | 0 | 0 | $0 |
| Kenny Kellyn Smith | Chief Marketing & Growth Ofcr | Jan. 29, 2026 D | 0 | 0 | 0 | $0 |
| Edward W Gillespie | SEVP-Ext & Legislative Affairs | Jan. 29, 2026 D | 0 | 0 | 0 | $0 |
| Thaddeus F. Arroyo | Chief Strategy & Dev Officer | Jan. 15, 2026 M | 379,232 | 0 | 0 | $0 |
| Angela Santone | Sr. Exec VP-Human Resources | Aug. 31, 2023 A | 38,168 | 0 | 0 | $0 |
| David S. Huntley | SEVP&Chief Compliance Officer | June 30, 2023 A | 31,071 | 0 | 0 | $0 |
| Debra L. Dial | SVP-ChiefActngOfcr&Controller | March 31, 2023 A | 4,408 | 0 | 0 | $0 |
| Randall L Stephenson | Exec Chairman of the Board | Dec. 4, 2020 M | 1,410,637 | 0 | 0 | $0 |
| William A Blase JR | SEVP-HR Transition | Dec. 31, 2019 A | 9,413 | 0 | 0 | $0 |
| Robert W. Quinn Jr. | Sr.EVP-External & Leg. Affairs | April 30, 2018 A | 17,406 | 0 | 0 | $0 |
| Rafael De La Vega | Vice Chairman | Dec. 30, 2016 A | 330,950 | 0 | 0 | $0 |
| James W Cicconi | SrEVP-Ext & Legis Affairs | Sept. 30, 2016 F | 348,457 | 0 | 0 | $0 |
| Donald W Watts | Sr. Exec. VP and Gen. Counsel | Sept. 30, 2015 A | 100,567 | 0 | 0 | $0 |
| Catherine M Coughlin | Sr. Exec. Vice President | March 31, 2015 A | 43,296 | 0 | 0 | $0 |
| Forrest E Miller | Grp.Pres.-Corp. Strat. & Dev. | March 30, 2012 A | 56,224 | 0 | 0 | $0 |
| James W Callaway | Sr.Exec.VP-Exec. Oprs. | Aug. 31, 2010 A | 1,349 | 0 | 0 | $0 |
| James S Kahan | Sr. Exec. VP-Corp. Dev. | June 29, 2007 A | 20,493 | 0 | 0 | $0 |
| James D Ellis | Sr.Exec.VP and Gen.Cnsl. | May 31, 2007 A | 28,595 | 0 | 0 | $0 |
| Karen E Jennings | SrEVP-Adv. & Corp. Comm. | May 31, 2007 A | 45,996 | 0 | 0 | $0 |
| Kelly J Grier | Director | April 30, 2026 A | — | 0 | 0 | $0 |
| Marissa A Mayer | Director | April 30, 2026 A | — | 0 | 0 | $0 |
| Luis A Ubinas | Director | April 30, 2026 A | — | 0 | 0 | $0 |
| Stephen J Luczo | Director | April 30, 2026 A | 395,500 | 0 | 0 | $0 |
| Beth E Mooney | Director | April 30, 2026 A | 28,700 | 0 | 0 | $0 |
| Matthew K Rose | Director | April 30, 2026 A | 98,100 | 0 | 0 | $0 |
| Cindy B Taylor | Director | April 30, 2026 A | 320 | 0 | 0 | $0 |
| William E Kennard | Director | April 30, 2026 A | — | 0 | 0 | $0 |
| Michael B Mccallister | Director | April 30, 2026 A | 62,076 | 0 | 0 | $0 |
| Scott T Ford | Director | July 31, 2025 A | 81,319 | 0 | 0 | $0 |
| Glenn H Hutchins | Director | April 30, 2025 A | 164,329 | 0 | 0 | $0 |
| Samuel A Di Piazza Jr. | Director | April 29, 2022 A | 3,075 | 0 | 0 | $0 |
Insiders from SEC Form 3/4/5 filings; net = open-market P/S only
Activists & 5%+ owners 11 positions
Investors who filed SEC Schedule 13D — beneficial ownership above 5% with an intent to influence the issuer (activist stakes, board campaigns, M&A). Each row shows the most recent known state of that filer's position.
| Filer | Filed | Stake | Status | Purpose | Filing |
|---|---|---|---|---|---|
| AT&T Inc., Warner Media, LLC (as successor by merger to Time Warner Inc.), TW Media Holdings LLC, Time Warner Media Holdings B.V. ×13 filings | Oct. 15, 2020 | — | Initial filing | M&A / sale | SEC |
| AT&T Inc. (2) | Aug. 13, 2012 | — | Initial filing | M&A / sale | SEC |
| AT&T Inc. (formerly known as SBC Communications Inc.), AT&T International, Inc. (formerly known as SBC International, Inc.) ×2 filings | Nov. 14, 2011 | — | Initial filing | — | SEC |
| AT&T Inc. (formerly known as SBC Communications, Inc.), AT&T International, Inc. (formerly known as SBC International, Inc.) ×7 filings | Aug. 2, 2011 | — | Initial filing | M&A / sale | SEC |
| SBC Communications Inc., SBC Teleholdings, Inc. f/k/a Ameritech Corporation, Ameritech International, Inc., Ameritech International Denmark Corporation, Ameritech Denmark Funding Corporation, Ameritech Denmark Holdings, L.L.C., Ameritech Luxembourg S.a.r.l. ×2 filings | Nov. 4, 2004 | — | Initial filing | — | SEC |
| Undisclosed reporting person, Undisclosed reporting person | Aug. 2, 2002 | — | Initial filing | — | SEC |
| Undisclosed reporting person, Undisclosed reporting person | Sept. 24, 2001 | — | Initial filing | — | SEC |
| Undisclosed reporting person | June 28, 2001 | — | Initial filing | — | SEC |
| Undisclosed reporting person | Feb. 22, 2001 | — | Initial filing | — | SEC |
| Undisclosed reporting person | Jan. 10, 2001 | — | Initial filing | — | SEC |
| Undisclosed reporting person, Undisclosed reporting person | Jan. 4, 2001 | — | Initial filing | — | SEC |
Purpose is an automated classification of the filer's own stated purpose (SEC Item 4) — not investment advice. "—" means no clear purpose was stated or the text could not be classified.
ETF ownership Held by 293 ETFs
Weight reflects direct equity holdings (N-PORT) only; leveraged or derivative-based funds may hold additional swap exposure not shown.
| Fund | Weight | Units | As of | Source |
|---|---|---|---|---|
| GOVI · Invesco Exchange-Traded Fund Trust … | 97.94% | 1,461,184,500 | Aug. 21, 2026 | Daily |
| TBLL · Invesco Exchange-Traded Fund Trust … | 36.94% | 951,987,900 | Aug. 21, 2026 | Daily |
| GTO · Invesco Actively Managed Exchange-T… | 15.23% | 465,377,000 | Aug. 21, 2026 | Daily |
| RDIV · Invesco Exchange-Traded Fund Trust … | 5.32% | 2,990,929 SH | Aug. 21, 2026 | Daily |
| IYZ · iShares Trust | 5.14% | 2,539,295 SH | Aug. 21, 2026 | Daily |
| IXP · iShares Trust | 4.93% | 1,098,255 SH | Aug. 21, 2026 | Daily |
| RSPC · Invesco Exchange-Traded Fund Trust | 4.85% | 112,051 SH | Aug. 21, 2026 | Daily |
| FCOM · FIDELITY COVINGTON TRUST | 3.88% | 2,617,909 NS | April 30, 2026 | N-PORT |
| VOX · VANGUARD WORLD FUND | 3.87% | 11,184,937 SH | Aug. 19, 2026 | Daily |
| SIXH · EXCHANGE TRADED CONCEPTS TRUST | 3.73% | 815,281 NS | May 31, 2026 | N-PORT |
| SIXA · EXCHANGE TRADED CONCEPTS TRUST | 3.72% | 730,513 NS | May 31, 2026 | N-PORT |
| GSY · Invesco Actively Managed Exchange-T… | 3.17% | 123,000,000 | Aug. 21, 2026 | Daily |
| GEND · Spinnaker ETF Series | 2.99% | 5,118 NS | April 30, 2026 | N-PORT |
| DIVY · Tidal Trust I | 2.97% | 34,066 NS | May 31, 2026 | N-PORT |
| PGX · Invesco Exchange-Traded Fund Trust … | 2.96% | 6,206,070 | Aug. 21, 2026 | Daily |
| TEXN · iShares Trust | 2.85% | 19,621 SH | Aug. 21, 2026 | Daily |
| STNC · Hennessy Funds Trust | 2.66% | 93,438 NS | April 30, 2026 | N-PORT |
| WLDR · Two Roads Shared Trust | 2.65% | 72,251 NS | April 30, 2026 | N-PORT |
| VLUE · iShares Trust | 2.62% | 10,174,240 SH | Aug. 21, 2026 | Daily |
| SPHD · Invesco Exchange-Traded Fund Trust … | 2.57% | 3,528,564 SH | Aug. 21, 2026 | Daily |
| GXPC · Global X Funds | 2.54% | 95,343 NS | May 31, 2026 | N-PORT |
| VEGN · ETF Series Solutions | 2.51% | 148,986 NS | April 30, 2026 | N-PORT |
| GTOS · Invesco Actively Managed Exchange-T… | 2.49% | 3,112,100 | Aug. 21, 2026 | Daily |
| NFRA · FlexShares Trust | 2.40% | 2,819,264 NS | April 30, 2026 | N-PORT |
| DDIV · First Trust Exchange-Traded Fund VI | 2.28% | 74,452 NS | June 30, 2026 | N-PORT |
| LTL · ProShares Trust | 2.20% | 7,081 NS | May 31, 2026 | N-PORT |
| BMVP · Invesco Exchange-Traded Fund Trust | 2.07% | 86,625 SH | Aug. 21, 2026 | Daily |
| SPDV · ETF Series Solutions | 2.02% | 69,702 NS | April 30, 2026 | N-PORT |
| DVOL · First Trust Exchange-Traded Fund VI | 2.02% | 69,353 NS | June 30, 2026 | N-PORT |
| LYLD · Cambria ETF Trust | 1.99% | 4,591 NS | April 30, 2026 | N-PORT |
| DVLU · First Trust Exchange-Traded Fund VI | 1.91% | 42,094 NS | June 30, 2026 | N-PORT |
| AUSF · Global X Funds | 1.90% | 649,029 NS | May 31, 2026 | N-PORT |
| COWZ · Pacer Funds Trust | 1.84% | 12,803,927 NS | April 30, 2026 | N-PORT |
| QQWZ · Pacer Funds Trust | 1.84% | 32,913 NS | April 30, 2026 | N-PORT |
| KNCT · Invesco Exchange-Traded Fund Trust | 1.84% | 117,005 SH | Aug. 21, 2026 | Daily |
| SPVU · Invesco Exchange-Traded Fund Trust … | 1.83% | 99,674 NS | May 31, 2026 | N-PORT |
| QDIV · Global X Funds | 1.82% | 24,027 NS | May 31, 2026 | N-PORT |
| GCOW · Pacer Funds Trust | 1.81% | 2,321,164 NS | April 30, 2026 | N-PORT |
| DIV · Global X Funds | 1.81% | 518,859 NS | April 30, 2026 | N-PORT |
| TDIV · First Trust Exchange-Traded Fund VI | 1.79% | 3,815,726 NS | June 30, 2026 | N-PORT |
| PALC · Pacer Funds Trust | 1.77% | 155,711 NS | April 30, 2026 | N-PORT |
| TDVI · First Trust Exchange-Traded Fund IV | 1.70% | 271,258 NS | April 30, 2026 | N-PORT |
| SDOG · ALPS ETF Trust | 1.69% | 941,701 NS | May 31, 2026 | N-PORT |
| VLLU · Harbor ETF Trust | 1.67% | 2,776 NS | April 30, 2026 | N-PORT |
| GMOV · GMO ETF Trust | 1.63% | 59,814 NS | May 31, 2026 | N-PORT |
| XAIX · DBX ETF Trust | 1.54% | 96,560 NS | May 31, 2026 | N-PORT |
| PFF · iShares Trust | 1.45% | 10,563,596 SH | Aug. 21, 2026 | Daily |
| ITAN · EA Series Trust | 1.42% | 51,088 NS | May 29, 2026 | N-PORT |
| RFDA · ALPS ETF Trust | 1.36% | 47,812 NS | May 31, 2026 | N-PORT |
| RGEF · Tidal Trust III | 1.32% | 400,034 NS | April 30, 2026 | N-PORT |