
CLX Clorox Company (The) Common Stock
NYSE · Consumer products · Auf SEC EDGAR ansehen ↗ 10-K/10-Q Aug 7, 2026CLX Aktien-Snapshot Kurs, Marktkapitalisierung, P/E, EPS, ROE, Schulden/Eigenkapital, 52-Wochen-Spanne
CLX Aktienkurs-Chart Täglich OHLCV mit technischen Indikatoren — Schwenken, Zoom und Ansicht anpassen
Die Balkengranularität passt sich der ausgewählten Periode an – bewegen Sie den Mauszeiger über das Diagramm, um Eröffnungs-/Höchst-/Tiefst-/Schlusskurse für einen Balken anzuzeigen.
| Ex-Datum | Split | Typ |
|---|---|---|
| 24. August 1999 | 2-for-1 | Vorwärts |
| 3. September 1997 | 2-for-1 | Vorwärts |
| 2. Juni 1987 | 2-for-1 | Vorwärts |
Über Clorox Company (The) Common Stock Unternehmensübersicht von Wikipedia
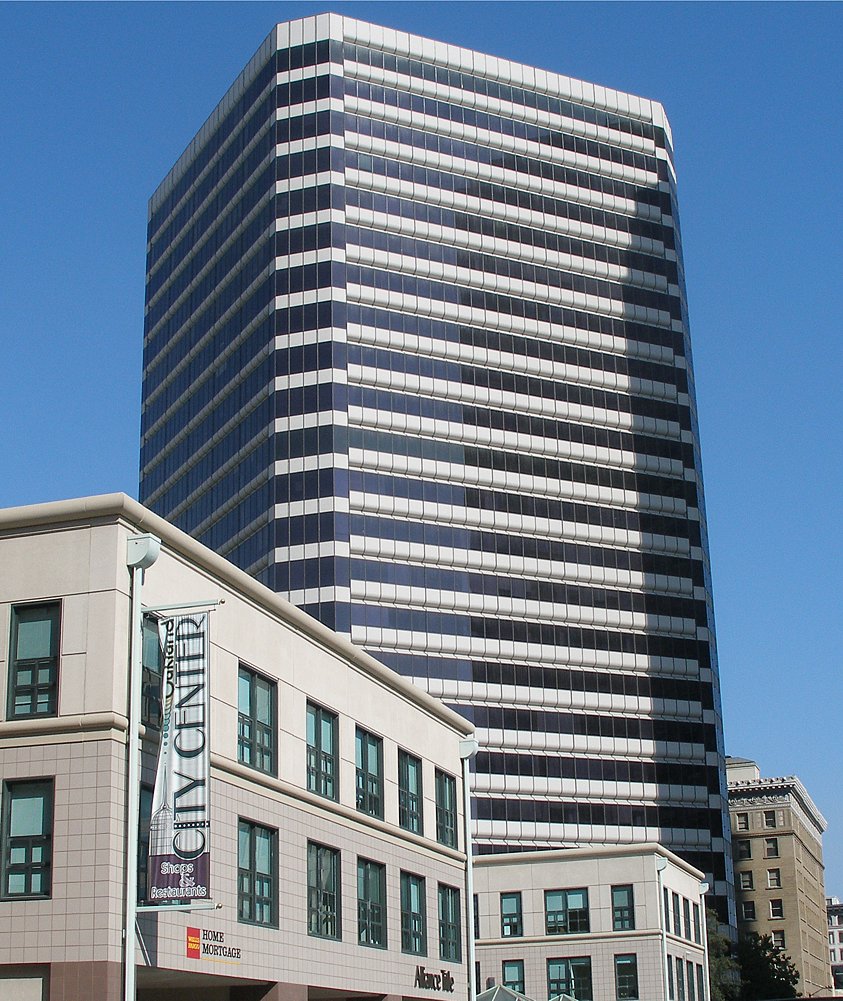
Die Clorox Company ist ein Haushaltswaren- und Chemieunternehmen aus den Vereinigten Staaten mit Hauptsitz in Oakland, Kalifornien. Das Unternehmen ist im Aktienindex S&P 500 gelistet.
Das Unternehmen ist insbesondere für das Bleichmittel der Marke Clorox bekannt.
Unternehmensgeschichte
Das Unternehmen wurde am 3. Mai 1913 durch Archibald Taft, Edward Hughes, Charles Husband, Rufus Myers und William Hussey gegründet. Das Unternehmen hatte anfangs den Firmennamen Electro-Alkaline Company. 1928 ging das Unternehmen an die Börse in San Francisco und änderte den Firmennamen zu Clorox Chemical Company.
1957 wurde das Unternehmen von dem Konkurrenten Procter & Gamble gekauft. Der Kauf wurde jedoch von der US-amerikanischen Federal Trade Commission (FTC) untersagt, da die FTC im Haushaltswarenmarkt der Vereinigten Staaten eine Monopolstellung von Procter & Gamble befürchtete. Die FTC gewann diesen Streit und 1969 wurde Clorox wieder ein unabhängiges Unternehmen.
Verbraucherschutz
2011 gab Clorox bekannt, sämtliche Inhaltsstoffe seiner Produkte, einschließlich verwendeter Konservierungs-, Farb- und Duftstoffe, zu veröffentlichen.
Geschäftszahlen
Im Geschäftsjahr 2016, das bei Clorox am 30. Juni 2016 endete, erzielte das Unternehmen einen Umsatz von 5,76 Mrd. Clorox beschäftigt ca. 8.000 Mitarbeiter.
Produktmarken
Zu Clorox gehören mehrere in den Vereinigten Staaten bekannte Haushaltsmarken verschiedener Produktrichtungen, unter anderem:
Brita-Wasserfiltersysteme (Nord- und Südamerikageschäft)
Burt’s Bees (Naturkosmetik)
Clorox, Reinigungsmittel
Glad
Hidden Valley Ranch, Kitchen Bouquet und KC Masterpiece (Salatdressings und Soßen)
Kingsford (Holzkohle)
Lestoil, Pine-Sol, Tilex und S.O.S. (Reinigungsprodukte)
Liquid-Plumr
Formula 409
Fresh Step, EverClean, Scoop Away
Quelle: Wikipedia, CC BY-SA 4.0 · Auf Wikipedia ansehen ↗
10-Jahres-Performance Umsatz-, Nettoergebnis-, Margen- und EPS-Trends
Bewertung P/E-, P/S-, P/B-, EV/EBITDA-Verhältnisse — ist die Aktie teuer oder günstig?
| Kennzahl | 5-Jahres-Trend | CLX | 5-Jahres-Durchschnitt | Peer-Median | Fazit |
|---|---|---|---|---|---|
| P/E (TTM) | 18.05-Jahres-Durchschnitt ≈53.8 | ≈53.8 | · | · | |
| P/S (TTM) | 1.65-Jahres-Durchschnitt ≈2.3 | ≈2.3 | · | · | |
| K/B (MRQ) | 116.15-Jahres-Durchschnitt ≈69.3 | ≈69.3 | · | · | |
| EV / EBITDA | 62.25-Jahres-Durchschnitt ≈81.6 | ≈81.6 | · | · | |
| Kurs / FCF (TTM) | 25.85-Jahres-Durchschnitt ≈27.3 | ≈27.3 | · | · | |
| Kurs / Cashflow (TTM) | 17.15-Jahres-Durchschnitt ≈19.5 | ≈19.5 | · | · | |
| EV / Revenue (EV / Umsatz) | 2.35-Jahres-Durchschnitt ≈2.7 | ≈2.7 | · | · | |
| EV / FCF | 38.05-Jahres-Durchschnitt ≈32.7 | ≈32.7 | · | · |
Der Median der Vergleichsgruppe wird pro Kennzahl standardisiert berechnet und stimmt möglicherweise nicht immer mit der für diese Aktie angezeigten TTM/MRQ-Basis überein.
Rentabilität Brutto-, Betriebs- und Nettomargen; ROE, ROA, ROIC
| Kennzahl | 5-Jahres-Trend | CLX | 5-Jahres-Durchschnitt | Peer-Median | Fazit |
|---|---|---|---|---|---|
| Bruttogewinnmarge (TTM) | 42.3%5-Jahres-Durchschnitt ≈41.1% | ≈41.1% | · | · | |
| EBITDA Margin (EBITDA-Marge) | 3.7%5-Jahres-Durchschnitt ≈3.3% | ≈3.3% | · | · | |
| Vorgewinnmarge (TTM) | 11.8%5-Jahres-Durchschnitt ≈8.9% | ≈8.9% | · | · | |
| Nettogewinnmarge (TTM) | 8.7%5-Jahres-Durchschnitt ≈6.5% | ≈6.5% | · | · | |
| ROA (TTM) | 8.8%5-Jahres-Durchschnitt ≈7.6% | ≈7.6% | · | · | |
| ROE (TTM) | 285.6%5-Jahres-Durchschnitt ≈154.3% | ≈154.3% | · | · |
Finanzielle Gesundheit Verschuldung, Liquidität, Solvenz — Bilanzstärke
| Kennzahl | 5-Jahres-Trend | CLX | 5-Jahres-Durchschnitt | Peer-Median | Fazit |
|---|---|---|---|---|---|
| Debt / Equity (Fremdkapital / Eigenkapital) | 56.35-Jahres-Durchschnitt ≈17.6 | ≈17.6 | · | · | |
| Liquiditätsgrad (MRQ) | 0.75-Jahres-Durchschnitt ≈0.9 | ≈0.9 | · | · | |
| Quick Ratio | 0.35-Jahres-Durchschnitt ≈0.5 | ≈0.5 | · | · | |
| Langfristige Schulden / Eigenkapital (MRQ) | 44.25-Jahres-Durchschnitt ≈15.0 | ≈15.0 | · | · |
Wachstum Umsatz-, EPS- und Nettoergebniswachstum: YoY, 3-Jahres-CAGR, 5-Jahres-CAGR
| Kennzahl | 5-Jahres-Trend | CLX | 5-Jahres-Durchschnitt | Peer-Median | Fazit |
|---|---|---|---|---|---|
| Revenue YoY (Umsatz YoY) | -5.4%5-Jahres-Durchschnitt ≈-1.7% | ≈-1.7% | · | · | |
| Revenue CAGR 3Y (Umsatz CAGR 3J) | -3.1%5-Jahres-Durchschnitt ≈-0.26% | ≈-0.26% | · | · | |
| Revenue CAGR 5Y (Umsatz CAGR 5J) | -1.8% | · | · | · | |
| EPS YoY (EPS VjV) | -26.2%5-Jahres-Durchschnitt ≈30.0% | ≈30.0% | · | · | |
| Net Income YoY (Nettogewinn YoY) | -27.5%5-Jahres-Durchschnitt ≈29.4% | ≈29.4% | · | · | |
| EPS CAGR 3Y (EPS CAGR 3J) | 58.9%5-Jahres-Durchschnitt ≈2.0% | ≈2.0% | · | · | |
| EPS CAGR 5Y (EPS CAGR 5J) | -2.9% | · | · | · | |
| Net Income CAGR 3Y (Nettoergebnis CAGR 3J) | 57.9%5-Jahres-Durchschnitt ≈1.5% | ≈1.5% | · | · | |
| Net Income CAGR 5Y (Nettoergebnis CAGR 5J) | -3.7% | · | · | · |
Kapitaleffizienz Umsatz pro Vermögenswert, Lagerumschlag, Forderungsumschlag
| Kennzahl | 5-Jahres-Trend | CLX | 5-Jahres-Durchschnitt | Peer-Median | Fazit |
|---|---|---|---|---|---|
| Asset Turnover (Umsatz / Vermögenswerte) | 1.05-Jahres-Durchschnitt ≈1.2 | ≈1.2 | · | · | |
| Inventory Turnover (Lagerumschlag) | 6.05-Jahres-Durchschnitt ≈6.2 | ≈6.2 | · | · | |
| Receivables Turnover (Forderungsumschlag) | 8.35-Jahres-Durchschnitt ≈10.0 | ≈10.0 | · | · | |
| Revenue / Employee (Umsatz / Mitarbeiter) | ≈$730.4K | · | · | · |
Wert · ≈ 5-Jahres-Durchschnitt · Branchenmedian · Urteil relativ zum Median
Dividenden Rendite, Ausschüttungsquote, Dividendenhistorie, 5-Jahres-CAGR
| Ex-Datum | Betrag | Währung | Rendite |
|---|---|---|---|
| Aug 12, 2026 | $1,25 | USD | ≈4.7% |
| Apr 22, 2026 | $1,24 | USD | ≈5.1% |
| Jan 28, 2026 | $1,24 | USD | ≈4.5% |
| Okt 22, 2025 | $1,24 | USD | ≈4.2% |
| Aug 13, 2025 | $1,24 | USD | ≈4.0% |
| Apr 23, 2025 | $1,22 | USD | ≈3.5% |
| Jan 29, 2025 | $1,22 | USD | ≈3.1% |
| Okt 23, 2024 | $1,22 | USD | ≈3.0% |
| Aug 14, 2024 | $1,22 | USD | ≈3.3% |
| Apr 23, 2024 | $1,20 | USD | ≈3.3% |
| Jan 23, 2024 | $1,20 | USD | ≈3.3% |
| Okt 24, 2023 | $1,20 | USD | ≈3.9% |
| Aug 8, 2023 | $1,20 | USD | ≈2.9% |
| Apr 25, 2023 | $1,18 | USD | ≈2.9% |
| Jan 24, 2023 | $1,18 | USD | ≈3.3% |
| Okt 25, 2022 | $1,18 | USD | ≈3.3% |
| Jul 26, 2022 | $1,18 | USD | ≈3.2% |
| Apr 26, 2022 | $1,16 | USD | ≈3.2% |
| Jan 25, 2022 | $1,16 | USD | ≈2.6% |
| Okt 26, 2021 | $1,16 | USD | ≈2.8% |
Ergebnisverlauf EPS Ist vs. Schätzung, Überraschung %, Beat-Rate, nächstes Ergebnisdatum
| Zeitraum | Bericht | EPS Actual | EPS est. | Überraschung |
|---|---|---|---|---|
| 30. Juni 2026 | $1.66 | $1.67 | -0.49% | |
| 31. März 2026 | $1.64 | $1.57 | 4.7% | |
| 31. Dezember 2025 | $1.39 | $1.45 | -4.0% | |
| 30. September 2025 | $0.85 | $0.79 | 7.0% | |
| 30. Juni 2025 | $2.87 | $2.23 | 28.7% | |
| 31. März 2025 | $1.45 | $1.58 | -8.3% |
Vollständige Fundamentaldaten Alle Kennzahlen nach Jahr — Gewinn- und Verlustrechnung, Bilanz, Cashflow
Gewinn- und Verlustrechnung
| Kennzahl | Trend | 2026 | 2025 | 2024 | 2023 | 2022 | 2021 | 2020 | 2019 | 2018 | 2017 | 2016 | 2015 |
|---|---|---|---|---|---|---|---|---|---|---|---|---|---|
| Revenue | $6.72B | $7.10B | $7.09B | $7.39B | $7.11B | $7.34B | $6.72B | · | $6.12B | $5.97B | $5.76B | $5.66B | |
| Cost of Revenue | $3.88B | $3.89B | $4.04B | $4.48B | $4.56B | $4.14B | $3.66B | $3.49B | $3.45B | $3.30B | $3.16B | $3.19B | |
| Gross Profit | $2.84B | $3.21B | $3.05B | $2.91B | $2.54B | $3.20B | $3.06B | $2.73B | $2.67B | $2.67B | $2.60B | $2.46B | |
| R&D Expense | $116M | $121M | $126M | $138M | $132M | $149M | $145M | $136M | $132M | $135M | $141M | $136M | |
| SG&A Expense | $1.07B | $1.12B | $1.17B | $1.18B | $954M | $1.00B | $969M | $856M | $837M | $810M | $806M | $798M | |
| Interest Expense | $130M | $88M | $90M | $90M | $106M | $99M | $99M | $97M | $85M | $88M | $88M | $100M | |
| Interest Income | · | · | · | · | · | · | · | · | · | · | · | $4M | |
| Other Non-op | · | · | · | · | · | · | · | · | · | · | $7M | $13M | |
| Pretax Income | $791M | $1.08B | $398M | $238M | $607M | $900M | $1.19B | $1.02B | $1.05B | $1.03B | $983M | $921M | |
| Income Tax | $190M | $254M | $106M | $77M | $136M | $181M | $246M | $204M | $231M | $330M | $335M | $315M | |
| Net Income | $587M | $810M | $280M | $149M | $462M | $710M | $939M | $820M | $823M | $701M | $648M | $580M | |
| EPS (Basic) | $4.82 | $6.56 | $2.26 | $1.21 | $3.75 | $5.66 | $7.46 | $6.42 | $6.37 | $5.43 | $5.01 | $4.45 | |
| EPS (Diluted) | $4.81 | $6.52 | $2.25 | $1.20 | $3.73 | $5.58 | $7.36 | $6.32 | $6.26 | $5.33 | $4.92 | $4.37 | |
| Shares (Basic) | 121,775,000 | 123,525,000 | 124,174,000 | 123,589,000 | 123,113,000 | 125,570,000 | 125,828,000 | 127,734,000 | 129,293,000 | 128,953,000 | 129,472,000 | 130,310,000 | |
| Shares (Diluted) | 122,132,000 | 124,287,000 | 124,804,000 | 124,181,000 | 123,906,000 | 127,299,000 | 127,671,000 | 129,792,000 | 131,581,000 | 131,566,000 | 131,717,000 | 132,776,000 | |
| EBITDA | $247M | $219M | $235M | $236M | $224M | $211M | $180M | $180M | $166M | $163M | · | · |
Bilanz
| Kennzahl | Trend | 2026 | 2025 | 2024 | 2023 | 2022 | 2021 | 2020 | 2019 | 2018 | 2017 | 2016 | 2015 |
|---|---|---|---|---|---|---|---|---|---|---|---|---|---|
| Cash & Equivalents | $143M | $167M | $202M | $367M | $183M | $319M | $871M | $111M | $131M | $418M | $401M | $382M | |
| Receivables | $791M | $821M | $695M | $688M | $681M | $604M | $648M | $631M | $600M | $565M | $569M | $519M | |
| Inventory | $777M | $523M | $637M | $696M | $755M | $752M | $454M | $512M | $506M | $459M | $443M | $385M | |
| Prepaid Expense | $113M | $97M | $88M | $77M | $106M | $154M | $47M | $51M | $74M | $72M | $72M | $39M | |
| Other Current Assets | · | · | · | · | · | · | · | · | · | · | $72M | $143M | |
| Current Assets | $1.82B | $1.61B | $1.62B | $1.83B | $1.73B | $1.83B | $2.02B | $1.30B | $1.31B | $1.51B | $1.49B | $1.43B | |
| PP&E (Net) | $1.51B | $1.27B | $1.31B | $1.34B | $1.33B | $1.30B | $1.10B | $1.03B | $996M | $931M | $906M | $918M | |
| PP&E (Gross) | $4.61B | $4.18B | $4.14B | $4.05B | $3.86B | $3.68B | $3.33B | $3.18B | $3.06B | $2.93B | $2.82B | $2.76B | |
| Accum. Depreciation | $3.10B | $2.91B | $2.82B | $2.71B | $2.53B | $2.38B | $2.22B | $2.15B | $2.06B | $2.00B | $1.91B | $1.84B | |
| Goodwill | $1.95B | $1.23B | $1.23B | $1.25B | $1.56B | $1.57B | $1.58B | $1.59B | $1.60B | $1.20B | $1.20B | $1.07B | |
| Intangibles | · | $566M | $681M | $712M | $884M | $918M | $894M | $912M | $929M | $722M | $735M | $585M | |
| Other Non-current Assets | $517M | $558M | $545M | $462M | $315M | $378M | $328M | $274M | $222M | $210M | $187M | $165M | |
| Total Assets | $7.79B | $5.56B | $5.75B | $5.95B | $6.16B | $6.33B | $6.21B | $5.12B | $5.06B | $4.57B | $4.51B | $4.15B | |
| Accounts Payable | $996M | $838M | $950M | $1.02B | $960M | $930M | $575M | $507M | $507M | $501M | $490M | $431M | |
| Accrued Liabilities | · | · | · | · | · | · | · | · | · | · | · | $548M | |
| Short-term Debt | $1.09B | $4M | $4M | $50M | $237M | $0 | $0 | $396M | $199M | $404M | $523M | $95M | |
| Current Liabilities | $2.77B | $1.92B | $1.57B | $1.92B | $1.78B | $2.06B | $1.42B | $1.44B | $1.20B | $1.81B | $1.56B | $1.41B | |
| Capital Leases | $366M | $305M | $334M | $310M | $314M | $301M | $278M | · | · | · | · | · | |
| Deferred Tax | $17M | $20M | $22M | $28M | $66M | $67M | $62M | $50M | $72M | $61M | $82M | $95M | |
| Other Non-current Liabilities | $405M | $351M | $848M | $825M | $791M | $834M | $767M | $780M | $102M | $113M | $107M | $119M | |
| Total Liabilities | $7.54B | $5.08B | $5.26B | $5.56B | $5.43B | $5.74B | $5.30B | $4.56B | $4.33B | $4.03B | $4.21B | $4.05B | |
| Long-term Debt | $3.98B | $2.48B | $2.48B | $2.48B | $2.47B | $2.78B | $2.78B | $2.29B | $2.28B | $1.79B | $1.79B | $2.10B | |
| Total Debt | $5.07B | $2.49B | $2.48B | $2.53B | $2.71B | $2.78B | $2.78B | $2.68B | $2.48B | $2.19B | · | $2.19B | |
| Common Stock | $131M | $131M | $131M | $131M | $131M | $131M | $159M | $159M | $159M | $159M | $159M | $159M | |
| Retained Earnings | $386M | $432M | $250M | $583M | $1.05B | $1.04B | $3.57B | $3.15B | $2.80B | $2.44B | $2.16B | $1.92B | |
| Treasury Stock | $1.58B | $1.40B | $1.19B | $1.25B | $1.35B | $1.40B | $3.31B | $3.19B | $2.66B | $2.44B | $2.32B | $2.24B | |
| AOCI | $-157M | $-157M | $-155M | $-493M | $-479M | $-546M | $-640M | $-602M | $-547M | $-543M | $-570M | $-502M | |
| Stockholders' Equity | $90M | $321M | $328M | $220M | $556M | $411M | $908M | $559M | $726M | $542M | $297M | $118M | |
| Liabilities + Equity | $7.79B | $5.56B | $5.75B | $5.95B | $6.16B | $6.33B | $6.21B | $5.12B | $5.06B | $4.57B | $4.51B | $4.16B | |
| Shares Outstanding | 120,926,454 | 122,694,263 | 130,741,000 | 130,741,000 | 130,741,000 | 130,741,000 | 158,741,000 | 158,741,000 | 127,982,767 | 129,014,172 | 129,355,263 | 128,614,310 |
Cashflow
| Kennzahl | Trend | 2026 | 2025 | 2024 | 2023 | 2022 | 2021 | 2020 | 2019 | 2018 | 2017 | 2016 | 2015 |
|---|---|---|---|---|---|---|---|---|---|---|---|---|---|
| D&A | $247M | $219M | $235M | $236M | $224M | $211M | $180M | $180M | $166M | $163M | $165M | $169M | |
| Stock-based Comp | $48M | $81M | $74M | $73M | $52M | $50M | $50M | $43M | $53M | $51M | $45M | $32M | |
| Deferred Tax | $81M | $-18M | $-100M | $-149M | $5M | $-32M | $-2M | $-20M | $-23M | $-35M | $5M | $-16M | |
| Amort. of Intangibles | $28M | $21M | $29M | $30M | $31M | $32M | $14M | $15M | $10M | $10M | $8M | $12M | |
| Restructuring | · | $0 | $29M | $71M | · | · | · | · | · | · | · | $2M | |
| Other Non-cash | $-351M | $-111M | $206M | $849M | $43M | $337M | $379M | $-31M | $-45M | $-12M | · | · | |
| Operating Cash Flow | $612M | $981M | $695M | $1.16B | $786M | $1.28B | $1.55B | $992M | $976M | $865M | $778M | $874M | |
| CapEx | $207M | $220M | $212M | $228M | $251M | $331M | $254M | $206M | $194M | $231M | $172M | $125M | |
| Investing Cash Flow | $-2.30B | $-94M | $-175M | $-223M | $-229M | $-452M | $-252M | $-196M | $-859M | $-205M | $-430M | $-106M | |
| Debt Issued | · | · | $0 | $0 | $1.08B | $0 | $492M | $0 | $891M | $0 | $0 | $495M | |
| Net Debt Issued | · | · | $0 | $0 | $-320M | $0 | $492M | $0 | $491M | $0 | · | $-80M | |
| Stock Repurchased | $256M | $332M | $0 | $0 | $25M | $905M | $248M | $661M | $271M | $183M | $254M | $434M | |
| Net Stock Activity | $-256M | $-332M | $0 | $0 | $-25M | $-905M | $-248M | $-661M | $-271M | $-183M | · | $-434M | |
| Dividends Paid | $602M | $602M | $595M | $583M | $571M | $558M | $533M | $490M | $450M | $412M | $398M | $385M | |
| Financing Cash Flow | $1.67B | $-924M | $-655M | $-753M | $-689M | $-1.39B | $-523M | $-815M | $-399M | $-645M | $-316M | $-696M | |
| Net Change in Cash | $-23M | $-37M | $-161M | $182M | $-138M | $-555M | $766M | $-21M | $-285M | $14M | $19M | $53M | |
| Taxes Paid | $104M | $264M | $347M | $73M | $100M | $303M | $241M | $207M | $245M | $347M | $323M | $236M | |
| Free Cash Flow | $405M | $761M | $483M | $930M | $535M | $945M | $1.29B | $786M | $780M | $637M | · | $749M | |
| Levered FCF | $306M | $694M | $417M | $869M | $453M | $866M | $1.21B | $708M | $714M | $577M | · | · |
Rentabilität
| Kennzahl | Trend | 2026 | 2025 | 2024 | 2023 | 2022 | 2021 | 2020 | 2019 | 2018 | 2017 | 2016 | 2015 |
|---|---|---|---|---|---|---|---|---|---|---|---|---|---|
| Gross Margin | 42.3% | 45.2% | 43.0% | 39.4% | 35.8% | · | · | · | 43.7% | 44.7% | · | 43.6% | |
| Net Margin | 8.7% | 11.4% | 4.0% | 2.0% | 6.5% | · | · | · | 13.4% | 11.7% | · | 10.3% | |
| Pretax Margin | 11.8% | 15.2% | 5.6% | 3.2% | 8.5% | · | · | · | 17.2% | 17.3% | · | · | |
| EBITDA Margin | 3.7% | 3.1% | 3.3% | 3.2% | 3.1% | · | · | · | 2.7% | 2.7% | · | · | |
| ROA | 8.8% | 14.3% | 4.8% | 2.5% | 7.4% | 11.3% | 16.6% | 16.1% | 17.1% | 15.4% | · | 13.8% | |
| ROE | 285.6% | 249.6% | 102.2% | 38.4% | 95.5% | 107.7% | 128.4% | 122.4% | 105.3% | 167.1% | · | 426.5% |
Liquidität & Solvenz
| Kennzahl | Trend | 2026 | 2025 | 2024 | 2023 | 2022 | 2021 | 2020 | 2019 | 2018 | 2017 | 2016 | 2015 |
|---|---|---|---|---|---|---|---|---|---|---|---|---|---|
| Current Ratio | 0.7 | 0.8 | 1.0 | 1.0 | 1.0 | 0.9 | 1.4 | 0.9 | 1.1 | 0.8 | · | 1.0 | |
| Quick Ratio | 0.3 | 0.5 | 0.6 | 0.6 | 0.5 | 0.4 | 1.1 | 0.5 | 0.6 | 0.5 | · | 0.6 | |
| Debt / Equity | 56.3 | 7.8 | 7.6 | 11.5 | 4.9 | 6.8 | 3.1 | 4.8 | 3.4 | 4.0 | · | 18.6 | |
| LT Debt / Equity | 44.2 | 7.7 | 7.6 | 11.3 | 4.4 | 6.0 | 3.1 | 4.1 | 3.1 | 2.6 | · | 15.2 |
Effizienz
| Kennzahl | Trend | 2026 | 2025 | 2024 | 2023 | 2022 | 2021 | 2020 | 2019 | 2018 | 2017 | 2016 | 2015 |
|---|---|---|---|---|---|---|---|---|---|---|---|---|---|
| Asset Turnover | 1.0 | 1.3 | 1.2 | 1.2 | 1.1 | · | · | · | 1.3 | 1.3 | · | 1.3 | |
| Inventory Turnover | 6.0 | 6.7 | 6.1 | 6.2 | 6.1 | 6.9 | 7.6 | 6.8 | 7.1 | 7.3 | · | 8.3 | |
| Receivables Turnover | 8.3 | 9.4 | 10.3 | 10.8 | 11.1 | · | · | · | 10.5 | 10.5 | · | 10.6 |
Pro Aktie
| Kennzahl | Trend | 2026 | 2025 | 2024 | 2023 | 2022 | 2021 | 2020 | 2019 | 2018 | 2017 | 2016 | 2015 |
|---|---|---|---|---|---|---|---|---|---|---|---|---|---|
| Book Value / Share | $0.74 | $2.62 | $2.64 | $1.78 | $4.51 | $3.35 | $7.20 | $4.45 | $5.67 | $4.20 | · | $0.92 | |
| Revenue / Share | $55.02 | $57.16 | $56.83 | $59.50 | $57.36 | · | · | · | $46.54 | $45.40 | · | $42.59 | |
| Cash Flow / Share | $5.01 | $7.89 | $5.57 | $9.33 | $6.34 | $10.02 | $12.11 | $7.64 | $7.40 | $6.60 | · | $6.58 | |
| Cash / Share | $1.18 | $1.36 | $1.63 | $2.96 | $1.49 | $2.60 | $6.90 | $0.88 | $1.02 | $3.24 | · | $2.97 | |
| Dividend / Share | $4.96 | $4.88 | $4.80 | $4.72 | $3.48 | $4.49 | $4.29 | $3.94 | $3.60 | $3.24 | $3.11 | $2.99 | |
| Dividend Paid / Share | $4.96 | $4.88 | $4.80 | $4.72 | $4.64 | $4.44 | $4.24 | $3.84 | $3.48 | $3.20 | $3.08 | $2.96 | |
| EPS (TTM) | $4.81 | $6.52 | $2.25 | $1.20 | $3.73 | $5.58 | $7.36 | $6.32 | $6.26 | $5.33 | $4.92 | $4.37 |
Wachstumsraten
| Kennzahl | Trend | 2026 | 2025 | 2024 | 2023 | 2022 | 2021 | 2020 | 2019 | 2018 | 2017 | 2016 | 2015 |
|---|---|---|---|---|---|---|---|---|---|---|---|---|---|
| Revenue YoY | -5.4% | 0.16% | -4.0% | 4.0% | -3.2% | 9.2% | · | · | · | · | · | · | |
| Revenue CAGR 3Y | -3.1% | -0.01% | -1.1% | 3.2% | · | · | · | · | · | · | · | · | |
| Revenue CAGR 5Y | -1.8% | 1.1% | · | · | · | · | · | · | · | · | · | · | |
| EPS YoY | -26.2% | 189.8% | 87.5% | -67.8% | -33.1% | -24.2% | · | · | · | · | · | · | |
| EPS CAGR 3Y | 58.9% | 20.5% | -26.1% | -45.4% | · | · | · | · | · | · | · | · | |
| EPS CAGR 5Y | -2.9% | -2.4% | · | · | · | · | · | · | · | · | · | · | |
| Net Income YoY | -27.5% | 189.3% | 87.9% | -67.8% | -34.9% | -24.4% | · | · | · | · | · | · | |
| Net Income CAGR 3Y | 57.9% | 20.6% | -26.7% | -45.9% | · | · | · | · | · | · | · | · | |
| Net Income CAGR 5Y | -3.7% | -2.9% | · | · | · | · | · | · | · | · | · | · | |
| Dividends Paid CAGR 5Y | 1.5% | 2.5% | · | · | · | · | · | · | · | · | · | · |
Bewertung (TTM)
| Kennzahl | Trend | 2026 | 2025 | 2024 | 2023 | 2022 | 2021 | 2020 | 2019 | 2018 | 2017 | 2016 | 2015 |
|---|---|---|---|---|---|---|---|---|---|---|---|---|---|
| Revenue TTM | $6.72B | $7.10B | $7.09B | $7.39B | $7.11B | $7.34B | $6.72B | $6.28B | $6.12B | $5.97B | $5.76B | $5.66B | |
| Net Income TTM | $587M | $810M | $280M | $149M | $462M | $710M | $939M | $820M | $823M | $701M | $648M | $580M | |
| Market Cap | $11.54B | $14.73B | $16.95B | $19.69B | $17.36B | $22.09B | $27.68B | $19.24B | $17.31B | $17.19B | · | $13.38B | |
| Enterprise Value | $16.47B | $17.05B | $19.23B | $21.85B | $19.89B | $24.55B | $29.59B | $21.82B | $19.66B | $18.97B | · | $15.19B | |
| P/E | 19.8 | 18.4 | 60.7 | 132.5 | 37.8 | 32.2 | 29.8 | 24.2 | 21.6 | 25.0 | 28.1 | 23.8 | |
| P/S | 1.7 | 2.1 | 2.4 | 2.7 | 2.4 | 3.0 | 4.1 | 3.1 | 2.8 | 2.9 | · | 2.4 | |
| P/B | 128.2 | 45.9 | 51.7 | 89.5 | 31.2 | 53.7 | 30.5 | 34.4 | 23.8 | 31.7 | · | 113.4 | |
| P / Cash Flow | 18.9 | 15.0 | 24.4 | 17.0 | 22.1 | 17.3 | 17.9 | 19.4 | 17.8 | 19.8 | · | 15.3 | |
| P / FCF | 28.5 | 19.4 | 35.1 | 21.2 | 32.5 | 23.4 | 21.4 | 24.5 | 22.2 | 27.0 | · | 17.9 | |
| EV / EBITDA | 66.7 | 77.9 | 81.8 | 92.6 | 88.8 | 116.4 | 164.4 | 121.2 | 118.4 | 116.4 | · | · | |
| EV / FCF | 40.7 | 22.4 | 39.8 | 23.5 | 37.2 | 26.0 | 22.9 | 27.8 | 25.2 | 29.8 | · | 20.3 | |
| EV / Revenue | 2.5 | 2.4 | 2.7 | 3.0 | 2.8 | 3.3 | 4.4 | 3.5 | 3.2 | 3.2 | · | 2.7 | |
| Dividend Yield | 5.2% | 4.1% | 3.5% | 3.0% | 3.3% | 2.5% | 1.9% | 2.5% | 2.6% | 2.4% | · | 2.9% | |
| Earnings Yield | 5.0% | 5.4% | 1.7% | 0.75% | 2.6% | 3.1% | 3.4% | 4.1% | 4.6% | 4.0% | 3.6% | 4.2% | |
| Payout Ratio | 102.6% | 74.3% | 212.5% | 391.3% | 123.6% | 78.6% | 56.8% | 59.8% | 54.7% | 58.8% | · | 66.4% | |
| Annual Payout | $602M | $602M | $595M | $583M | $571M | $558M | $533M | $490M | $450M | $412M | $398M | $385M |
Gewinn- und Verlustrechnung
| Kennzahl | Trend | Q4 2026 | Q3 2026 | Q2 2026 | Q1 2026 | Q4 2025 | Q3 2025 | Q2 2025 | Q1 2025 | Q4 2024 | Q3 2024 | Q2 2024 | Q1 2024 | Q4 2023 | Q3 2023 | Q2 2023 | Q1 2023 |
|---|---|---|---|---|---|---|---|---|---|---|---|---|---|---|---|---|---|
| Revenue | $1.95B | $1.67B | $1.67B | $1.43B | $1.99B | $1.67B | $1.69B | $1.76B | $1.90B | $1.81B | $1.99B | $1.39B | $2.02B | $1.92B | $1.72B | $1.74B | |
| Cost of Revenue | $1.14B | $948M | $951M | $833M | $1.06B | $924M | $948M | $955M | $1.02B | $1.05B | $1.12B | $854M | $1.16B | $1.11B | $1.09B | $1.11B | |
| Gross Profit | $804M | $722M | $722M | $596M | $924M | $744M | $738M | $807M | $884M | $766M | $866M | $532M | $862M | $800M | $620M | $626M | |
| R&D Expense | $32M | $27M | $29M | $28M | $32M | $27M | $31M | $31M | $33M | $32M | $32M | $29M | $38M | $35M | $33M | $32M | |
| SG&A Expense | $298M | $229M | $262M | $277M | $296M | $267M | $280M | $281M | $268M | $301M | $322M | $276M | $329M | $311M | $282M | $261M | |
| Interest Expense | $55M | $27M | $25M | $23M | $22M | $23M | $22M | $21M | $21M | $22M | $26M | $21M | $21M | $24M | $23M | $22M | |
| Pretax Income | $213M | $256M | $215M | $107M | $410M | $254M | $237M | $177M | $275M | $-42M | $136M | $29M | $237M | $-245M | $130M | $116M | |
| Income Tax | $46M | $65M | $54M | $25M | $74M | $63M | $43M | $74M | $54M | $8M | $40M | $4M | $56M | $-36M | $28M | $29M | |
| Net Income | $163M | $187M | $157M | $80M | $332M | $186M | $193M | $99M | $216M | $-51M | $93M | $22M | $176M | $-211M | $99M | $85M | |
| EPS (Basic) | $1.34 | $1.54 | $1.29 | $0.65 | $2.70 | $1.51 | $1.55 | $0.80 | $1.75 | $-0.41 | $0.75 | $0.17 | $1.42 | $-1.71 | $0.81 | $0.69 | |
| EPS (Diluted) | $1.33 | $1.54 | $1.29 | $0.65 | $2.68 | $1.50 | $1.54 | $0.80 | $1.74 | $-0.41 | $0.75 | $0.17 | $1.43 | $-1.71 | $0.80 | $0.68 | |
| Shares (Basic) | · | 121,363,000 | 121,602,000 | 122,629,000 | · | 123,367,000 | 123,766,000 | 123,795,000 | · | 124,249,000 | 124,176,000 | 123,973,000 | · | 123,649,000 | 123,546,000 | 123,339,000 | |
| Shares (Diluted) | · | 121,787,000 | 121,915,000 | 123,018,000 | · | 124,066,000 | 124,662,000 | 124,677,000 | · | 124,249,000 | 124,620,000 | 124,650,000 | · | 123,649,000 | 123,988,000 | 123,914,000 | |
| EBITDA | · | $58M | $55M | $56M | · | · | · | $54M | · | · | · | $61M | · | · | · | $56M |
Bilanz
| Kennzahl | Trend | Q4 2026 | Q3 2026 | Q2 2026 | Q1 2026 | Q4 2025 | Q3 2025 | Q2 2025 | Q1 2025 | Q4 2024 | Q3 2024 | Q2 2024 | Q1 2024 | Q4 2023 | Q3 2023 | Q2 2023 | Q1 2023 |
|---|---|---|---|---|---|---|---|---|---|---|---|---|---|---|---|---|---|
| Cash & Equivalents | $143M | $1.19B | $227M | $166M | $167M | $226M | $290M | $278M | $202M | $219M | $355M | $518M | · | $242M | $168M | $278M | |
| Receivables | $791M | $671M | $671M | $703M | $821M | $597M | $603M | $595M | $695M | $673M | $679M | $581M | · | $678M | $600M | $612M | |
| Inventory | $777M | $588M | $608M | $577M | $523M | $635M | $592M | $594M | $637M | $674M | $655M | $710M | · | $735M | $741M | $755M | |
| Prepaid Expense | $113M | $205M | $222M | $249M | $97M | $132M | $147M | $109M | $88M | $95M | $115M | $102M | · | $90M | $113M | $118M | |
| Current Assets | $1.82B | $2.65B | $1.73B | $1.70B | $1.61B | $1.59B | $1.63B | $1.58B | $1.62B | $1.66B | $1.80B | $1.91B | · | $1.75B | $1.62B | $1.76B | |
| PP&E (Net) | $1.51B | $1.24B | $1.25B | $1.25B | $1.27B | $1.25B | $1.24B | $1.24B | $1.31B | $1.29B | $1.31B | $1.32B | · | $1.31B | $1.32B | $1.32B | |
| PP&E (Gross) | $4.61B | · | · | · | $4.18B | · | · | · | $4.14B | · | · | · | · | · | · | · | |
| Accum. Depreciation | $3.10B | $3.04B | $3.01B | $2.96B | $2.91B | $2.87B | $2.83B | $2.80B | $2.82B | $2.80B | $2.79B | $2.77B | · | $2.67B | $2.62B | $2.58B | |
| Goodwill | $1.95B | $1.23B | $1.23B | $1.23B | $1.23B | $1.22B | $1.22B | $1.23B | $1.23B | $1.23B | $1.25B | $1.25B | $1.25B | $1.25B | $1.55B | $1.55B | |
| Intangibles | · | · | · | · | $566M | · | · | · | $681M | · | · | · | · | $722M | · | · | |
| Other Non-current Assets | $517M | $415M | $483M | $476M | $558M | $537M | $548M | $524M | $545M | $556M | $486M | $486M | · | $427M | $331M | $311M | |
| Total Assets | $7.79B | $6.44B | $5.61B | $5.53B | $5.56B | $5.51B | $5.58B | $5.50B | $5.75B | $5.80B | $5.91B | $5.99B | · | $5.82B | $6.04B | $6.15B | |
| Accounts Payable | $996M | $1.48B | $1.96B | $1.93B | $838M | $2.02B | $1.46B | $1.47B | $950M | $1.65B | $1.65B | $1.68B | · | $1.72B | $1.59B | $1.58B | |
| Short-term Debt | $1.09B | $1.59B | $307M | $218M | $4M | $54M | $189M | $4M | $4M | $111M | $247M | $347M | · | $138M | $209M | $348M | |
| Current Liabilities | $2.77B | $3.15B | $2.35B | $2.23B | $1.92B | $2.15B | $1.73B | $1.58B | $1.57B | $1.85B | $2.02B | $2.23B | · | $2.00B | $1.88B | $2.01B | |
| Capital Leases | $366M | $323M | $341M | $286M | $305M | $322M | $339M | $315M | $334M | $347M | $311M | $290M | · | $323M | $318M | $308M | |
| Deferred Tax | $17M | $23M | $19M | $20M | $20M | $21M | $22M | $23M | $22M | $24M | $26M | $27M | · | $27M | $56M | $59M | |
| Other Non-current Liabilities | $405M | $356M | $385M | $365M | $351M | $341M | $882M | $874M | $848M | $853M | $852M | $837M | · | $824M | $826M | $805M | |
| Total Liabilities | $7.54B | $6.34B | $5.58B | $5.39B | $5.08B | $5.32B | $5.46B | $5.27B | $5.26B | $5.55B | $5.69B | $5.86B | · | $5.65B | $5.55B | $5.66B | |
| Long-term Debt | $3.98B | · | · | · | $2.48B | · | · | · | $2.48B | · | · | · | · | · | · | · | |
| Total Debt | · | $4.08B | $2.79B | $2.70B | · | $2.54B | $2.67B | $2.49B | · | $2.59B | $2.73B | $2.83B | · | $2.61B | $2.69B | $2.82B | |
| Common Stock | $131M | $131M | $131M | $131M | $131M | $131M | $131M | $131M | $131M | $131M | $131M | $131M | · | $131M | $131M | $131M | |
| Retained Earnings | $386M | $223M | $190M | $200M | $432M | $99M | $68M | $31M | $250M | $34M | $241M | $299M | · | $415M | $782M | $832M | |
| Treasury Stock | $1.58B | $1.58B | $1.59B | $1.51B | $1.40B | $1.33B | $1.35B | $1.25B | $1.19B | $1.19B | $1.21B | $1.22B | · | $1.28B | $1.30B | $1.31B | |
| AOCI | $-157M | $-152M | $-159M | $-165M | $-157M | $-176M | $-181M | $-147M | $-155M | $-155M | $-359M | $-494M | · | $-498M | $-502M | $-515M | |
| Stockholders' Equity | $90M | $-67M | $-125M | $-22M | $321M | $27M | $-41M | $60M | $328M | $91M | $53M | $-37M | · | $3M | $321M | $326M | |
| Liabilities + Equity | $7.79B | $6.44B | $5.61B | $5.53B | $5.56B | $5.51B | $5.58B | $5.50B | $5.75B | $5.80B | $5.91B | $5.99B | · | $5.82B | $6.04B | $6.15B | |
| Shares Outstanding | 120,926,454 | 120,920,243 | 120,890,241 | 121,775,608 | 122,694,263 | 123,251,595 | 123,150,847 | 123,673,684 | 130,741,000 | 124,186,844 | 124,080,634 | 124,001,348 | 130,741,000 | 123,611,466 | 123,478,269 | 123,355,986 |
Cashflow
| Kennzahl | Trend | Q4 2026 | Q3 2026 | Q2 2026 | Q1 2026 | Q4 2025 | Q3 2025 | Q2 2025 | Q1 2025 | Q4 2024 | Q3 2024 | Q2 2024 | Q1 2024 | Q4 2023 | Q3 2023 | Q2 2023 | Q1 2023 |
|---|---|---|---|---|---|---|---|---|---|---|---|---|---|---|---|---|---|
| D&A | $78M | $58M | $55M | $56M | $57M | $55M | $53M | $54M | $59M | $58M | $57M | $61M | $62M | $60M | $58M | $56M | |
| Stock-based Comp | $-1M | $15M | $24M | $10M | $17M | $24M | $27M | $13M | $19M | $26M | $16M | $13M | $13M | $29M | $21M | $10M | |
| Deferred Tax | $-54M | $43M | $8M | $84M | $-2M | $3M | $-18M | $-1M | $26M | $-66M | $-55M | $-5M | $-27M | $-114M | $-3M | $-5M | |
| Amort. of Intangibles | · | · | · | · | · | · | · | · | · | · | · | · | $8M | $7M | · | · | |
| Restructuring | · | · | · | · | · | · | · | · | $15M | $11M | $3M | $0 | · | $22M | $4M | $22M | |
| Other Non-cash | · | · | · | $-137M | · | · | · | $56M | · | · | · | $-71M | · | · | · | $32M | |
| Operating Cash Flow | $330M | $-122M | $311M | $93M | $294M | $286M | $180M | $221M | $340M | $182M | $153M | $20M | $430M | $341M | $209M | $178M | |
| CapEx | $86M | $43M | $42M | $36M | $75M | $53M | $53M | $39M | $81M | $55M | $52M | $24M | $84M | $56M | $42M | $46M | |
| Investing Cash Flow | $-2.18B | $-43M | $-43M | $-34M | $-76M | $-53M | $-54M | $89M | $-81M | $-38M | $-33M | $-23M | $-81M | $-55M | $-42M | $-45M | |
| Stock Repurchased | $0 | $0 | $127M | $129M | $75M | $0 | $150M | $107M | $0 | $0 | $0 | $0 | $0 | $0 | $0 | $0 | |
| Net Stock Activity | · | · | · | $-129M | · | · | · | $-107M | · | · | · | · | · | · | · | $0 | |
| Dividends Paid | $150M | $150M | $151M | $151M | $150M | $150M | $151M | $151M | $149M | $148M | $149M | $149M | $146M | $146M | $146M | $145M | |
| Financing Cash Flow | $811M | $1.13B | $-210M | $-59M | $-279M | $-299M | $-109M | $-237M | $-273M | $-278M | $-259M | $155M | $-227M | $-211M | $-280M | $-35M | |
| Net Change in Cash | $-1.04B | $958M | $60M | $-1M | $-59M | $-65M | $12M | $75M | $-14M | $-137M | $-162M | $152M | $122M | $76M | $-110M | $94M | |
| Taxes Paid | · | · | · | · | $56M | $60M | $116M | $32M | $33M | $120M | $178M | $16M | $12M | $11M | · | · | |
| Free Cash Flow | · | · | · | $57M | · | · | · | $182M | · | · | · | $-4M | · | · | · | $132M | |
| Levered FCF | · | · | · | $39M | · | · | · | $170M | · | · | · | $-22M | · | · | · | $116M |
Rentabilität
| Kennzahl | Trend | Q4 2026 | Q3 2026 | Q2 2026 | Q1 2026 | Q4 2025 | Q3 2025 | Q2 2025 | Q1 2025 | Q4 2024 | Q3 2024 | Q2 2024 | Q1 2024 | Q4 2023 | Q3 2023 | Q2 2023 | Q1 2023 |
|---|---|---|---|---|---|---|---|---|---|---|---|---|---|---|---|---|---|
| Gross Margin | · | 43.2% | 43.2% | 41.7% | · | 44.6% | 43.8% | 45.8% | · | 42.2% | 43.5% | 38.4% | · | 41.8% | 36.1% | 36.0% | |
| Net Margin | · | 11.2% | 9.4% | 5.6% | · | 11.2% | 11.5% | 5.6% | · | -2.8% | 4.7% | 1.6% | · | -11.0% | 5.8% | 4.9% | |
| Pretax Margin | · | 15.3% | 12.8% | 7.5% | · | 15.2% | 14.1% | 10.1% | · | -2.3% | 6.8% | 2.1% | · | -12.8% | 7.6% | 6.7% | |
| EBITDA Margin | · | 3.5% | 3.3% | 3.9% | · | · | · | 3.1% | · | · | · | 4.4% | · | · | · | 3.2% | |
| ROA | · | 3.1% | 2.8% | 1.5% | · | 3.3% | 3.4% | 1.7% | · | -0.88% | 1.6% | 0.36% | · | -3.5% | 1.6% | 1.4% | |
| ROE | · | -935.0% | -189.2% | 421.0% | · | 315.2% | 3216.7% | 860.9% | · | -108.5% | 49.7% | 15.2% | · | -104.7% | 31.2% | 24.5% |
Liquidität & Solvenz
| Kennzahl | Trend | Q4 2026 | Q3 2026 | Q2 2026 | Q1 2026 | Q4 2025 | Q3 2025 | Q2 2025 | Q1 2025 | Q4 2024 | Q3 2024 | Q2 2024 | Q1 2024 | Q4 2023 | Q3 2023 | Q2 2023 | Q1 2023 |
|---|---|---|---|---|---|---|---|---|---|---|---|---|---|---|---|---|---|
| Current Ratio | · | 0.8 | 0.7 | 0.8 | · | 0.7 | 0.9 | 1.0 | · | 0.9 | 0.9 | 0.9 | · | 0.9 | 0.9 | 0.9 | |
| Quick Ratio | · | 0.6 | 0.4 | 0.4 | · | 0.4 | 0.5 | 0.6 | · | 0.5 | 0.5 | 0.5 | · | 0.5 | 0.4 | 0.4 | |
| Debt / Equity | · | -60.9 | -22.3 | -122.9 | · | 94.0 | -65.2 | 41.4 | · | 28.5 | 51.4 | -76.4 | · | 871.3 | 8.4 | 8.7 | |
| LT Debt / Equity | · | -37.1 | -19.9 | -113.0 | · | 92.0 | -60.6 | 41.4 | · | 27.3 | 46.8 | -67.0 | · | 825.3 | 7.7 | 7.6 |
Effizienz
| Kennzahl | Trend | Q4 2026 | Q3 2026 | Q2 2026 | Q1 2026 | Q4 2025 | Q3 2025 | Q2 2025 | Q1 2025 | Q4 2024 | Q3 2024 | Q2 2024 | Q1 2024 | Q4 2023 | Q3 2023 | Q2 2023 | Q1 2023 |
|---|---|---|---|---|---|---|---|---|---|---|---|---|---|---|---|---|---|
| Asset Turnover | · | 0.3 | 0.3 | 0.3 | · | 0.3 | 0.3 | 0.3 | · | 0.3 | 0.3 | 0.2 | · | 0.3 | 0.3 | 0.3 | |
| Inventory Turnover | · | 1.6 | 1.6 | 1.4 | · | 1.4 | 1.5 | 1.5 | · | 1.5 | 1.6 | 1.2 | · | 1.4 | 1.4 | 1.4 | |
| Receivables Turnover | · | 2.6 | 2.6 | 2.2 | · | 2.6 | 2.6 | 3.0 | · | 2.7 | 3.1 | 2.3 | · | 2.9 | 2.9 | 2.7 |
Pro Aktie
| Kennzahl | Trend | Q4 2026 | Q3 2026 | Q2 2026 | Q1 2026 | Q4 2025 | Q3 2025 | Q2 2025 | Q1 2025 | Q4 2024 | Q3 2024 | Q2 2024 | Q1 2024 | Q4 2023 | Q3 2023 | Q2 2023 | Q1 2023 |
|---|---|---|---|---|---|---|---|---|---|---|---|---|---|---|---|---|---|
| Book Value / Share | · | $-0.55 | $-1.03 | $-0.18 | · | $0.22 | $-0.33 | $0.49 | · | $0.73 | $0.43 | $-0.30 | · | $0.02 | $2.60 | $2.64 | |
| Revenue / Share | · | $13.71 | $13.72 | $11.62 | · | $13.44 | $13.52 | $14.13 | · | $14.60 | $15.97 | $11.12 | · | $15.49 | $13.83 | $14.04 | |
| Cash Flow / Share | · | · | · | $0.76 | · | · | · | $1.77 | · | · | · | $0.16 | · | · | · | $1.44 | |
| Cash / Share | · | $9.82 | $1.88 | $1.36 | · | $1.83 | $2.35 | $2.25 | · | $1.76 | $2.86 | $4.18 | · | $1.96 | $1.36 | $2.25 | |
| Dividend / Share | $0.00 | $1.24 | $1.24 | $2.48 | $0.00 | $1.22 | $1.22 | $2.44 | $0.00 | $1.20 | $1.20 | $2.40 | $0.00 | $1.18 | $1.18 | $2.36 | |
| EPS (TTM) | · | $6.16 | $6.12 | $6.37 | · | $5.58 | $3.67 | $2.88 | · | $1.94 | $0.64 | $0.69 | · | $0.59 | $3.51 | $3.27 |
Bewertung (TTM)
| Kennzahl | Trend | Q4 2026 | Q3 2026 | Q2 2026 | Q1 2026 | Q4 2025 | Q3 2025 | Q2 2025 | Q1 2025 | Q4 2024 | Q3 2024 | Q2 2024 | Q1 2024 | Q4 2023 | Q3 2023 | Q2 2023 | Q1 2023 |
|---|---|---|---|---|---|---|---|---|---|---|---|---|---|---|---|---|---|
| Revenue TTM | · | $6.76B | $6.76B | $6.77B | · | $7.02B | $7.17B | $7.47B | · | $7.21B | $7.31B | $7.04B | · | $7.17B | $7.07B | $7.04B | |
| Net Income TTM | · | $756M | $755M | $791M | · | $694M | $457M | $357M | · | $240M | $80M | $86M | · | $74M | $435M | $405M | |
| Market Cap | · | $12.53B | $12.19B | $15.01B | · | $18.15B | $20.00B | $20.15B | · | $19.01B | $17.69B | $16.25B | · | $19.56B | $17.33B | $15.84B | |
| Enterprise Value | · | $15.42B | $14.76B | $17.55B | · | $20.46B | $22.38B | $22.36B | · | $21.39B | $20.06B | $18.56B | · | $21.93B | $19.84B | $18.38B | |
| P/E | · | 16.8 | 16.5 | 19.4 | · | 26.4 | 44.3 | 56.6 | · | 78.9 | 222.8 | 189.9 | · | 268.2 | 40.0 | 39.3 | |
| P/S | · | 1.9 | 1.8 | 2.2 | · | 2.6 | 2.8 | 2.7 | · | 2.6 | 2.4 | 2.3 | · | 2.7 | 2.5 | 2.2 | |
| P/B | · | -187.0 | -97.5 | -682.5 | · | 672.2 | -487.8 | 335.8 | · | 208.9 | 333.8 | -439.2 | · | 6520.1 | 54.0 | 48.6 | |
| P / Cash Flow | · | · | · | 161.5 | · | · | · | 91.2 | · | · | · | 812.6 | · | · | · | 89.0 | |
| EV / Revenue | · | 2.3 | 2.2 | 2.6 | · | 2.9 | 3.1 | 3.0 | · | 3.0 | 2.7 | 2.6 | · | 3.1 | 2.8 | 2.6 | |
| Dividend Yield | · | 4.8% | 4.9% | 4.0% | · | 3.3% | 3.0% | 3.0% | · | 3.1% | 3.3% | 3.6% | · | 3.0% | 3.3% | 3.6% | |
| Earnings Yield | · | 5.9% | 6.1% | 5.2% | · | 3.8% | 2.3% | 1.8% | · | 1.3% | 0.45% | 0.53% | · | 0.37% | 2.5% | 2.5% | |
| Payout Ratio | · | · | · | 188.8% | · | · | · | 152.5% | · | · | · | 677.3% | · | · | · | 170.6% | |
| Annual Payout | · | $602M | $602M | $602M | · | $601M | $599M | $597M | · | $592M | $590M | $587M | · | $580M | $577M | $574M |
Aktuellster Zeitraum links · fehlende Werte werden als · angezeigt
Finanzberichte Gewinn- und Verlustrechnung, Bilanz, Cashflow — jährlich, letzte 5 Jahre
| Kennzahl | 2026-06-30 | 2025-06-30 | 2024-06-30 | 2023-06-30 | 2022-06-30 |
|---|---|---|---|---|---|
| Umsatz | $6.72B | $7.10B | $7.09B | $7.39B | $7.11B |
| Bruttogewinnmarge % | 42.3% | 45.2% | 43.0% | 39.4% | 35.8% |
| Nettoergebnis | $587M | $810M | $280M | $149M | $462M |
| Verwässerte EPS | $4.81 | $6.52 | $2.25 | $1.20 | $3.73 |
| Kennzahl | 2026-06-30 | 2025-06-30 | 2024-06-30 | 2023-06-30 | 2022-06-30 |
|---|---|---|---|---|---|
| Fremdkapital / Eigenkapital | 56.3 | 7.8 | 7.6 | 11.5 | 4.9 |
| Liquiditätsgrad | 0.7 | 0.8 | 1.0 | 1.0 | 1.0 |
| Quick Ratio | 0.3 | 0.5 | 0.6 | 0.6 | 0.5 |
| Kennzahl | 2026-06-30 | 2025-06-30 | 2024-06-30 | 2023-06-30 | 2022-06-30 |
|---|---|---|---|---|---|
| Freier Cashflow | $405M | $761M | $483M | $930M | $535M |
Institutionelle Eigentümer (13F) 1.148 Einreicher · $12.1B gesamt · Stand 30. September 2026
Institutionen, die diese Aktie in ihrer vierteljährlichen SEC-Formular 13F melden. Nur Long-Positionen; ein einzelner Einreicher kann für separate Optionsscheine zweimal erscheinen. Große gegenläufige Put/Call-Positionen spiegeln typischerweise Market-Making oder abgesicherte Bestände wider, nicht die gerichtete Überzeugung.
| Neue Positionen | Geschlossene Positionen | Erhöht | Abgenommen | Nettoveränderung der Aktien |
|---|---|---|---|---|
| 130 (-55 vs. Vorquartal) | 154 (+45 vs. Vorquartal) | 416 (+3 vs. Vorquartal) | 371 (+49 vs. Vorquartal) | +10.9M |
Verglichen mit Q1 2026. SEC-Formular 13F-Einreichungen sind innerhalb von 45 Tagen nach Quartalsende fällig, zuzüglich einer kurzen Pufferzeit für verspätete Einreicher — Quartale, die noch in diesem Fenster liegen, werden zugunsten des letzten vollständig berichteten Paares übersprungen.
| Institution | Wert | Aktien | % der verfolgten 13F | Typ |
|---|---|---|---|---|
| VANGUARD GROUP INC | $1.581.417.720 | 15.684.000 | 13,03% | Aktien |
| BlackRock, Inc. | $958.639.699 | 10.044.423 | 7,90% | Aktien |
| STATE STREET CORP | $804.799.995 | 8.432.523 | 6,63% | Aktien |
| VANGUARD CAPITAL MANAGEMENT LLC | $753.631.462 | 7.896.390 | 6,21% | Aktien |
| Invesco Ltd. | $573.601.311 | 6.010.072 | 4,73% | Aktien |
| VANGUARD PORTFOLIO MANAGEMENT LLC | $553.547.419 | 5.799.952 | 4,56% | Aktien |
| GEODE CAPITAL MANAGEMENT, LLC | $310.435.289 | 3.265.551 | 2,56% | Aktien |
| VAN ECK ASSOCIATES CORP | $283.738.539 | 2.972.952 | 2,34% | Aktien |
| MORGAN STANLEY | $214.435.978 | 2.246.813 | 1,77% | Aktien |
| MILLENNIUM MANAGEMENT LLC | $197.848.074 | 2.073.010 | 1,63% | Aktien |
| UBS Group AG | $189.012.716 | 1.980.435 | 1,56% | Aktien |
| BANK OF AMERICA CORP /DE/ | $179.780.238 | 1.883.700 | 1,48% | Aktien |
| CITADEL ADVISORS LLC | $168.455.800 | 1.765.044 | 1,39% | Aktien |
| ProShare Advisors LLC | $156.059.576 | 1.635.159 | 1,29% | Aktien |
| NORTHERN TRUST CORP | $150.978.254 | 1.581.918 | 1,24% | Aktien |
| UBS AM, a distinct business unit of UBS ASSET MANAGEMENT AMERICAS LLC | $128.237.566 | 1.237.456 | 1,06% | Aktien |
| TWO SIGMA ADVISERS, LP | $126.692.895 | 1.256.500 | 1,04% | Aktien |
| Bank of New York Mellon Corp | $123.154.261 | 1.290.384 | 1,01% | Aktien |
| DIMENSIONAL FUND ADVISORS LP | $114.888.337 | 1.203.658 | 0,95% | Aktien |
| EQUITY INVESTMENT CORP | $111.799.736 | 1.171.414 | 0,92% | Aktien |
| WELLS FARGO & COMPANY/MN | $109.764.097 | 1.150.084 | 0,90% | Aktien |
| CHARLES SCHWAB INVESTMENT MANAGEMENT INC | $108.515.852 | 1.137.006 | 0,89% | Aktien |
| GOLDMAN SACHS GROUP INC | $104.225.723 | 1.092.055 | 0,86% | Aktien |
| MASTERS CAPITAL MANAGEMENT LLC | $95.440.000 | 1.000.000 | 0,79% | Kaufoption |
| CONFLUENCE INVESTMENT MANAGEMENT LLC | $94.815.467 | 1.170.417 | 0,78% | Aktien |
| NORGES BANK | $89.728.870 | 940.160 | 0,74% | Aktien |
| Amundi | $82.164.501 | 860.903 | 0,68% | Aktien |
| STIFEL FINANCIAL CORP | $81.973.996 | 858.890 | 0,68% | Aktien |
| WORLDQUANT MILLENNIUM ADVISORS LLC | $78.347.937 | 820.913 | 0,65% | Aktien |
| SUSQUEHANNA INTERNATIONAL GROUP, LLP | $78.031.744 | 817.600 | 0,64% | Verkaufsoption |
| JPMORGAN CHASE & CO | $77.973.175 | 797.470 | 0,64% | Aktien |
| Squarepoint Ops LLC | $74.338.216 | 778.900 | 0,61% | Kaufoption |
| DEUTSCHE BANK AG\ | $68.472.665 | 717.442 | 0,56% | Aktien |
| RAYMOND JAMES FINANCIAL INC | $66.695.979 | 698.827 | 0,55% | Aktien |
| VANGUARD FIDUCIARY TRUST CO | $64.800.038 | 678.961 | 0,53% | Aktien |
| FMR LLC | $64.750.771 | 678.445 | 0,53% | Aktien |
| JANE STREET GROUP, LLC | $61.282.024 | 642.100 | 0,50% | Kaufoption |
| ROYAL BANK OF CANADA | $60.600.000 | 634.963 | 0,50% | Aktien |
| VICTORY CAPITAL MANAGEMENT INC | $55.114.596 | 577.479 | 0,45% | Aktien |
| SUSQUEHANNA INTERNATIONAL GROUP, LLP | $51.841.863 | 543.188 | 0,43% | Aktien |
| JANE STREET GROUP, LLC | $51.232.192 | 536.800 | 0,42% | Verkaufsoption |
| NUANCE INVESTMENTS, LLC | $50.462.720 | 528.738 | 0,42% | Aktien |
| JACOBS LEVY EQUITY MANAGEMENT, INC | $49.463.307 | 518.266 | 0,41% | Aktien |
| SUSQUEHANNA INTERNATIONAL GROUP, LLP | $46.507.912 | 487.300 | 0,38% | Kaufoption |
| WELLS FARGO & COMPANY/MN | $45.811.200 | 480.000 | 0,38% | Verkaufsoption |
| LPL Financial LLC | $45.328.034 | 474.938 | 0,37% | Aktien |
| Vest Financial, LLC | $41.455.086 | 511.728 | 0,34% | Aktien |
| CITADEL ADVISORS LLC | $41.201.448 | 431.700 | 0,34% | Verkaufsoption |
| NOMURA ASSET MANAGEMENT CO LTD | $40.647.896 | 425.900 | 0,33% | Aktien |
| Legal & General Group Plc | $40.223.953 | 421.458 | 0,33% | Aktien |
Aktivisten & 5%+-Eigentümer 7 Beteiligungen
Investoren mit SEC Schedule 13D — wirtschaftliches Eigentum über 5% mit der Absicht, Einfluss auf den Emittenten zu nehmen (aktivistische Beteiligungen, Board-Kampagnen, M&A). Jede Zeile zeigt den zuletzt bekannten Stand der Position dieses Melders.
| Anmelder | Eingereicht | Beteiligung | Status | Zweck | Einreichung |
|---|---|---|---|---|---|
| High River Limited Partnership, Hopper Investments LLC, Barberry Corp., Icahn Partners Master Fund LP, Icahn Partners Master Fund II LP, Icahn Partners Master Fund III LP, Icahn Offshore LP, Icahn Partners LP, Icahn Onshore LP, Icahn Capital LP, IPH GP LLC, Icahn Enterprises Holdings L.P., Icahn Enterprises G.P. Inc., Beckton Corp., Carl C. Icahn ×8 Einreichungen | 1. Dezember 2011 | · | Erste Einreichung | · | SEC |
| 23. September 2011 | · | Erste Einreichung | · | SEC | |
| 20. Juli 2011 | · | Erste Einreichung | · | SEC | |
| 15. Juli 2011 | · | Erste Einreichung | · | SEC | |
| HC Investments, Inc., Henkel KGaA ×2 Einreichungen | 22. November 2004 | · | Erste Einreichung | · | SEC |
| 7. Oktober 2004 | · | Erste Einreichung | · | SEC | |
| 15. Dezember 2003 | · | Erste Einreichung | · | SEC |
Purpose is an automated classification of the filer's own stated purpose (SEC Item 4) — not investment advice. "—" means no clear purpose was stated or the text could not be classified.
Unternehmensinsider 94 Insider · 31 Führungskräfte · 19 Direktoren
| Insider | Rolle | Letzte Aktivität | Gehaltene Aktien | Käufe 12m | Verkäufe 12m | Netto 12m |
|---|---|---|---|---|---|---|
| Linda J Rendle | Chief Executive Officer | 5. Oktober 2026 F | 269.807 | 0 | 0 | $0 |
| Gerald E Johnston | Chairman & CEO | 17. Oktober 2005 A | 183.422 | 0 | 0 | $0 |
| Luc Bellet | EVP - Chief Financial Officer | 5. Oktober 2026 F | 74.860 | 0 | 0 | $0 |
| Daniel J Heinrich | EVP-Chief Financial Officer | 13. September 2011 A | 51.677 | 0 | 0 | $0 |
| Karen M Rose | Group VP-CFO | 4. August 2003 F | 9.285 | 0 | 0 | $0 |
| Chris T Hyder | EVP-Chief Operating Officer | 5. Oktober 2026 F | 92.986 | 0 | 0 | $0 |
| George C Roeth | EVP-COO - Household | 3. November 2014 M | 1.945 | 0 | 0 | $0 |
| Larry Peiros | Executive VP-COO | 22. Februar 2013 M | 34.070 | 0 | 0 | $0 |
| Laurene E Peck | VP - CAO & Corp Controller | 5. Oktober 2026 F | 10.017 | 0 | 0 | $0 |
| Angela C Hilt | EVP - Chief Legal Officer | 5. Oktober 2026 F | 69.767 | 0 | 0 | $0 |
| Nina Barton | EVP-Chief Growth & Strategy Of | 5. Oktober 2026 F | 36.179 | 0 | 0 | $0 |
| Kirsten Marriner | EVP - Chief Admin Officer | 5. Oktober 2026 F | 79.498 | 0 | 0 | $0 |
| Thomas D Johnson | VP - Global Business Services | 17. Februar 2017 M | 12.754 | 0 | 0 | $0 |
| Jacqueline P Kane | EVP- HR & Corporate Affairs | 4. Dezember 2015 S | 22.411 | 0 | 0 | $0 |
| Frank A Tataseo | EVP - New Bus. Development | 2. September 2015 S | 24.054 | 0 | 0 | $0 |
| Donald R Knauss | Executive Chairman | 6. Februar 2015 M | 29.697 | 0 | 0 | $0 |
| Wayne L Decker | SVP-Chief Innovation Officer | 25. November 2014 M | 0 | 0 | 0 | $0 |
| Thomas P Britanik | SVP-Chief Marketing Officer | 10. November 2014 M | 13.982 | 0 | 0 | $0 |
| Grant J Lamontagne | SVP-Prof. Products Development | 3. Dezember 2013 M | 19.736 | 0 | 0 | $0 |
| Susan Gentile | VP - Controller | 20. Februar 2013 S | 1.351 | 0 | 0 | $0 |
| Warwick Lynton Everyburns | SVP, International | 16. September 2008 A | 20.081 | 0 | 0 | $0 |
| Keith R Tandowsky | VP - Internal Audit | 18. Mai 2005 M | 6.726 | 0 | 0 | $0 |
| Pamela Fletcher | VP - Secretary | 19. November 2004 A | 14.728 | 0 | 0 | $0 |
| Robin Evitts | VP - Internal Audit | 9. Oktober 2004 F | 2.334 | 0 | 0 | $0 |
| Greg S Frank | Vice President-Treasurer | 29. September 2004 F | 4.222 | 0 | 0 | $0 |
| Scott A Weiss | VP-GM, Brita | 1. Juli 2004 F | 4.424 | 0 | 0 | $0 |
| Craig G Sullivan | Chairman of the Board | 31. Dezember 2003 F | 91.347 | 0 | 0 | $0 |
| Pamela S Hewitt | VP - Human Relations | 17. September 2003 A | · | 0 | 0 | $0 |
| Glenn R Savage | VP-GM, Laundry & Home Care | 17. September 2003 A | 11.423 | 0 | 0 | $0 |
| Peter D Bewley | Sr. VP-General Counsel & Secty | 17. September 2003 A | 13.316 | 0 | 0 | $0 |
| Mark J Richenderfer | VP-Supply Chain | 17. September 2003 A | · | 0 | 0 | $0 |
| Stephanie Plaines | Direktor | 30. September 2026 A | · | 0 | 0 | $0 |
| Russell J Weiner | Direktor | 30. September 2026 A | · | 0 | 0 | $0 |
| Pierre R Breber | Direktor | 30. September 2026 A | 18.000 | 2 | 0 | $845.620 |
| Matthew J Shattock | Direktor | 30. September 2026 A | · | 0 | 0 | $0 |
| Christopher J Williams | Direktor | 30. September 2026 A | 849 | 0 | 0 | $0 |
| George J Harad | Direktor | 30. September 2016 A | 5.503 | 0 | 0 | $0 |
| Rogelio Rebolledo | Direktor | 31. Dezember 2015 A | · | 0 | 0 | $0 |
| Daniel Boggan JR | Direktor | 31. Dezember 2014 A | 1.241 | 0 | 0 | $0 |
| Tully M Friedman | Direktor | 30. September 2014 A | 0 | 0 | 0 | $0 |
| Edward A Mueller | Direktor | 30. September 2013 A | · | 0 | 0 | $0 |
| Gary G Michael | Direktor | 30. Dezember 2011 A | 6.651 | 0 | 0 | $0 |
| Jan L Murley | Direktor | 11. Juli 2011 M | 4.564 | 0 | 0 | $0 |
| Michael E Shannon | Direktor | 28. September 2007 A | 3.000 | 0 | 0 | $0 |
| Lary R Scott | Direktor | 29. September 2006 A | 7.080 | 0 | 0 | $0 |
| William R Johnson | Direktor | 1. Juli 2004 A | · | 0 | 0 | $0 |
| Christoph Henkel | Direktor | 1. Juli 2004 A | · | 0 | 0 | $0 |
| Stacey Grier | · | 13. März 2026 F | 32.116 | 0 | 0 | $0 |
| Julia Charter | · | 31. Dezember 2025 A | · | 0 | 0 | $0 |
| Stephen B Bratspies | · | 31. Dezember 2025 A | · | 0 | 0 | $0 |
| Esther Lee | · | 31. Dezember 2025 A | · | 0 | 0 | $0 |
| Gina Boswell | · | 31. Dezember 2025 A | · | 0 | 0 | $0 |
| Spencer C Fleischer | · | 31. Dezember 2025 A | 1.305 | 0 | 0 | $0 |
| A D David Mackay | · | 31. Dezember 2025 A | 600 | 0 | 0 | $0 |
| Eric H Reynolds | · | 12. Dezember 2025 F | 69.058 | 0 | 0 | $0 |
| Kevin B Jacobsen | · | 19. Dezember 2024 F | 49.708 | 0 | 0 | $0 |
| Kathryn A Tesija | · | 30. September 2024 A | · | 0 | 0 | $0 |
| Paul Gray Parker | · | 30. August 2024 A | 978 | 0 | 0 | $0 |
| Amy Banse | · | 30. August 2024 A | 524 | 0 | 0 | $0 |
| Michael M Ott | · | 13. September 2022 F | 4.104 | 0 | 0 | $0 |
| Eric Sean Schwartz | · | 13. September 2022 F | 4.248 | 0 | 0 | $0 |
| Matthew Gregory | · | 13. September 2022 F | 4.457 | 0 | 0 | $0 |
| Richard T Mcdonald | · | 13. September 2022 F | 10.046 | 0 | 0 | $0 |
| Chau Banks | · | 13. September 2022 F | 2.272 | 0 | 0 | $0 |
| Diego J Barral | · | 13. September 2022 F | 10.232 | 0 | 0 | $0 |
| Shanique Bonelli-Moore | · | 11. Juli 2022 A | 1.763 | 0 | 0 | $0 |
| Rebecca Dunphey | · | 21. März 2022 A | 18.673 | 0 | 0 | $0 |
| Richard H Carmona | · | 31. Dezember 2021 A | · | 0 | 0 | $0 |
| Denise Garner | · | 20. Dezember 2021 F | 10.980 | 0 | 0 | $0 |
| Tony Matta | · | 5. Oktober 2021 F | 9.371 | 0 | 0 | $0 |
| Terence Troy Datcher | · | 19. August 2021 F | 3.046 | 0 | 0 | $0 |
| Pamela Thomas-Graham | · | 31. Dezember 2020 A | 1.779 | 0 | 0 | $0 |
| Benno O Dorer | · | 30. November 2020 M | 170.689 | 0 | 0 | $0 |
| Laura Stein | · | 5. November 2020 S | 40.325 | 0 | 0 | $0 |
| Andrew J Mowery | · | 4. November 2020 M | 15.300 | 0 | 0 | $0 |
| William S Bailey | · | 3. November 2020 M | 9.349 | 0 | 0 | $0 |
| Jeff Baker | · | 22. September 2020 A | 7.456 | 0 | 0 | $0 |
| Michael R. Costello | · | 20. August 2020 F | 36.007 | 0 | 0 | $0 |
| Robert W Matschullat | · | 31. Dezember 2019 A | 1.324 | 0 | 0 | $0 |
| John J Mcnulty | · | 17. September 2019 A | 272 | 0 | 0 | $0 |
| Matthew T Laszlo | · | 6. Februar 2019 M | 10.889 | 0 | 0 | $0 |
| Carolyn M Ticknor | · | 31. Dezember 2018 A | 0 | 0 | 0 | $0 |
| Dawn C Willoughby | · | 17. Dezember 2018 M | 18.586 | 0 | 0 | $0 |
| Jon M Balousek | · | 18. September 2018 A | 12.545 | 0 | 0 | $0 |
| Jeffrey Noddle | · | 29. Dezember 2017 A | · | 0 | 0 | $0 |
| James E Foster | · | 12. September 2017 A | 12.208 | 0 | 0 | $0 |
| Manjit Singh | · | 12. September 2017 A | 3.358 | 0 | 0 | $0 |
| Stephen Robb | · | 12. September 2017 A | 29.460 | 0 | 0 | $0 |
| Nikolaos A Vlahos | · | 28. Februar 2017 M | 11.393 | 0 | 0 | $0 |
| Mary Beth Springer | · | 11. Februar 2011 M | 5.108 | 0 | 0 | $0 |
| HC INVESTMENTS INC | · | 22. November 2004 D | 0 | 0 | 0 | $0 |
| Klaus Morwind | · | 1. Juli 2004 A | · | 0 | 0 | $0 |
| James H Hardy JR | · | 19. Februar 2004 M | 1.386 | 0 | 0 | $0 |
| Richard Thomas Conti | · | 17. September 2003 A | 58.924 | 0 | 0 | $0 |
Insider aus SEC-Einreichungen Form 3/4/5; Netto = nur P/S aus offenen Märkten
ETF-Besitz Gehalten von 103 ETFs
Gewichtung spiegelt nur direkte Aktienbestände (N-PORT) wider; gehebelte oder derivatbasierte Fonds können zusätzliche Swap-Exposure halten, die hier nicht angezeigt wird.
| Fonds | Gewicht | Anteile | Stand | Quelle |
|---|---|---|---|---|
| RSPS · Invesco Exchange-Traded Fund Trust | 2,72% | 79.162 SH | 23. Oktober 2026 | Täglich |
| SPHD · Invesco Exchange-Traded Fund Trust … | 2,21% | 847.769 SH | 23. Oktober 2026 | Täglich |
| PEY · Invesco Exchange-Traded Fund Trust | 2,06% | 264.418 SH | 23. Oktober 2026 | Täglich |
| SNPD · DBX ETF Trust | 1,64% | 514 NS | 31. August 2026 | N-PORT |
| FXG · First Trust Exchange-Traded AlphaDE… | 1,63% | 39.096 NS | 31. Juli 2026 | N-PORT |
| KNG · First Trust Exchange-Traded Fund IV | 1,37% | 507.132 NS | 31. Juli 2026 | N-PORT |
| RDIV · Invesco Exchange-Traded Fund Trust … | 1,21% | 201.529 SH | 23. Oktober 2026 | Täglich |
| VDC · VANGUARD WORLD FUND | 0,56% | 538.067 SH | 19. August 2026 | Täglich |
| FSTA · FIDELITY COVINGTON TRUST | 0,55% | 81.922 NS | 31. Juli 2026 | N-PORT |
| IYK · iShares Trust | 0,49% | 77.169 SH | 11. September 2026 | Täglich |
| IQSM · New York Life Investments ETF Trust | 0,47% | 16.379 NS | 31. Juli 2026 | N-PORT |
| QDF · FlexShares Trust | 0,32% | 73.275 NS | 31. Juli 2026 | N-PORT |
| SPXD · DBX ETF Trust | 0,30% | 218 NS | 31. August 2026 | N-PORT |
| ESML · iShares Trust | 0,30% | 93.495 SH | 11. September 2026 | Täglich |
| KXI · iShares Trust | 0,29% | 34.886 SH | 11. September 2026 | Täglich |
| BKMC · BNY Mellon ETF Trust | 0,28% | 18.993 NS | 31. Juli 2026 | N-PORT |
| VBR · VANGUARD INDEX FUNDS | 0,25% | 1.761.080 SH | 19. August 2026 | Täglich |
| BBMC · J.P. Morgan Exchange-Traded Fund Tr… | 0,25% | 53.045 NS | 31. Juli 2026 | N-PORT |
| FQAL · FIDELITY COVINGTON TRUST | 0,25% | 36.383 NS | 31. Juli 2026 | N-PORT |
| DFAS · Dimensional ETF Trust | 0,20% | 327.854 NS | 31. Juli 2026 | N-PORT |
| RSP · Invesco Exchange-Traded Fund Trust | 0,19% | 2.190.023 SH | 23. Oktober 2026 | Täglich |
| EQAL · Invesco Exchange-Traded Fund Trust … | 0,18% | 16.154 SH | 23. Oktober 2026 | Täglich |
| DEUS · DBX ETF Trust | 0,17% | 5.309 NS | 31. August 2026 | N-PORT |
| FNY · First Trust Exchange-Traded AlphaDE… | 0,16% | 9.617 NS | 31. Juli 2026 | N-PORT |
| SMMD · iShares Trust | 0,15% | 64.262 SH | 11. September 2026 | Täglich |
| VB · VANGUARD INDEX FUNDS | 0,14% | 2.773.871 SH | 19. August 2026 | Täglich |
| PFIG · Invesco Exchange-Traded Fund Trust … | 0,13% | 170.000 | 23. Oktober 2026 | Täglich |
| QDEF · FlexShares Trust | 0,13% | 7.421 NS | 31. Juli 2026 | N-PORT |
| BSCU · Invesco Exchange-Traded Self-Indexe… | 0,12% | 3.789.000 | 22. Oktober 2026 | Täglich |
| BSCS · Invesco Exchange-Traded Self-Indexe… | 0,11% | 4.066.000 | 20. Oktober 2026 | Täglich |
| TILT · FlexShares Trust | 0,11% | 25.596 NS | 31. Juli 2026 | N-PORT |
| BSCT · Invesco Exchange-Traded Self-Indexe… | 0,11% | 3.410.000 | 22. Oktober 2026 | Täglich |
| IWS · iShares Trust | 0,11% | 180.403 SH | 11. September 2026 | Täglich |
| WSML · iShares Trust | 0,10% | 7.410 SH | 11. September 2026 | Täglich |
| DIVB · iShares Trust | 0,10% | 22.096 SH | 11. September 2026 | Täglich |
| FEUS · FlexShares Trust | 0,08% | 990 NS | 31. Juli 2026 | N-PORT |
| HDUS · Lattice Strategies Trust | 0,08% | 1.716 NS | 31. Juli 2026 | N-PORT |
| IWR · iShares Trust | 0,08% | 494.439 SH | 11. September 2026 | Täglich |
| JQUA · J.P. Morgan Exchange-Traded Fund Tr… | 0,06% | 55.399 NS | 31. Juli 2026 | N-PORT |
| XOEF · iShares Trust | 0,06% | 152 SH | 10. September 2026 | Täglich |
| VYM · VANGUARD WHITEHALL FUNDS | 0,05% | 480.516 SH | 19. August 2026 | Täglich |
| QARP · DBX ETF Trust | 0,05% | 395 NS | 31. August 2026 | N-PORT |
| FAD · First Trust Exchange-Traded AlphaDE… | 0,05% | 2.888 NS | 31. Juli 2026 | N-PORT |
| VOOV · VANGUARD ADMIRAL FUNDS | 0,04% | 27.877 SH | 19. August 2026 | Täglich |
| PFM · Invesco Exchange-Traded Fund Trust | 0,04% | 3.432 SH | 23. Oktober 2026 | Täglich |
| IVE · iShares Trust | 0,04% | 202.508 SH | 11. September 2026 | Täglich |
| LGDX · Tidal Trust III | 0,04% | 526 NS | 31. Juli 2026 | N-PORT |
| IUSV · iShares Trust | 0,03% | 105.704 SH | 11. September 2026 | Täglich |
| OMFL · Invesco Exchange-Traded Self-Indexe… | 0,03% | 17.926 SH | 23. Oktober 2026 | Täglich |
| RWL · Invesco Exchange-Traded Fund Trust … | 0,03% | 37.880 SH | 23. Oktober 2026 | Täglich |
| IUS · Invesco Exchange-Traded Self-Indexe… | 0,03% | 3.676 SH | 23. Oktober 2026 | Täglich |
| DSI · iShares Trust | 0,03% | 18.476 SH | 10. September 2026 | Täglich |
| VONV · VANGUARD SCOTTSDALE FUNDS | 0,03% | 72.731 SH | 19. August 2026 | Täglich |
| MNZL · EA Series Trust | 0,03% | 89 NS | 31. Juli 2026 | N-PORT |
| IWD · iShares Trust | 0,03% | 267.274 SH | 11. September 2026 | Täglich |
| SNPE · DBX ETF Trust | 0,03% | 8.630 NS | 31. August 2026 | N-PORT |
| DFSU · Dimensional ETF Trust | 0,03% | 6.545 NS | 31. Juli 2026 | N-PORT |
| DFAC · Dimensional ETF Trust | 0,03% | 134.796 NS | 31. Juli 2026 | N-PORT |
| EGLE · Global X Funds | 0,03% | 6 NS | 31. Juli 2026 | N-PORT |
| DCOR · Dimensional ETF Trust | 0,02% | 8.665 NS | 31. Juli 2026 | N-PORT |
| CATH · Global X Funds | 0,02% | 3.340 NS | 31. Juli 2026 | N-PORT |
| PRF · Invesco Exchange-Traded Fund Trust | 0,02% | 25.687 SH | 23. Oktober 2026 | Täglich |
| CHRI · Global X Funds | 0,02% | 18 NS | 31. Juli 2026 | N-PORT |
| XCLR · Global X Funds | 0,02% | 8 NS | 31. Juli 2026 | N-PORT |
| TOPC · iShares Trust | 0,02% | 76 SH | 10. September 2026 | Täglich |
| VOO · VANGUARD INDEX FUNDS | 0,02% | 3.142.393 SH | 19. August 2026 | Täglich |
| VTI · VANGUARD INDEX FUNDS | 0,02% | 3.842.273 SH | 19. August 2026 | Täglich |
| VONE · VANGUARD SCOTTSDALE FUNDS | 0,02% | 19.849 SH | 19. August 2026 | Täglich |
| VTHR · VANGUARD SCOTTSDALE FUNDS | 0,02% | 10.125 SH | 19. August 2026 | Täglich |
| ESGV · VANGUARD WORLD FUND | 0,02% | 27.229 SH | 19. August 2026 | Täglich |
| XTR · Global X Funds | 0,02% | 10 NS | 31. Juli 2026 | N-PORT |
| XYLG · Global X Funds | 0,02% | 131 NS | 31. Juli 2026 | N-PORT |
| XYLD · Global X Funds | 0,02% | 6.592 NS | 31. Juli 2026 | N-PORT |
| XVV · iShares Trust | 0,02% | 1.413 SH | 10. September 2026 | Täglich |
| PTLC · Pacer Funds Trust | 0,02% | 6.121 NS | 31. Juli 2026 | N-PORT |
| DFUS · Dimensional ETF Trust | 0,02% | 38.501 NS | 31. Juli 2026 | N-PORT |
| XRMI · Global X Funds | 0,02% | 88 NS | 31. Juli 2026 | N-PORT |
| SPUU · Direxion Shares ETF Trust | 0,02% | 456 NS | 31. Juli 2026 | N-PORT |
| IVV · iShares Trust | 0,02% | 1.529.217 SH | 11. September 2026 | Täglich |
| PBP · Invesco Exchange-Traded Fund Trust | 0,02% | 725 SH | 23. Oktober 2026 | Täglich |
| QDPL · Pacer Funds Trust | 0,02% | 2.903 NS | 31. Juli 2026 | N-PORT |
| IYY · iShares Trust | 0,02% | 5.230 SH | 11. September 2026 | Täglich |
| IWB · iShares Trust | 0,02% | 83.114 SH | 11. September 2026 | Täglich |
| IWV · iShares Trust | 0,02% | 33.941 SH | 10. September 2026 | Täglich |
| VOXP · Advisors Series Trust | 0,01% | 9 NS | 31. Juli 2026 | N-PORT |
| ITOT · iShares Trust | 0,01% | 154.584 SH | 11. September 2026 | Täglich |
| HCMT · Direxion Shares ETF Trust | 0,01% | 842 NS | 31. Juli 2026 | N-PORT |
| PHDG · Invesco Actively Managed Exchange-T… | 0,01% | 96 SH | 23. Oktober 2026 | Täglich |
| SPXL · Direxion Shares ETF Trust | 0,01% | 9.454 NS | 31. Juli 2026 | N-PORT |
| DXUV · Dimensional ETF Trust | 0,01% | 591 NS | 31. Juli 2026 | N-PORT |
| VT · VANGUARD INTERNATIONAL EQUITY INDEX… | 0,01% | 105.467 SH | 19. August 2026 | Täglich |
| DFAU · Dimensional ETF Trust | 0,01% | 8.905 NS | 31. Juli 2026 | N-PORT |
| ACVF · ETF Opportunities Trust | 0,01% | 107 NS | 31. Juli 2026 | N-PORT |
| FTLS · First Trust Exchange-Traded Fund III | -0,23% | -60.945 NS | 31. Juli 2026 | N-PORT |
| BIV · VANGUARD BOND INDEX FUNDS | · | · | 15. Juli 2026 | Täglich |
| BSV · VANGUARD BOND INDEX FUNDS | · | · | 15. Juli 2026 | Täglich |
| BND · VANGUARD BOND INDEX FUNDS | · | · | 15. Juli 2026 | Täglich |
| VCSH · VANGUARD SCOTTSDALE FUNDS | · | · | 15. Juli 2026 | Täglich |
| VCIT · VANGUARD SCOTTSDALE FUNDS | · | · | 15. Juli 2026 | Täglich |
| VTC · VANGUARD SCOTTSDALE FUNDS | · | · | 30. Juli 2026 | Täglich |
| BNDW · VANGUARD SCOTTSDALE FUNDS | · | · | 30. Juli 2026 | Täglich |
| ISCB · iShares Trust | · | 5.446 SH | 11. September 2026 | Täglich |
| ISCV · iShares Trust | · | 26.808 SH | 11. September 2026 | Täglich |
CLX Analysten-Konsens Bullische und bärische Analystenmeinungen, 12-Monats-Kursziel, Aufwärtspotenzial
12-Monats-Kursziel
17 Analysten · 2026-10-25Mittelwert-Ziel $96.35 +11,5%
Peer-Vergleich (GICS-Subbranche) Wichtige Kennzahlen im Vergleich zu Branchenkollegen
FY-Basis, Kurse zum Schlusskurs am Ende des letzten Geschäftsjahres jedes Unternehmens.
| Ticker | Marktkapitalisierung | P/E | Umsatz Vj. | Nettomarge | ROE | Bruttogewinnmarge |
|---|---|---|---|---|---|---|
| CLX | $11.54B | 19.8 | -5.4% | 8.7% | 285.6% | 42.3% |
| PG | $340.77B | 22.2 | 3.3% | 18.4% | 29.8% | · |
| CL | $63.31B | 30.0 | 1.4% | 10.5% | 1603.0% | 60.1% |
| KMB | $33.49B | 16.6 | -2.1% | 12.3% | 172.6% | 36.0% |
| CHD | · | 27.8 | 1.6% | 11.9% | 17.5% | 44.7% |
| REYN | $4.82B | 16.0 | 0.70% | 8.1% | 13.7% | 24.6% |
| WDFC | $2.93B | 32.4 | 5.0% | 14.7% | 35.7% | 55.1% |
| CENT | · | 13.0 | -2.2% | 5.2% | 10.5% | 31.9% |
| SPB | · | 13.6 | -5.2% | · | · | · |
| ENR | $1.70B | 7.5 | 2.3% | 8.1% | 157.3% | 41.8% |
| ODC | $1.98B | · | 1.7% | 11.5% | 20.0% | 27.8% |
Neueste Nachrichten Aktuelle Schlagzeilen über dieses Unternehmen
Meine Kennzahlen Ihre persönliche Watchlist — ausgewählte Zeilen aus den vollständigen Fundamentaldaten
Wählen Sie die Kennzahlen, die für Sie wichtig sind — klicken Sie auf das + neben jeder Zeile in den vollständigen Fundamentaldaten oben.
Ihre Auswahl wird gespeichert und begleitet Sie über alle Ticker hinweg.