
MSCI MSCI Inc. Common Stock
NYSE · Financial Services · Auf SEC EDGAR ansehen ↗ 10-K/10-Q Okt 20, 2026MSCI Aktien-Snapshot Kurs, Marktkapitalisierung, P/E, EPS, ROE, Schulden/Eigenkapital, 52-Wochen-Spanne
MSCI Aktienkurs-Chart Täglich OHLCV mit technischen Indikatoren — Schwenken, Zoom und Ansicht anpassen
Die Balkengranularität passt sich der ausgewählten Periode an – bewegen Sie den Mauszeiger über das Diagramm, um Eröffnungs-/Höchst-/Tiefst-/Schlusskurse für einen Balken anzuzeigen.
Über MSCI Inc. Common Stock Unternehmensübersicht von Wikipedia
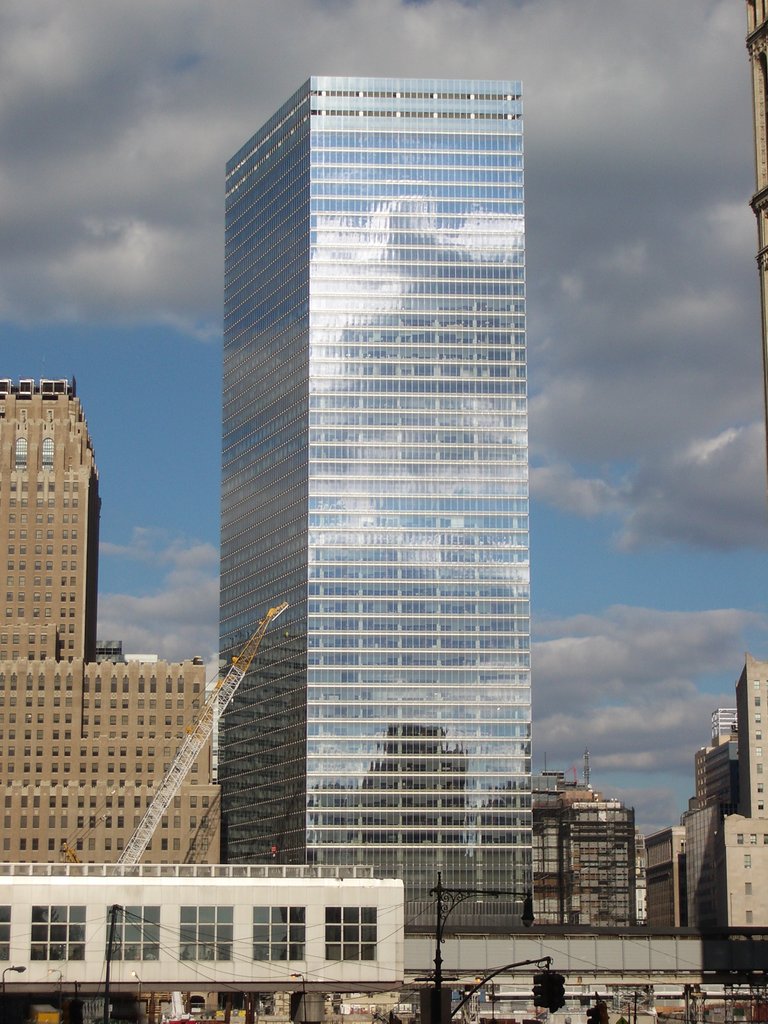
MSCI Inc. (ehemals Morgan Stanley Capital International und MSCI Barra) ist ein in New York City ansässiger US-amerikanischer Finanzdienstleister, der Finanzdienstleistungen vor allem für das Investment Banking anbietet. Dies umfasst neben internationalen Aktienindizes auch Portfolio- und Risiko-Analysen sowie Forschung.
Geschichte
Im Jahr 1968 veröffentlichte Capital International die ersten globalen Aktienindizes. Diese wurden von Morgan Stanley im Jahr 1986 lizenziert und unter dem Namen Morgan Stanley Capital International veröffentlicht. 1998 wurde MSCI Inc. von Morgan Stanley und Capital International gegründet. 2004 wurde Barra von MSCI übernommen. MSCI wurde 2007 an der New York Stock Exchange gelistet. 2009 trennte sich Morgan Stanley vollständig von MSCI. 2010 kaufte MSCI Riskmetrics und Measurisk. 2012 wurde IPD Investment Property Databank erworben.
Indizes
MSCI gibt eine Vielzahl verschiedener Aktienindizes heraus, die nach unterschiedlichen Kriterien zusammengesetzt werden, zum Beispiel nach Ländern oder Regionen und nach der Marktkapitalisierung von Aktien (Large Cap, Mid Cap, Small Cap) oder nach sozialer Nachhaltigkeit (Socially Responsible Investing) und zusätzlich nach ökologischer Nachhaltigkeit (Environmental, Social & Governance). Sie werden von vielen Investmentfonds und privaten Anlegern als Benchmark (Vergleichsmaßstab) für die Entwicklung der Rendite eines Portfolios verwendet oder es werden Indexfonds auf sie angelegt.
Ein wichtiges Kriterium ist auch der wirtschaftliche Entwicklungsstand eines Landes: Industrieländer (developed markets) werden von Schwellenländern (emerging markets) und Entwicklungsländern an der Grenze zu Schwellenländern (so genannte Grenzmärkte; englisch frontier markets) unterschieden. Meist werden mehrere dieser Kriterien herangezogen, zum Beispiel für den wichtigen MSCI World Index sowohl der Entwicklungsstand (nur Industrieländer) als auch die Marktkapitalisierung (nur Large- und Mid-Cap-Aktien). Ziel ist es jeweils, die Kursentwicklung von ca. 85 % der frei handelbaren Aktien des entsprechenden Anlage-Universums nachzuzeichnen (die Regionen usw. der länderübergreifenden Indizes werden in den Factsheets irreführend als countries, also Länder, bezeichnet).
Die bekanntesten Indizes von MSCI sind:
MSCI World: globaler Index mit Aktien aus 23 Industrieländern;
MSCI USA: Aktien von Unternehmen mit Sitz in den Vereinigten Staaten;
MSCI Europe: Aktien aus 15 europäischen Industrieländern;
MSCI Emerging Markets: Aktien aus 24 Schwellenländern;
MSCI ACWI (All Country World Index): Aktien aus den 47 Ländern des MSCI World und des MSCI Emerging Markets;
MSCI EAFE (Europe, Australasia, Far East): die Industrieländer aus dem MSCI World ohne Nordamerika (Kanada, USA);
MSCI FM: Aktien aus 28 weiteren Ländern an der Grenze zu Schwellenländern.
Der Stammindex wird in der Regel auf Dollar-Basis berechnet, sie werden aber auch in anderen Währungen angeboten, die durch Devisenterminkontrakte auf Sicht eines Monats gegen Schwankungen der Fremdwährungen abgesichert sind, z. B. „EUR hedged“. Die Stammindizes verstehen sich darüber hinaus als reine Kursindizes, es gibt sie auch als Performance-Indizes, also mit eingerechneten und reinvestierten Dividenden und Sonderzahlungen, diese teilweise auch bereinigt um die Quellensteuer.
Zu den größeren Stammindizes gibt es zurzeit (2021) acht Faktorindizes, deren Aktien nach bestimmten – öffentlich nur allgemein kommunizierten – Kriterien ausgewählt werden und die in der Vergangenheit eine überdurchschnittliche Kursentwicklung verzeichnen konnten:
Low volatility: Aktien mit geringen Kursschwankungen
Yield: Unternehmen mit langfristig stabilen Erträgen und Dividenden
Momentum: Aktien mit überdurchschnittlicher Kursentwicklung in der jüngeren Vergangenheit
Quality: Substanzwerte mit geringer Verschuldung, stabilen Erträgen „und anderen Qualitätsmerkmalen“ (O-Ton)
Equal size: alle Aktien gleichgewichtet (d. h. nicht nach Marktkapitalisierung)
Growth: stark wachsende Unternehmen mit guten Zukunftsperspektiven (auf Basis der in den Geschäftsberichten kommunizierten Gewinnerwartungen und Analystenschätzungen)
Value: unterbewertete Aktien (auf Basis der Fundamentaldaten im Vergleich zu den Mitbewerbern)
All dies geschieht, damit die Fondsgesellschaften als Kunden von MSCI entsprechende Fonds und ETF auflegen können.
Jede Aktiengesellschaft wird gemäß dem von MSCI und Standard & Poor’s entwickelten Global Industry Classification Standard (GICS) nach ihrer Hauptgeschäftstätigkeit genau einem dieser 11 Sektoren zugeordnet, für die in der Regel auch eigene Sektoren- und darüber hinaus teilweise Branchen-Indizes berechnet werden:
Energy (Gewinnung, Raffinierung und Vertrieb fossiler Energieträger, dazugehörige Ausrüster und Dienstleister)
Materials (Chemie-Industrie [ohne Haushaltschemie], Baustoffe, Behältnisse und Verpackungen, Metalle und ihre Gewinnung, Papier und andere Holzprodukte)
Industrials (kommerzielle Investitionsgüter inkl. Nutzfahrzeuge, dazugehörige Dienstleistungen, Transport-Unternehmen)
Consumer Discretionary („Nicht-Basiskonsumgüter“: Pkw und Zulieferer, Kleidung inkl. Luxuswaren, Waren für die Freizeitgestaltung, Verbraucher-Dienstleistungen inkl. Hotels, Restaurants und Reise-Anbieter, zu all diesem gehörige Dienstleister und Händler inkl. Internet-Händler)
Consumer Staples („Basiskonsumgüter“: Handel und Produktion von Nahrungsmitteln inkl. frei verkäufliche Medikamente und Tabakwaren, Haushaltswaren inkl. Reinigungs- und Pflegeprodukte)
Health Care (Medizinische Ausrüstung und Dienstleistungen, Pharmazie, Biotechnologie und Biowissenschaften)
Financials (Banken, weitere Finanzdienstleistungen inkl. Börsen, Rating-Agenturen, Holdings usw., Versicherungen)
Information Technology (Software und dazugehörige Dienstleistungen, Hardware-Herstellung und Ausrüstung, Halbleiter-Produktion)
Communication Services (Telekommunikation, Medien- und Unterhaltung)
Utilities (Energie- und Gasversorger inkl. Produzenten alternativer Energien, integrierte Versorger, Wasserversorger)
Real Estate (Immobiliengesellschaften inkl. Real-Estate-Investment-Trusts, dazugehörige Dienstleister)
Darüber hinaus bietet MSCI sektorübergreifende Themenindizes zu Megatrends an. Derzeit (2024) zählen dazu unter anderem Robotik und Künstliche Intelligenz, Cybersecurity, erneuerbare Energien, Biotechnologie oder die Mobilität der Zukunft. Nicht für alle Themen gibt es in Deutschland zugelassene Fonds.
Auch bietet MSCI eine Reihe von Scharia-konformen Indizes, z. B. den MSCI World Islamic Index, an. Sharia-konforme Indizes schließen Wertpapiere aus, die hinsichtlich ihrer Unternehmensaktivität oder Finanzkennzahlen nicht im Einklang mit den religiösen Regeln des Islam stehen (siehe Islamisches Finanzwesen).
Auch für Anleihen gibt MSCI eine Vielzahl von Indizes heraus, differenziert nach Regionen, Ländern, Restlaufzeit, Bonität und/oder Typ (z. B. Staats-, Unternehmens-, Hypotheken-, Wandelanleihen usw.).
Quelle: Wikipedia, CC BY-SA 4.0 · Auf Wikipedia ansehen ↗
10-Jahres-Performance Umsatz-, Nettoergebnis-, Margen- und EPS-Trends
Bewertung P/E-, P/S-, P/B-, EV/EBITDA-Verhältnisse — ist die Aktie teuer oder günstig?
| Kennzahl | 5-Jahres-Trend | MSCI | 5-Jahres-Durchschnitt | Peer-Median | Fazit |
|---|---|---|---|---|---|
| P/E (TTM) | 32.05-Jahres-Durchschnitt ≈46.5 | ≈46.5 | 23.5 | Überbewertet | |
| P/S (TTM) | 12.65-Jahres-Durchschnitt ≈17.7 | ≈17.7 | 5.9 | Überbewertet | |
| K/B (MRQ) | -14.45-Jahres-Durchschnitt ≈-94.4 | ≈-94.4 | · | · | |
| EV / EBITDA | 28.65-Jahres-Durchschnitt ≈35.3 | ≈35.3 | 22.7 | Überbewertet | |
| Kurs / FCF (TTM) | 27.65-Jahres-Durchschnitt ≈37.0 | ≈37.0 | · | · | |
| Kurs / Cashflow (TTM) | 26.95-Jahres-Durchschnitt ≈36.3 | ≈36.3 | 23.1 | Überbewertet | |
| EV / Revenue (EV / Umsatz) | 15.95-Jahres-Durchschnitt ≈19.3 | ≈19.3 | · | · | |
| EV / FCF | 32.15-Jahres-Durchschnitt ≈40.2 | ≈40.2 | · | · | |
| Kurs / Materieller Buchwert (MRQ) | -11.1 | · | · | · | |
| PEG Ratio (PEG-Ratio) | ≈1.9 | · | · | · |
Der Median der Vergleichsgruppe wird pro Kennzahl standardisiert berechnet und stimmt möglicherweise nicht immer mit der für diese Aktie angezeigten TTM/MRQ-Basis überein.
Rentabilität Brutto-, Betriebs- und Nettomargen; ROE, ROA, ROIC
| Kennzahl | 5-Jahres-Trend | MSCI | 5-Jahres-Durchschnitt | Peer-Median | Fazit |
|---|---|---|---|---|---|
| Betriebsgewinnmarge (TTM) | 55.7%5-Jahres-Durchschnitt ≈53.8% | ≈53.8% | 41.1% | Spitzenklasse | |
| EBITDA-Marge (TTM) | 56.4%5-Jahres-Durchschnitt ≈54.8% | ≈54.8% | 41.1% | Spitzenklasse | |
| Vorgewinnmarge (TTM) | 47.3%5-Jahres-Durchschnitt ≈47.5% | ≈47.5% | 38.7% | Spitzenklasse | |
| Nettogewinnmarge (TTM) | 40.3%5-Jahres-Durchschnitt ≈39.4% | ≈39.4% | 27.9% | Spitzenklasse | |
| ROA (TTM) | 25.2%5-Jahres-Durchschnitt ≈19.0% | ≈19.0% | 8.9% | Spitzenklasse | |
| ROE (TTM) | -56.1%5-Jahres-Durchschnitt ≈-147.7% | ≈-147.7% | 14.3% | Schwach | |
| ROIC | 38.9%5-Jahres-Durchschnitt ≈31.2% | ≈31.2% | 11.4% | Spitzenklasse |
Finanzielle Gesundheit Verschuldung, Liquidität, Solvenz — Bilanzstärke
| Kennzahl | 5-Jahres-Trend | MSCI | 5-Jahres-Durchschnitt | Peer-Median | Fazit |
|---|---|---|---|---|---|
| Fremdkapital / Eigenkapital (MRQ) | -2.25-Jahres-Durchschnitt ≈-8.6 | ≈-8.6 | 0.7 | Geringe Verschuldung | |
| Liquiditätsgrad (MRQ) | 0.85-Jahres-Durchschnitt ≈1.2 | ≈1.2 | 1.0 | Geringe Liquidität | |
| Quick Ratio | 0.35-Jahres-Durchschnitt ≈0.8 | ≈0.8 | 0.4 | Geringe Liquidität | |
| Langfristige Schulden / Eigenkapital (MRQ) | -2.25-Jahres-Durchschnitt ≈-8.6 | ≈-8.6 | 0.5 | Geringe Verschuldung |
Wachstum Umsatz-, EPS- und Nettoergebniswachstum: YoY, 3-Jahres-CAGR, 5-Jahres-CAGR
| Kennzahl | 5-Jahres-Trend | MSCI | 5-Jahres-Durchschnitt | Peer-Median | Fazit |
|---|---|---|---|---|---|
| Revenue YoY (Umsatz YoY) | 9.8%5-Jahres-Durchschnitt ≈13.1% | ≈13.1% | · | · | |
| Revenue CAGR 3Y (Umsatz CAGR 3J) | 11.7%5-Jahres-Durchschnitt ≈12.6% | ≈12.6% | · | · | |
| Revenue CAGR 5Y (Umsatz CAGR 5J) | 13.1% | · | · | · | |
| EPS YoY (EPS VjV) | 11.7%5-Jahres-Durchschnitt ≈17.8% | ≈17.8% | · | · | |
| Net Income YoY (Nettogewinn YoY) | 8.4%5-Jahres-Durchschnitt ≈15.5% | ≈15.5% | · | · | |
| EPS CAGR 3Y (EPS CAGR 3J) | 13.5%5-Jahres-Durchschnitt ≈19.1% | ≈19.1% | · | · | |
| EPS CAGR 5Y (EPS CAGR 5J) | 17.1% | · | · | · | |
| Net Income CAGR 3Y (Nettoergebnis CAGR 3J) | 11.4%5-Jahres-Durchschnitt ≈16.9% | ≈16.9% | · | · | |
| Net Income CAGR 5Y (Nettoergebnis CAGR 5J) | 14.8% | · | · | · |
Kapitaleffizienz Umsatz pro Vermögenswert, Lagerumschlag, Forderungsumschlag
| Kennzahl | 5-Jahres-Trend | MSCI | 5-Jahres-Durchschnitt | Peer-Median | Fazit |
|---|---|---|---|---|---|
| Asset Turnover (Umsatz / Vermögenswerte) | 0.65-Jahres-Durchschnitt ≈0.5 | ≈0.5 | 0.3 | Spitzenklasse | |
| Revenue / Employee (Umsatz / Mitarbeiter) | ≈$500.8K | · | · | · |
Wert · ≈ 5-Jahres-Durchschnitt · Branchenmedian · Urteil relativ zum Median
Dividenden Rendite, Ausschüttungsquote, Dividendenhistorie, 5-Jahres-CAGR
| Ex-Datum | Betrag | Währung | Rendite |
|---|---|---|---|
| Aug 14, 2026 | $2,05 | USD | ≈1.4% |
| Mai 15, 2026 | $2,05 | USD | ≈1.4% |
| Feb 13, 2026 | $2,05 | USD | ≈1.4% |
| Nov 14, 2025 | $1,80 | USD | ≈1.3% |
| Aug 15, 2025 | $1,80 | USD | ≈1.3% |
| Mai 16, 2025 | $1,80 | USD | ≈1.2% |
| Feb 14, 2025 | $1,80 | USD | ≈1.2% |
| Nov 15, 2024 | $1,60 | USD | ≈1.1% |
| Aug 16, 2024 | $1,60 | USD | ≈1.1% |
| Mai 16, 2024 | $1,60 | USD | ≈1.2% |
| Feb 15, 2024 | $1,60 | USD | ≈1.00% |
| Nov 8, 2023 | $1,38 | USD | ≈1.1% |
| Aug 10, 2023 | $1,38 | USD | ≈0.99% |
| Mai 11, 2023 | $1,38 | USD | ≈1.1% |
| Feb 16, 2023 | $1,38 | USD | ≈0.89% |
| Nov 9, 2022 | $1,25 | USD | ≈0.98% |
| Aug 11, 2022 | $1,25 | USD | ≈0.87% |
| Mai 12, 2022 | $1,04 | USD | ≈1.1% |
| Feb 17, 2022 | $1,04 | USD | ≈0.73% |
| Nov 10, 2021 | $1,04 | USD | ≈0.57% |
Ergebnisverlauf EPS Ist vs. Schätzung, Überraschung %, Beat-Rate, nächstes Ergebnisdatum
| Zeitraum | Bericht | EPS Actual | EPS est. | Überraschung |
|---|---|---|---|---|
| 30. September 2026 | Okt 20, 2026 | $5.11 | $5.12 | -0.20% |
| 30. Juni 2026 | Jul 21, 2026 | $4.94 | $5.04 | -1.9% |
| 31. März 2026 | $4.55 | $4.53 | 0.37% | |
| 31. Dezember 2025 | $4.66 | $4.66 | -0.04% | |
| 30. September 2025 | $4.47 | $4.46 | 0.20% | |
| 30. Juni 2025 | $4.17 | $4.22 | -1.3% | |
| 31. März 2025 | $4.00 | $3.99 | 0.18% |
Vollständige Fundamentaldaten Alle Kennzahlen nach Jahr — Gewinn- und Verlustrechnung, Bilanz, Cashflow
Gewinn- und Verlustrechnung
| Kennzahl | Trend | 2025 | 2024 | 2023 | 2022 | 2021 | 2020 | 2019 | 2018 | 2017 | 2016 | 2015 | 2014 |
|---|---|---|---|---|---|---|---|---|---|---|---|---|---|
| Revenue | $3.13B | $2.86B | $2.53B | $2.25B | $2.04B | $1.70B | $1.56B | $1.43B | $1.27B | $1.15B | $1.08B | $997M | |
| Cost of Revenue | · | · | · | · | · | $292M | $295M | $287M | $274M | $252M | $268M | $277M | |
| R&D Expense | $178M | $159M | $132M | $107M | $112M | $101M | $98M | $81M | $76M | $75M | $77M | $71M | |
| SG&A Expense | $180M | $182M | $154M | $147M | $148M | $115M | $110M | $100M | $88M | $87M | $86M | $76M | |
| Operating Expenses | $1.42B | $1.33B | $1.14B | $1.04B | $971M | $811M | $802M | $747M | $694M | $663M | $671M | $660M | |
| Operating Income | $1.71B | $1.53B | $1.38B | $1.21B | $1.07B | $885M | $756M | $687M | $580M | $488M | $404M | $337M | |
| Interest Expense | · | · | $187M | $172M | $160M | $156M | $148M | $133M | $116M | $102M | $62M | $32M | |
| Interest Income | $16M | $21M | $34M | $12M | $1M | $5M | $16M | $20M | $6M | $3M | $1M | $851.0K | |
| Other Non-op | $-25M | $-8M | $-6M | $-4M | $-56M | $-47M | $-21M | $56M | $-3M | $-3M | $7M | $2M | |
| Pretax Income | $1.49B | $1.36B | $1.37B | $1.04B | $858M | $686M | $603M | $630M | $467M | $386M | $350M | $308M | |
| Income Tax | $292M | $247M | $220M | $173M | $132M | $84M | $40M | $122M | $163M | $125M | $120M | $109M | |
| Net Income | $1.20B | $1.11B | $1.15B | $871M | $726M | $602M | $564M | $508M | $304M | $261M | $224M | $284M | |
| EPS (Basic) | $15.72 | $14.09 | $14.45 | $10.78 | $8.80 | $7.19 | $6.66 | $5.83 | $3.36 | $2.72 | $2.05 | $2.45 | |
| EPS (Diluted) | $15.69 | $14.05 | $14.39 | $10.72 | $8.70 | $7.12 | $6.59 | $5.66 | $3.31 | $2.70 | $2.03 | $2.43 | |
| Shares (Basic) | 76,504,000 | 78,710,000 | 79,462,000 | 80,746,000 | 82,508,000 | 83,716,000 | 84,644,000 | 87,179,000 | 90,336,000 | 95,986,000 | 109,124,000 | 115,737,000 | |
| Shares (Diluted) | 76,636,000 | 78,960,000 | 79,843,000 | 81,215,000 | 83,479,000 | 84,517,000 | 85,536,000 | 89,701,000 | 91,914,000 | 96,540,000 | 109,926,000 | 116,706,000 | |
| EBITDA | $1.74B | $1.55B | $1.41B | $1.23B | $1.10B | $915M | $786M | $718M | $615M | $522M | $435M | $363M |
Bilanz
| Kennzahl | Trend | 2025 | 2024 | 2023 | 2022 | 2021 | 2020 | 2019 | 2018 | 2017 | 2016 | 2015 | 2014 |
|---|---|---|---|---|---|---|---|---|---|---|---|---|---|
| Cash & Equivalents | $515M | $409M | $462M | $994M | $1.42B | $1.30B | $1.51B | $904M | $890M | $792M | $778M | $509M | |
| Receivables | · | · | · | $663M | $665M | $559M | $499M | $473M | $328M | $222M | $208M | $179M | |
| Prepaid Expense | $74M | $66M | $58M | $55M | $51M | $46M | $44M | $38M | $35M | $30M | $31M | $31M | |
| Current Assets | $1.64B | $1.34B | $1.42B | $1.75B | $2.14B | $1.93B | $2.08B | $1.44B | $1.27B | $1.06B | $1.06B | $769M | |
| PP&E (Net) | $87M | $71M | $56M | $54M | $67M | $80M | $91M | $91M | $94M | $96M | $99M | $94M | |
| PP&E (Gross) | $268M | $251M | $268M | $252M | $253M | $262M | $259M | $276M | $266M | $232M | $214M | $187M | |
| Accum. Depreciation | $181M | $180M | $212M | $198M | $186M | $181M | $169M | $186M | $171M | $137M | $115M | $93M | |
| Goodwill | $2.92B | $2.92B | $2.89B | $2.23B | $2.24B | $1.57B | $1.56B | $1.55B | $1.56B | $1.56B | $1.57B | $1.56B | |
| Intangibles | $832M | $908M | $956M | $559M | $593M | $235M | $261M | $281M | $322M | $348M | $391M | $434M | |
| Other Non-current Assets | $56M | $48M | $44M | $37M | $63M | $24M | $20M | $21M | $20M | $18M | $18M | $17M | |
| Total Assets | $5.70B | $5.45B | $5.52B | $5.00B | $5.51B | $4.20B | $4.20B | $3.39B | $3.28B | $3.08B | $3.15B | $2.88B | |
| Accounts Payable | $15M | $15M | $10M | $15M | $13M | $14M | $6M | $4M | $2M | $568.0K | $3M | $3M | |
| Accrued Liabilities | · | · | · | · | · | · | · | · | · | $83M | $61M | $48M | |
| Current Liabilities | $1.83B | $1.59B | $1.52B | $1.25B | $1.25B | $1.02B | $901M | $809M | $608M | $537M | $498M | $473M | |
| Capital Leases | $108M | $121M | $120M | $132M | $150M | $152M | $164M | · | · | · | · | · | |
| Deferred Tax | $102M | $48M | $27M | $29M | $4M | $13M | $67M | $82M | $78M | $94M | $111M | $138M | |
| Other Non-current Liabilities | $116M | $120M | $97M | $91M | $104M | $88M | $78M | $88M | $111M | $59M | $57M | $51M | |
| Total Liabilities | $8.36B | $6.39B | $6.26B | $6.01B | $5.67B | $4.64B | $4.28B | $3.55B | $2.87B | $2.76B | $2.25B | $1.45B | |
| Long-term Debt | $6.20B | $4.51B | $4.51B | $4.51B | $4.16B | $3.37B | · | · | · | · | · | $788M | |
| Total Debt | $6.20B | $4.51B | $4.51B | $4.51B | $4.16B | $3.37B | $3.07B | $2.58B | $2.08B | $2.08B | $1.58B | $800M | |
| Common Stock | $1M | $1M | $1M | $1M | $1M | $1M | $1M | $1M | $1M | $1M | $1M | $1M | |
| Retained Earnings | $5.43B | $4.78B | $4.18B | $3.47B | $2.98B | $2.55B | $2.20B | $1.86B | $1.51B | $1.32B | $1.16B | $1.02B | |
| Treasury Stock | $9.83B | $7.33B | $6.45B | $5.94B | $4.54B | $4.34B | $3.57B | $3.27B | $2.32B | $2.17B | $1.40B | $588M | |
| AOCI | $-52M | $-71M | $-61M | $-60M | $-59M | $-59M | $-63M | $-58M | $-48M | $-61M | $-36M | $-25M | |
| Stockholders' Equity | $-2.65B | $-940M | $-740M | $-1.01B | $-163M | $-443M | $-77M | $-166M | $401M | $318M | $901M | $1.43B | |
| Liabilities + Equity | $5.70B | $5.45B | $5.52B | $5.00B | $5.51B | $4.20B | $4.20B | $3.39B | $3.28B | $3.08B | $3.15B | $2.88B | |
| Shares Outstanding | 73,600,000 | 77,744,588 | 79,091,212 | 79,959,989 | 82,439,449 | 82,573,407 | 84,794,930 | 84,174,138 | 90,104,885 | 91,279,590 | 101,013,148 | 112,072,469 |
Cashflow
| Kennzahl | Trend | 2025 | 2024 | 2023 | 2022 | 2021 | 2020 | 2019 | 2018 | 2017 | 2016 | 2015 | 2014 |
|---|---|---|---|---|---|---|---|---|---|---|---|---|---|
| D&A | $23M | $17M | $21M | $27M | $29M | $30M | $30M | $31M | $35M | $34M | $31M | $26M | |
| Stock-based Comp | $111M | $95M | $72M | $58M | $55M | $51M | $41M | $39M | $37M | $32M | $29M | $27M | |
| Deferred Tax | $47M | $16M | $-15M | $36M | $-111M | $-56M | $-21M | $-780.0K | $-19M | $-17M | $-10M | $-8M | |
| Amort. of Intangibles | $169M | $164M | $114M | $91M | $81M | $57M | $49M | $54M | $45M | $47M | $47M | $46M | |
| Other Non-cash | $205M | $264M | $10M | $103M | $238M | $184M | $95M | $35M | $47M | $125M | $33M | $-26M | |
| Operating Cash Flow | $1.59B | $1.50B | $1.24B | $1.10B | $936M | $811M | $710M | $613M | $404M | $442M | $321M | $306M | |
| CapEx | $39M | $34M | $23M | $14M | $14M | $22M | $29M | $30M | $33M | $32M | $41M | $43M | |
| Investing Cash Flow | $-130M | $-144M | $-819M | $-79M | $-1.04B | $-242M | $-72M | $35M | $-48M | $-42M | $-49M | $297M | |
| Debt Issued | · | · | · | $355M | $1.80B | $1.41B | $1.00B | $500M | · | $500M | $800M | $800M | |
| Net Debt Issued | · | · | · | $348M | $752M | $263M | $487M | $500M | · | $500M | $800M | $-10M | |
| Stock Repurchased | $2.48B | $885M | $504M | $1.40B | $198M | $779M | $292M | $950M | $150M | $775M | $701M | $410M | |
| Net Stock Activity | $-2.48B | $-885M | $-504M | $-1.40B | $-198M | $-779M | $-292M | $-950M | $-150M | $-775M | $-701M | $-410M | |
| Dividends Paid | $557M | $509M | $441M | $373M | $302M | $246M | $223M | $171M | $120M | $96M | $88M | $20M | |
| Financing Cash Flow | $-1.36B | $-1.40B | $-954M | $-1.43B | $230M | $-779M | $-37M | $-626M | $-268M | $-373M | $5M | $-442M | |
| Net Change in Cash | $106M | $-52M | $-532M | $-428M | $121M | $-206M | $602M | $15M | $98M | $14M | $269M | $150M | |
| Taxes Paid | $222M | $201M | $240M | $181M | $223M | $114M | $73M | $143M | $129M | $98M | $130M | $120M | |
| Free Cash Flow | $1.55B | $1.47B | $1.21B | $1.08B | $923M | $789M | $680M | $583M | $371M | $402M | $265M | $263M | |
| Levered FCF | · | · | $1.06B | $939M | $788M | $652M | $542M | $475M | $295M | $334M | $224M | $242M |
Rentabilität
| Kennzahl | Trend | 2025 | 2024 | 2023 | 2022 | 2021 | 2020 | 2019 | 2018 | 2017 | 2016 | 2015 | 2014 |
|---|---|---|---|---|---|---|---|---|---|---|---|---|---|
| Operating Margin | 54.7% | 53.5% | 54.8% | 53.7% | 52.5% | 52.2% | 48.5% | 47.9% | 45.5% | 42.4% | 37.6% | 33.8% | |
| Net Margin | 38.4% | 38.8% | 45.4% | 38.7% | 35.5% | 35.5% | 36.2% | 35.4% | 23.9% | 22.7% | 20.8% | 28.5% | |
| Pretax Margin | 47.7% | 47.5% | 54.1% | 46.4% | 42.0% | 40.5% | 38.7% | 43.9% | 36.6% | 33.5% | 32.5% | 30.9% | |
| EBITDA Margin | 55.4% | 54.1% | 55.6% | 54.9% | 53.9% | 53.9% | 50.4% | 50.1% | 48.2% | 45.4% | 40.4% | 36.4% | |
| ROA | 21.6% | 20.2% | 21.9% | 16.6% | 15.0% | 14.3% | 14.8% | 15.2% | 9.6% | 8.4% | 7.4% | 9.4% | |
| ROE | -67.9% | -131.2% | -128.4% | -83.5% | -327.4% | -145.0% | -502.0% | 479.3% | 84.6% | 42.8% | 19.2% | 19.0% | |
| ROIC | 38.9% | 35.0% | 30.8% | 28.7% | 22.7% | 26.5% | 23.6% | 23.0% | 15.2% | 13.8% | 10.7% | 9.7% |
Liquidität & Solvenz
| Kennzahl | Trend | 2025 | 2024 | 2023 | 2022 | 2021 | 2020 | 2019 | 2018 | 2017 | 2016 | 2015 | 2014 |
|---|---|---|---|---|---|---|---|---|---|---|---|---|---|
| Current Ratio | 0.9 | 0.8 | 0.9 | 1.4 | 1.7 | 1.9 | 2.3 | 1.8 | 2.1 | 2.0 | 2.1 | 1.6 | |
| Quick Ratio | 0.3 | 0.3 | 0.3 | 1.3 | 1.7 | 1.8 | 2.2 | 1.7 | 2.0 | 1.9 | 2.0 | 1.5 | |
| Debt / Equity | -2.3 | -4.8 | -6.1 | -4.5 | -25.5 | -7.6 | -40.0 | -15.5 | 5.2 | 6.5 | 1.8 | 0.6 | |
| LT Debt / Equity | -2.3 | -4.8 | -6.1 | -4.5 | -25.5 | -7.6 | -40.0 | -15.5 | 5.2 | 6.5 | 1.8 | 0.6 | |
| Interest Coverage | · | · | 7.4 | 7.0 | 6.7 | 5.7 | 5.1 | 5.2 | 5.0 | 4.8 | 6.5 | 10.6 |
Effizienz
| Kennzahl | Trend | 2025 | 2024 | 2023 | 2022 | 2021 | 2020 | 2019 | 2018 | 2017 | 2016 | 2015 | 2014 |
|---|---|---|---|---|---|---|---|---|---|---|---|---|---|
| Asset Turnover | 0.6 | 0.5 | 0.5 | 0.4 | 0.4 | 0.4 | 0.4 | 0.4 | 0.4 | 0.4 | 0.4 | 0.3 | |
| Receivables Turnover | · | · | · | 3.4 | 3.3 | 3.2 | 3.2 | 3.6 | 4.6 | 5.4 | 5.6 | 5.7 |
Pro Aktie
| Kennzahl | Trend | 2025 | 2024 | 2023 | 2022 | 2021 | 2020 | 2019 | 2018 | 2017 | 2016 | 2015 | 2014 |
|---|---|---|---|---|---|---|---|---|---|---|---|---|---|
| Book Value / Share | $-36.09 | $-12.09 | $-9.35 | $-12.61 | $-1.98 | $-5.37 | $-0.90 | $-1.98 | $4.45 | $3.48 | $8.92 | $12.78 | |
| Revenue / Share | $40.90 | $36.17 | $31.67 | $27.69 | $24.48 | $20.06 | $18.21 | $15.99 | $13.86 | $11.92 | $9.78 | $8.54 | |
| Cash Flow / Share | $20.73 | $19.02 | $15.48 | $13.49 | $11.21 | $9.60 | $8.29 | $6.83 | $4.40 | $4.50 | $2.78 | $2.62 | |
| Cash / Share | $7.01 | $5.27 | $5.84 | $12.43 | $17.24 | $15.75 | $17.77 | $10.74 | $9.87 | $8.67 | $7.70 | $4.54 | |
| Dividend / Share | $7.20 | $6.40 | $5.52 | $4.58 | $3.64 | $2.92 | $2.52 | $1.92 | $1.32 | $1.00 | $0.80 | $0.18 | |
| Dividend Paid / Share | · | · | · | · | · | · | · | · | · | · | $0.80 | · | |
| EPS (TTM) | $15.69 | $14.05 | $14.39 | $10.72 | $8.70 | $7.12 | $6.59 | $5.66 | $3.31 | $2.70 | $2.03 | $2.43 |
Wachstumsraten
| Kennzahl | Trend | 2025 | 2024 | 2023 | 2022 | 2021 | 2020 | 2019 | 2018 | 2017 | 2016 | 2015 | 2014 |
|---|---|---|---|---|---|---|---|---|---|---|---|---|---|
| Revenue YoY | 9.8% | 12.9% | 12.5% | 10.0% | 20.5% | · | · | · | · | · | · | · | |
| Revenue CAGR 3Y | 11.7% | 11.8% | 14.3% | · | · | · | · | · | · | · | · | · | |
| Revenue CAGR 5Y | 13.1% | · | · | · | · | · | · | · | · | · | · | · | |
| EPS YoY | 11.7% | -2.4% | 34.2% | 23.2% | 22.2% | · | · | · | · | · | · | · | |
| EPS CAGR 3Y | 13.5% | 17.3% | 26.4% | · | · | · | · | · | · | · | · | · | |
| EPS CAGR 5Y | 17.1% | · | · | · | · | · | · | · | · | · | · | · | |
| Net Income YoY | 8.4% | -3.4% | 31.9% | 19.9% | 20.6% | · | · | · | · | · | · | · | |
| Net Income CAGR 3Y | 11.4% | 15.2% | 24.0% | · | · | · | · | · | · | · | · | · | |
| Net Income CAGR 5Y | 14.8% | · | · | · | · | · | · | · | · | · | · | · | |
| Dividends Paid CAGR 5Y | 17.7% | · | · | · | · | · | · | · | · | · | · | · |
Bewertung (TTM)
| Kennzahl | Trend | 2025 | 2024 | 2023 | 2022 | 2021 | 2020 | 2019 | 2018 | 2017 | 2016 | 2015 | 2014 |
|---|---|---|---|---|---|---|---|---|---|---|---|---|---|
| Revenue TTM | $3.13B | $2.86B | $2.53B | $2.25B | $2.04B | $1.70B | $1.56B | $1.43B | $1.27B | $1.15B | $1.08B | $997M | |
| Net Income TTM | $1.20B | $1.11B | $1.15B | $871M | $726M | $602M | $564M | $508M | $304M | $261M | $224M | $284M | |
| Market Cap | $42.21B | $46.65B | $44.74B | $37.19B | $50.51B | $36.87B | $21.89B | $12.41B | $11.40B | $7.19B | $7.29B | $5.32B | |
| Enterprise Value | $47.89B | $50.75B | $48.78B | $40.71B | $53.25B | $38.94B | $23.46B | $14.08B | $12.59B | $8.47B | $8.09B | $5.61B | |
| P/E | 36.6 | 42.7 | 39.3 | 43.4 | 70.4 | 62.7 | 39.2 | 26.0 | 38.2 | 29.2 | 35.5 | 19.5 | |
| P/S | 13.5 | 16.3 | 17.7 | 16.5 | 24.7 | 21.7 | 14.1 | 8.7 | 8.9 | 6.2 | 6.8 | 5.3 | |
| P/B | -15.9 | -49.6 | -60.5 | -36.9 | -309.0 | -83.2 | -285.4 | -74.5 | 28.4 | 22.6 | 8.1 | 3.7 | |
| P / Cash Flow | 26.6 | 31.1 | 36.2 | 34.0 | 54.0 | 45.5 | 30.9 | 20.3 | 28.2 | 16.5 | 23.8 | 17.4 | |
| P / FCF | 27.2 | 31.8 | 36.9 | 34.4 | 54.7 | 46.7 | 32.2 | 21.3 | 30.7 | 17.9 | 27.5 | 20.2 | |
| EV / EBITDA | 27.6 | 32.8 | 34.7 | 33.0 | 48.3 | 42.6 | 29.9 | 19.6 | 20.5 | 16.2 | 18.6 | 15.4 | |
| EV / FCF | 30.9 | 34.6 | 40.2 | 37.6 | 57.7 | 49.3 | 34.5 | 24.2 | 33.9 | 21.1 | 30.5 | 21.3 | |
| EV / Revenue | 15.3 | 17.8 | 19.3 | 18.1 | 26.1 | 23.0 | 15.1 | 9.8 | 9.9 | 7.4 | 7.5 | 5.6 | |
| Dividend Yield | 1.3% | 1.1% | 0.99% | 1.0% | 0.60% | 0.67% | 1.0% | 1.4% | 1.1% | 1.3% | 1.2% | 0.38% | |
| Earnings Yield | 2.7% | 2.3% | 2.5% | 2.3% | 1.4% | 1.6% | 2.5% | 3.8% | 2.6% | 3.4% | 2.8% | 5.1% | |
| Payout Ratio | 46.3% | 45.9% | 38.4% | 42.8% | 41.7% | 40.9% | 39.6% | 33.7% | 39.4% | 36.9% | 39.3% | 7.2% | |
| Annual Payout | $557M | $509M | $441M | $373M | $302M | $246M | $223M | $171M | $120M | $96M | $88M | $20M |
Gewinn- und Verlustrechnung
| Kennzahl | Trend | Q3 2026 | Q2 2026 | Q1 2026 | Q4 2025 | Q3 2025 | Q2 2025 | Q1 2025 | Q4 2024 | Q3 2024 | Q2 2024 | Q1 2024 | Q4 2023 | Q3 2023 | Q2 2023 | Q1 2023 | Q4 2022 |
|---|---|---|---|---|---|---|---|---|---|---|---|---|---|---|---|---|---|
| Revenue | $892M | $867M | $851M | $823M | $793M | $773M | $746M | $744M | $725M | $708M | $680M | $690M | $625M | $621M | $592M | $576M | |
| R&D Expense | $48M | $46M | $50M | $41M | $45M | $44M | $48M | $38M | $39M | $41M | $41M | $39M | $31M | $30M | $31M | $29M | |
| SG&A Expense | $48M | $46M | $69M | $43M | $42M | $38M | $57M | $44M | $42M | $40M | $57M | $40M | $37M | $36M | $41M | $34M | |
| Operating Expenses | $390M | $380M | $394M | $359M | $346M | $347M | $369M | $338M | $323M | $325M | $341M | $319M | $272M | $275M | $278M | $267M | |
| Operating Income | $502M | $488M | $457M | $464M | $448M | $425M | $377M | $405M | $401M | $383M | $339M | $371M | $353M | $346M | $315M | $309M | |
| Interest Expense | · | · | · | · | · | · | · | · | · | · | $47M | · | $47M | $47M | $46M | · | |
| Interest Income | $3M | $2M | $3M | $4M | $5M | $3M | $4M | $4M | $5M | $6M | $6M | $3M | $10M | $10M | $10M | $7M | |
| Other Non-op | $-2M | $-2M | $-1M | $-15M | $-3M | $-4M | $-3M | $-246.0K | $-3M | $-2M | $-3M | $-2M | $935.0K | $-3M | $-2M | $-4M | |
| Pretax Income | $428M | $417M | $389M | $389M | $396M | $378M | $331M | $363M | $357M | $340M | $296M | $468M | $318M | $307M | $276M | $266M | |
| Income Tax | $77M | $75M | $-17M | $104M | $71M | $74M | $42M | $58M | $76M | $73M | $40M | $64M | $58M | $60M | $38M | $51M | |
| Net Income | $351M | $342M | $406M | $285M | $325M | $304M | $289M | $306M | $281M | $267M | $256M | $403M | $260M | $247M | $239M | $215M | |
| EPS (Basic) | $4.87 | $4.70 | $5.54 | $3.82 | $4.26 | $3.92 | $3.72 | $3.91 | $3.58 | $3.37 | $3.23 | $5.09 | $3.28 | $3.10 | $2.98 | $2.69 | |
| EPS (Diluted) | $4.86 | $4.69 | $5.53 | $3.81 | $4.25 | $3.92 | $3.71 | $3.89 | $3.57 | $3.37 | $3.22 | $5.06 | $3.27 | $3.09 | $2.97 | $2.67 | |
| Shares (Basic) | 72,100,000 | 72,800,000 | 73,300,000 | · | 76,500,000 | 77,400,000 | 77,600,000 | · | 78,499,000 | 79,085,000 | 79,195,000 | · | 79,116,000 | 79,592,000 | 80,041,000 | · | |
| Shares (Diluted) | 72,300,000 | 72,900,000 | 73,400,000 | · | 76,600,000 | 77,500,000 | 77,800,000 | · | 78,729,000 | 79,245,000 | 79,508,000 | · | 79,500,000 | 79,905,000 | 80,482,000 | · | |
| EBITDA | $502M | $488M | $463M | · | $448M | $425M | $382M | · | $401M | $383M | $343M | · | $353M | $346M | $320M | · |
Bilanz
| Kennzahl | Trend | Q3 2026 | Q2 2026 | Q1 2026 | Q4 2025 | Q3 2025 | Q2 2025 | Q1 2025 | Q4 2024 | Q3 2024 | Q2 2024 | Q1 2024 | Q4 2023 | Q3 2023 | Q2 2023 | Q1 2023 | Q4 2022 |
|---|---|---|---|---|---|---|---|---|---|---|---|---|---|---|---|---|---|
| Cash & Equivalents | $261M | $356M | $385M | $515M | $400M | $347M | $361M | $409M | $501M | $451M | $519M | · | $929M | $792M | $1.08B | · | |
| Prepaid Expense | $87M | $91M | $82M | $73M | $67M | $65M | $73M | $66M | $64M | $56M | $56M | · | $53M | $49M | $55M | · | |
| Current Assets | $1.30B | $1.44B | $1.39B | $1.64B | $1.31B | $1.27B | $1.24B | $1.34B | $1.29B | $1.32B | $1.36B | · | $1.64B | $1.52B | $1.81B | · | |
| PP&E (Net) | $99M | $93M | $87M | $87M | $83M | $86M | $86M | $71M | $62M | $64M | $56M | · | $58M | $61M | $59M | · | |
| PP&E (Gross) | · | · | · | $268M | · | · | · | $251M | $242M | $248M | $244M | · | $268M | $269M | $262M | · | |
| Accum. Depreciation | · | · | · | $181M | · | · | · | $180M | $180M | $184M | $189M | · | $210M | $208M | $203M | · | |
| Goodwill | $3.05B | $2.97B | $2.96B | $2.92B | $2.92B | $2.93B | $2.92B | $2.92B | $2.92B | $2.91B | $2.89B | $2.89B | $2.23B | $2.23B | $2.23B | $2.23B | |
| Intangibles | $899M | $856M | $851M | $833M | $850M | $869M | $887M | $908M | $931M | $949M | $948M | · | $536M | $546M | $551M | · | |
| Other Non-current Assets | $53M | $56M | $57M | $56M | $67M | $62M | $58M | $48M | $50M | $49M | $48M | · | $39M | $37M | $41M | · | |
| Total Assets | $5.60B | $5.60B | $5.55B | $5.70B | $5.39B | $5.37B | $5.34B | $5.45B | $5.41B | $5.46B | $5.48B | · | $4.87B | $4.76B | $5.06B | · | |
| Accounts Payable | $6M | $17M | $10M | $15M | $16M | $12M | $11M | $15M | $9M | $13M | $12M | · | $10M | $7M | $11M | · | |
| Current Liabilities | $1.57B | $1.61B | $1.61B | $1.83B | $1.48B | $1.47B | $1.47B | $1.59B | $1.38B | $1.38B | $1.37B | · | $1.20B | $1.22B | $1.21B | · | |
| Capital Leases | $149M | $139M | $144M | $108M | $112M | $115M | $118M | $121M | $124M | $131M | $135M | · | $122M | $127M | $131M | · | |
| Deferred Tax | $30M | $28M | $25M | $102M | $83M | $52M | $52M | $48M | $61M | $70M | $18M | · | $4M | $18M | $27M | · | |
| Other Non-current Liabilities | $141M | $139M | $134M | $116M | $119M | $109M | $119M | $120M | $112M | $106M | $100M | · | $84M | $92M | $91M | · | |
| Total Liabilities | $8.61B | $8.29B | $8.32B | $8.36B | $7.31B | $6.26B | $6.30B | $6.39B | $6.16B | $6.19B | $6.13B | · | $5.91B | $5.96B | $5.96B | · | |
| Long-term Debt | $6.72B | $6.38B | $6.40B | $6.20B | $5.51B | $4.51B | $4.55B | $4.51B | $4.48B | $4.51B | $4.51B | · | $4.51B | $4.51B | $4.51B | · | |
| Total Debt | $6.72B | $6.38B | $6.40B | · | $5.51B | $4.51B | $4.55B | · | $4.48B | $4.51B | $4.51B | · | $4.51B | $4.51B | $4.51B | · | |
| Common Stock | $1M | $1M | $1M | $1M | $1M | $1M | $1M | $1M | $1M | $1M | $1M | · | $1M | $1M | $1M | · | |
| Retained Earnings | $6.08B | $5.88B | $5.68B | $5.43B | $5.28B | $5.09B | $4.93B | $4.78B | $4.60B | $4.45B | $4.31B | · | $3.89B | $3.74B | $3.60B | · | |
| Treasury Stock | $10.96B | $10.40B | $10.25B | $9.83B | $8.92B | $7.68B | $7.55B | $7.33B | $6.96B | $6.76B | $6.52B | · | $6.45B | $6.43B | $5.98B | · | |
| AOCI | $-58M | $-57M | $-59M | $-52M | $-54M | $-50M | $-64M | $-71M | $-53M | $-65M | $-64M | · | $-61M | $-57M | $-57M | · | |
| Stockholders' Equity | $-3.02B | $-2.69B | $-2.77B | $-2.65B | $-1.92B | $-886M | $-959M | $-940M | $-751M | $-734M | $-651M | $-740M | $-1.05B | $-1.19B | $-901M | $-1.01B | |
| Liabilities + Equity | $5.60B | $5.60B | $5.55B | $5.70B | $5.39B | $5.37B | $5.34B | $5.45B | $5.41B | $5.46B | $5.48B | · | $4.87B | $4.76B | $5.06B | · | |
| Shares Outstanding | 71,700,000 | 72,700,000 | 72,900,000 | 73,563,183 | 75,180,647 | 77,365,235 | 77,601,766 | 77,744,588 | 78,371,202 | 78,749,685 | 79,224,049 | 79,091,212 | 79,091,098 | 79,126,903 | 80,063,044 | 79,959,989 |
Cashflow
| Kennzahl | Trend | Q3 2026 | Q2 2026 | Q1 2026 | Q4 2025 | Q3 2025 | Q2 2025 | Q1 2025 | Q4 2024 | Q3 2024 | Q2 2024 | Q1 2024 | Q4 2023 | Q3 2023 | Q2 2023 | Q1 2023 | Q4 2022 |
|---|---|---|---|---|---|---|---|---|---|---|---|---|---|---|---|---|---|
| D&A | $6M | $6M | $6M | $7M | $6M | $5M | $5M | $4M | $4M | $4M | $4M | $5M | $5M | $5M | $5M | $6M | |
| Stock-based Comp | $28M | $25M | $48M | $26M | $23M | $23M | $40M | $23M | $19M | $19M | $34M | $16M | $18M | $16M | $21M | $12M | |
| Deferred Tax | · | · | · | · | · | · | · | $-16M | $-10M | $50M | $-8M | $16M | $-19M | $-10M | $-2M | $-23M | |
| Amort. of Intangibles | $45M | $44M | $42M | $41M | $41M | $44M | $44M | $43M | $42M | $41M | $39M | $37M | $27M | $26M | $25M | $24M | |
| Other Non-cash | · | · | $-153M | · | · | · | $-32M | · | · | · | $13M | · | · | · | $1M | · | |
| Operating Cash Flow | $436M | $371M | $307M | $501M | $449M | $336M | $302M | $431M | $422M | $349M | $300M | $389M | $291M | $292M | $264M | $315M | |
| CapEx | $13M | $11M | $3M | $12M | $4M | $11M | $12M | $14M | $7M | $9M | $4M | $4M | $4M | $9M | $6M | $6M | |
| Investing Cash Flow | $-167M | $-62M | $-70M | $-36M | $-26M | $-35M | $-33M | $-37M | $-28M | $-47M | $-32M | $-750M | $-21M | $-27M | $-22M | $-27M | |
| Stock Repurchased | $553M | $168M | $415M | $907M | $1.23B | $138M | $213M | $374M | $200M | $242M | $70M | $27.0K | $19M | $441M | $44M | $70M | |
| Net Stock Activity | · | · | $-415M | · | · | · | $-213M | · | · | · | $-70M | · | · | · | $-44M | · | |
| Dividends Paid | $148M | $150M | $150M | $135M | $138M | $140M | $144M | $125M | $126M | $127M | $131M | $109M | $109M | $110M | $112M | $100M | |
| Financing Cash Flow | $-365M | $-339M | $-364M | $-350M | $-369M | $-321M | $-322M | $-476M | $-350M | $-369M | $-207M | $-112M | $-130M | $-554M | $-158M | $-173M | |
| Net Change in Cash | $-95M | $-29M | $-130M | $115M | $53M | $-13M | $-49M | $-92M | $50M | $-68M | $58M | $-467M | $136M | $-288M | $87M | $126M | |
| Taxes Paid | $39M | $148M | $56M | $66M | $44M | $101M | $11M | $40M | $48M | $102M | $11M | $43M | $59M | $120M | $19M | $26M | |
| Free Cash Flow | · | · | $304M | · | · | · | $290M | · | · | · | $296M | · | · | · | $258M | · | |
| Levered FCF | · | · | · | · | · | · | · | · | · | · | $255M | · | · | · | $218M | · |
Rentabilität
| Kennzahl | Trend | Q3 2026 | Q2 2026 | Q1 2026 | Q4 2025 | Q3 2025 | Q2 2025 | Q1 2025 | Q4 2024 | Q3 2024 | Q2 2024 | Q1 2024 | Q4 2023 | Q3 2023 | Q2 2023 | Q1 2023 | Q4 2022 |
|---|---|---|---|---|---|---|---|---|---|---|---|---|---|---|---|---|---|
| Operating Margin | 56.3% | 56.2% | 53.7% | · | 56.4% | 55.0% | 50.5% | · | 55.4% | 54.0% | 49.9% | · | 56.5% | 55.7% | 53.1% | · | |
| Net Margin | 39.4% | 39.5% | 47.7% | · | 41.0% | 39.3% | 38.7% | · | 38.8% | 37.7% | 37.6% | · | 41.5% | 39.7% | 40.3% | · | |
| Pretax Margin | 48.0% | 48.1% | 45.8% | · | 50.0% | 48.9% | 44.4% | · | 49.2% | 48.0% | 43.5% | · | 50.8% | 49.5% | 46.7% | · | |
| EBITDA Margin | 56.3% | 56.2% | 54.4% | · | 56.4% | 55.0% | 51.2% | · | 55.4% | 54.0% | 50.5% | · | 56.5% | 55.7% | 54.0% | · | |
| ROA | 6.4% | 6.2% | 7.5% | · | 6.0% | 5.6% | 5.3% | · | 5.5% | 5.2% | 4.9% | · | 5.4% | 5.1% | 4.9% | · | |
| ROE | -14.2% | -19.1% | -21.8% | · | -24.4% | -37.5% | -35.9% | · | -31.2% | -27.7% | -33.0% | · | -24.4% | -22.2% | -26.8% | · | |
| ROIC | 11.1% | 10.8% | 13.1% | · | 10.2% | 9.4% | 9.2% | · | 8.5% | 8.0% | 7.6% | · | 8.3% | 8.4% | 7.5% | · |
Liquidität & Solvenz
| Kennzahl | Trend | Q3 2026 | Q2 2026 | Q1 2026 | Q4 2025 | Q3 2025 | Q2 2025 | Q1 2025 | Q4 2024 | Q3 2024 | Q2 2024 | Q1 2024 | Q4 2023 | Q3 2023 | Q2 2023 | Q1 2023 | Q4 2022 |
|---|---|---|---|---|---|---|---|---|---|---|---|---|---|---|---|---|---|
| Current Ratio | 0.8 | 0.9 | 0.9 | · | 0.9 | 0.9 | 0.8 | · | 0.9 | 1.0 | 1.0 | · | 1.4 | 1.3 | 1.5 | · | |
| Quick Ratio | 0.2 | 0.2 | 0.2 | · | 0.3 | 0.2 | 0.2 | · | 0.4 | 0.3 | 0.4 | · | 0.8 | 0.7 | 0.9 | · | |
| Debt / Equity | -2.2 | -2.4 | -2.3 | · | -2.9 | -5.1 | -4.7 | · | -6.0 | -6.1 | -6.9 | · | -4.3 | -3.8 | -5.0 | · | |
| LT Debt / Equity | -2.2 | -2.4 | -2.3 | · | -2.9 | -5.1 | -4.7 | · | -6.0 | -6.1 | -6.9 | · | -4.3 | -3.8 | -5.0 | · | |
| Interest Coverage | · | · | · | · | · | · | · | · | · | · | 7.3 | · | 7.5 | 7.4 | 6.8 | · |
Effizienz
| Kennzahl | Trend | Q3 2026 | Q2 2026 | Q1 2026 | Q4 2025 | Q3 2025 | Q2 2025 | Q1 2025 | Q4 2024 | Q3 2024 | Q2 2024 | Q1 2024 | Q4 2023 | Q3 2023 | Q2 2023 | Q1 2023 | Q4 2022 |
|---|---|---|---|---|---|---|---|---|---|---|---|---|---|---|---|---|---|
| Asset Turnover | 0.2 | 0.2 | 0.2 | · | 0.1 | 0.1 | 0.1 | · | 0.1 | 0.1 | 0.1 | · | 0.1 | 0.1 | 0.1 | · |
Pro Aktie
| Kennzahl | Trend | Q3 2026 | Q2 2026 | Q1 2026 | Q4 2025 | Q3 2025 | Q2 2025 | Q1 2025 | Q4 2024 | Q3 2024 | Q2 2024 | Q1 2024 | Q4 2023 | Q3 2023 | Q2 2023 | Q1 2023 | Q4 2022 |
|---|---|---|---|---|---|---|---|---|---|---|---|---|---|---|---|---|---|
| Book Value / Share | $-42.07 | $-36.99 | $-38.05 | · | $-25.48 | $-11.45 | $-12.35 | · | $-9.58 | $-9.33 | $-8.21 | · | $-13.26 | $-15.09 | $-11.26 | · | |
| Revenue / Share | $12.34 | $11.89 | $11.59 | · | $10.36 | $9.97 | $9.59 | · | $9.21 | $8.93 | $8.55 | · | $7.87 | $7.77 | $7.36 | · | |
| Cash Flow / Share | · | · | $4.18 | · | · | · | $3.88 | · | · | · | $3.77 | · | · | · | $3.28 | · | |
| Cash / Share | $3.64 | $4.90 | $5.29 | · | $5.32 | $4.49 | $4.65 | · | $6.39 | $5.73 | $6.55 | · | $11.74 | $10.01 | $13.50 | · | |
| Dividend / Share | $2.05 | $2.05 | $2.05 | $1.80 | $1.80 | $1.80 | $1.80 | $1.60 | $1.60 | $1.60 | $1.60 | $1.38 | $1.38 | $1.38 | $1.38 | $1.25 | |
| EPS (TTM) | $18.89 | $18.28 | $17.51 | · | $15.77 | $15.09 | $14.54 | · | $15.22 | $14.92 | $14.64 | · | $12.00 | $11.41 | $10.91 | · |
Bewertung (TTM)
| Kennzahl | Trend | Q3 2026 | Q2 2026 | Q1 2026 | Q4 2025 | Q3 2025 | Q2 2025 | Q1 2025 | Q4 2024 | Q3 2024 | Q2 2024 | Q1 2024 | Q4 2023 | Q3 2023 | Q2 2023 | Q1 2023 | Q4 2022 |
|---|---|---|---|---|---|---|---|---|---|---|---|---|---|---|---|---|---|
| Revenue TTM | $3.43B | $3.33B | $3.24B | · | $3.06B | $2.99B | $2.92B | · | $2.80B | $2.70B | $2.62B | · | $2.42B | $2.35B | $2.28B | · | |
| Net Income TTM | $1.38B | $1.36B | $1.32B | · | $1.22B | $1.18B | $1.14B | · | $1.21B | $1.19B | $1.17B | · | $960M | $917M | $881M | · | |
| Market Cap | $38.62B | $40.71B | $39.29B | · | $42.66B | $44.62B | $43.88B | · | $45.68B | $37.94B | $44.40B | · | $40.58B | $37.13B | $44.81B | · | |
| Enterprise Value | $45.08B | $46.74B | $45.31B | · | $47.77B | $48.79B | $48.07B | · | $49.67B | $41.99B | $48.39B | · | $44.16B | $40.85B | $48.24B | · | |
| P/E | 28.5 | 30.6 | 30.8 | · | 36.0 | 38.2 | 38.9 | · | 38.3 | 32.3 | 38.3 | · | 42.8 | 41.1 | 51.3 | · | |
| P/S | 11.3 | 12.2 | 12.1 | · | 14.0 | 14.9 | 15.0 | · | 16.3 | 14.0 | 17.0 | · | 16.8 | 15.8 | 19.6 | · | |
| P/B | -12.8 | -15.1 | -14.2 | · | -22.3 | -50.3 | -45.8 | · | -60.8 | -51.7 | -68.3 | · | -38.7 | -31.1 | -49.7 | · | |
| P / Cash Flow | · | · | 128.1 | · | · | · | 145.4 | · | · | · | 147.9 | · | · | · | 169.6 | · | |
| EV / Revenue | 13.1 | 14.0 | 14.0 | · | 15.6 | 16.3 | 16.5 | · | 17.7 | 15.5 | 18.5 | · | 18.3 | 17.4 | 21.2 | · | |
| Dividend Yield | 1.5% | 1.4% | 1.4% | · | 1.3% | 1.2% | 1.2% | · | 1.1% | 1.3% | 1.0% | · | 1.1% | 1.1% | 0.89% | · | |
| Earnings Yield | 3.5% | 3.3% | 3.2% | · | 2.8% | 2.6% | 2.6% | · | 2.6% | 3.1% | 2.6% | · | 2.3% | 2.4% | 1.9% | · | |
| Payout Ratio | · | · | 37.1% | · | · | · | 49.8% | · | · | · | 51.3% | · | · | · | 47.0% | · | |
| Annual Payout | $583M | $573M | $563M | · | $547M | $534M | $522M | · | $493M | $477M | $460M | · | $432M | $423M | $397M | · |
Aktuellster Zeitraum links · fehlende Werte werden als · angezeigt
Finanzberichte Gewinn- und Verlustrechnung, Bilanz, Cashflow — jährlich, letzte 5 Jahre
| Kennzahl | 2025-12-31 | 2024-12-31 | 2023-12-31 | 2022-12-31 | 2021-12-31 |
|---|---|---|---|---|---|
| Umsatz | $3.13B | $2.86B | $2.53B | $2.25B | $2.04B |
| Betriebsgewinnmarge % | 54.7% | 53.5% | 54.8% | 53.7% | 52.5% |
| Nettoergebnis | $1.20B | $1.11B | $1.15B | $871M | $726M |
| Verwässerte EPS | $15.69 | $14.05 | $14.39 | $10.72 | $8.70 |
| Kennzahl | 2025-12-31 | 2024-12-31 | 2023-12-31 | 2022-12-31 | 2021-12-31 |
|---|---|---|---|---|---|
| Fremdkapital / Eigenkapital | -2.3 | -4.8 | -6.1 | -4.5 | -25.5 |
| Liquiditätsgrad | 0.9 | 0.8 | 0.9 | 1.4 | 1.7 |
| Quick Ratio | 0.3 | 0.3 | 0.3 | 1.3 | 1.7 |
| Kennzahl | 2025-12-31 | 2024-12-31 | 2023-12-31 | 2022-12-31 | 2021-12-31 |
|---|---|---|---|---|---|
| Freier Cashflow | $1.55B | $1.47B | $1.21B | $1.08B | $923M |
Institutionelle Eigentümer (13F) 1.145 Einreicher · $41.2B gesamt · Stand 30. September 2026
Institutionen, die diese Aktie in ihrer vierteljährlichen SEC-Formular 13F melden. Nur Long-Positionen; ein einzelner Einreicher kann für separate Optionsscheine zweimal erscheinen. Große gegenläufige Put/Call-Positionen spiegeln typischerweise Market-Making oder abgesicherte Bestände wider, nicht die gerichtete Überzeugung.
| Neue Positionen | Geschlossene Positionen | Erhöht | Abgenommen | Nettoveränderung der Aktien |
|---|---|---|---|---|
| 116 (-35 vs. Vorquartal) | 85 (-38 vs. Vorquartal) | 391 (+34 vs. Vorquartal) | 416 (-9 vs. Vorquartal) | +2.6M |
Verglichen mit Q1 2026. SEC-Formular 13F-Einreichungen sind innerhalb von 45 Tagen nach Quartalsende fällig, zuzüglich einer kurzen Pufferzeit für verspätete Einreicher — Quartale, die noch in diesem Fenster liegen, werden zugunsten des letzten vollständig berichteten Paares übersprungen.
| Institution | Wert | Aktien | % der verfolgten 13F | Typ |
|---|---|---|---|---|
| VANGUARD GROUP INC | $5.373.392.815 | 9.365.717 | 13,06% | Aktien |
| BlackRock, Inc. | $3.062.625.846 | 5.468.585 | 7,44% | Aktien |
| VANGUARD CAPITAL MANAGEMENT LLC | $2.601.256.991 | 4.644.770 | 6,32% | Aktien |
| VANGUARD PORTFOLIO MANAGEMENT LLC | $2.331.863.750 | 4.163.745 | 5,67% | Aktien |
| BAMCO INC /NY/ | $1.798.710.150 | 3.211.753 | 4,37% | Aktien |
| STATE STREET CORP | $1.789.281.877 | 3.194.918 | 4,35% | Aktien |
| MORGAN STANLEY | $1.192.183.228 | 2.128.743 | 2,90% | Aktien |
| GEODE CAPITAL MANAGEMENT, LLC | $1.090.610.028 | 1.950.086 | 2,65% | Aktien |
| VIKING GLOBAL INVESTORS LP | $650.031.147 | 1.160.687 | 1,58% | Aktien |
| PRINCIPAL FINANCIAL GROUP INC | $631.332.568 | 1.127.265 | 1,53% | Aktien |
| Fiera Capital Corp | $484.421.719 | 864.977 | 1,18% | Aktien |
| NORGES BANK | $481.529.673 | 859.813 | 1,17% | Aktien |
| Mitsubishi UFJ Asset Management Co., Ltd. | $480.612.887 | 858.176 | 1,17% | Aktien |
| PineStone Asset Management Inc. | $480.005.313 | 891.110 | 1,17% | Aktien |
| Invesco Ltd. | $452.436.031 | 807.864 | 1,10% | Aktien |
| BAILLIE GIFFORD & CO | $445.929.609 | 796.246 | 1,08% | Aktien |
| MILLENNIUM MANAGEMENT LLC | $415.509.357 | 741.928 | 1,01% | Aktien |
| ARROWSTREET CAPITAL, LIMITED PARTNERSHIP | $405.501.442 | 724.058 | 0,99% | Aktien |
| POLEN CAPITAL MANAGEMENT LLC | $376.233.195 | 671.797 | 0,91% | Aktien |
| NORTHERN TRUST CORP | $376.134.065 | 671.620 | 0,91% | Aktien |
| EDGEWOOD MANAGEMENT LLC | $371.921.444 | 664.098 | 0,90% | Aktien |
| AQR CAPITAL MANAGEMENT LLC | $364.116.679 | 658.427 | 0,88% | Aktien |
| CHARLES SCHWAB INVESTMENT MANAGEMENT INC | $334.834.475 | 597.876 | 0,81% | Aktien |
| GOLDMAN SACHS GROUP INC | $327.131.082 | 584.121 | 0,79% | Aktien |
| JPMORGAN CHASE & CO | $324.539.847 | 581.611 | 0,79% | Aktien |
| GENERATION INVESTMENT MANAGEMENT LLP | $301.493.054 | 538.342 | 0,73% | Aktien |
| Winslow Capital Management, LLC | $296.626.865 | 529.653 | 0,72% | Aktien |
| WELLINGTON MANAGEMENT GROUP LLP | $284.107.732 | 507.299 | 0,69% | Aktien |
| Longview Partners (Guernsey) LTD | $259.696.148 | 463.710 | 0,63% | Aktien |
| CITADEL ADVISORS LLC | $257.935.382 | 460.566 | 0,63% | Aktien |
| Legal & General Group Plc | $257.687.284 | 460.123 | 0,63% | Aktien |
| Bank of New York Mellon Corp | $234.904.786 | 419.443 | 0,57% | Aktien |
| VANGUARD FIDUCIARY TRUST CO | $227.566.654 | 406.340 | 0,55% | Aktien |
| BANK OF AMERICA CORP /DE/ | $220.371.040 | 393.492 | 0,54% | Aktien |
| UBS Group AG | $219.981.471 | 392.796 | 0,53% | Aktien |
| BANQUE PICTET & CIE SA | $210.478.702 | 390.745 | 0,51% | Aktien |
| FMR LLC | $208.242.304 | 371.835 | 0,51% | Aktien |
| DEUTSCHE BANK AG\ | $207.945.653 | 371.305 | 0,51% | Aktien |
| UBS AM, a distinct business unit of UBS ASSET MANAGEMENT AMERICAS LLC | $203.833.639 | 378.163 | 0,50% | Aktien |
| Amundi | $201.105.884 | 359.092 | 0,49% | Aktien |
| TWO SIGMA ADVISERS, LP | $195.664.879 | 341.040 | 0,48% | Aktien |
| NORDEA INVESTMENT MANAGEMENT AB | $187.648.080 | 337.776 | 0,46% | Aktien |
| TWO SIGMA INVESTMENTS, LP | $184.989.053 | 330.314 | 0,45% | Aktien |
| SEI INVESTMENTS CO | $183.975.987 | 328.506 | 0,45% | Aktien |
| ROYAL BANK OF CANADA | $178.798.000 | 319.261 | 0,43% | Aktien |
| Qube Research & Technologies Ltd | $172.525.362 | 308.059 | 0,42% | Aktien |
| Temasek Holdings (Private) Ltd | $171.679.702 | 306.549 | 0,42% | Aktien |
| DIMENSIONAL FUND ADVISORS LP | $162.688.882 | 290.499 | 0,40% | Aktien |
| NOMURA ASSET MANAGEMENT INTERNATIONAL INC. | $161.556.000 | 288.472 | 0,39% | Aktien |
| STOREBRAND ASSET MANAGEMENT AS | $161.029.421 | 287.532 | 0,39% | Aktien |
Aktivisten & 5%+-Eigentümer 10 Beteiligungen
Investoren mit SEC Schedule 13D — wirtschaftliches Eigentum über 5% mit der Absicht, Einfluss auf den Emittenten zu nehmen (aktivistische Beteiligungen, Board-Kampagnen, M&A). Jede Zeile zeigt den zuletzt bekannten Stand der Position dieses Melders.
| Anmelder | Eingereicht | Beteiligung | Status | Zweck | Einreichung |
|---|---|---|---|---|---|
| Nicht offengelegter meldender Beteiligter, Nicht offengelegter meldender Beteiligter | 8. März 2016 | · | Erste Einreichung | · | SEC |
| Nicht offengelegter meldender Beteiligter, Nicht offengelegter meldender Beteiligter | 3. Dezember 2015 | · | Erste Einreichung | · | SEC |
| Nicht offengelegter meldender Beteiligter, Nicht offengelegter meldender Beteiligter | 10. November 2015 | · | Erste Einreichung | · | SEC |
| Nicht offengelegter meldender Beteiligter, Nicht offengelegter meldender Beteiligter | 2. Februar 2015 | · | Erste Einreichung | Vorstandskampagne | SEC |
| Nicht offengelegter meldender Beteiligter, Nicht offengelegter meldender Beteiligter, Nicht offengelegter meldender Beteiligter | 6. Januar 2015 | · | Erste Einreichung | · | SEC |
| Nicht offengelegter meldender Beteiligter, Nicht offengelegter meldender Beteiligter, Nicht offengelegter meldender Beteiligter | 5. Januar 2015 | · | Erste Einreichung | · | SEC |
| Nicht offengelegter meldender Beteiligter, Nicht offengelegter meldender Beteiligter, Nicht offengelegter meldender Beteiligter | 6. Mai 2014 | · | Erste Einreichung | Passive Anlage | SEC |
| Nicht offengelegter meldender Beteiligter, Nicht offengelegter meldender Beteiligter | 26. August 2013 | · | Erste Einreichung | Passive Anlage | SEC |
| Nicht offengelegter meldender Beteiligter, Nicht offengelegter meldender Beteiligter | 28. November 2012 | · | Erste Einreichung | Passive Anlage | SEC |
| MSCI Inc. ×2 Einreichungen | 29. April 2010 | · | Erste Einreichung | · | SEC |
Purpose is an automated classification of the filer's own stated purpose (SEC Item 4) — not investment advice. "—" means no clear purpose was stated or the text could not be classified.
Unternehmensinsider 49 Insider · 24 Führungskräfte · 22 Direktoren
| Insider | Rolle | Letzte Aktivität | Gehaltene Aktien | Käufe 12m | Verkäufe 12m | Netto 12m |
|---|---|---|---|---|---|---|
| Henry A Fernandez | Chairman and CEO | 15. Mai 2026 P | 1.731.961 | 30 | 0 | $12.511.562 |
| Andrew C. Wiechmann | Chief Financial Officer | 12. Oktober 2026 S | 21.644 | 0 | 4 | $-1.028.052 |
| Linda Huber | CFO and Treasurer | 6. Mai 2020 F | 5.415 | 0 | 0 | $0 |
| Kathleen A Winters | Chief Financial Officer | 13. Februar 2019 F | 78.557 | 0 | 0 | $0 |
| Robert Qutub | Chief Financial Officer | 8. Februar 2016 F | 60.009 | 0 | 0 | $0 |
| David M Obstler | Chief Financial Officer | 12. April 2012 M | 33.695 | 0 | 0 | $0 |
| Michael K Neborak | Chief Financial Officer | 8. Januar 2010 F | 193.406 | 0 | 0 | $0 |
| Cd Baer Pettit | President | 26. Januar 2026 A | 284.787 | 0 | 0 | $0 |
| Laurent Seyer | Chief Operating Officer | 16. Dezember 2019 F | 94.115 | 0 | 0 | $0 |
| David C Brierwood | Chief Operating Officer | 10. Februar 2014 F | 840.511 | 0 | 0 | $0 |
| Robert J. Gutowski | General Counsel | 22. Oktober 2026 S | 14.104 | 0 | 2 | $-1.833.388 |
| Alvise J. Munari | Chief Product Officer | 24. April 2026 S | 23.548 | 0 | 2 | $-5.920.351 |
| Scott A Crum | Chief Human Resources Officer | 2. Februar 2026 F | 16.904 | 0 | 0 | $0 |
| Craig Jack Read | Global Controller | 30. Januar 2026 A | 2.177 | 0 | 0 | $0 |
| Jennifer H Mak | Global Controller | 13. Februar 2023 S | 6.843 | 0 | 0 | $0 |
| Jigar Thakkar | Chief Technology Officer | 16. Juli 2018 A | 19.223 | 0 | 0 | $0 |
| Richard J Napolitano | Principal Accounting Officer | 7. Mai 2018 S | 6.963 | 0 | 0 | $0 |
| Remy Briand | Head of ESG | 10. Februar 2018 F | 48.112 | 0 | 0 | $0 |
| Diana H. Tidd | Head of Index | 10. Februar 2018 F | 23.370 | 0 | 0 | $0 |
| Peter J. Zangari | Global Head of Research | 10. Februar 2018 F | 70.788 | 0 | 0 | $0 |
| Jorge Mina | Head of Analytics | 10. Februar 2018 F | 9.921 | 0 | 0 | $0 |
| Roveen Bhansali | Managing Director | 6. Februar 2015 F | 46.215 | 0 | 0 | $0 |
| Christopher F Corrado | Chief Information Officer | 28. Januar 2015 F | 39.327 | 0 | 0 | $0 |
| Gary Retelny | Head of Governance Business | 30. April 2014 F | 77.110 | 0 | 0 | $0 |
| Rajat Taneja | Direktor | 2. September 2026 P | 5.404 | 1 | 0 | $1.000.160 |
| June Yang | Direktor | 28. August 2026 A | 906 | 0 | 0 | $0 |
| Robin Matlock | Direktor | 28. August 2026 A | 2.037 | 0 | 0 | $0 |
| Linda H Riefler | Direktor | 28. August 2026 A | 20.998 | 0 | 0 | $0 |
| Michelle Seitz | Direktor | 1. Mai 2026 A | 1.059 | 0 | 0 | $0 |
| Paula Volent | Direktor | 1. Mai 2026 A | 4.245 | 0 | 0 | $0 |
| Sandy C. Rattray | Direktor | 1. Mai 2026 A | 2.805 | 0 | 0 | $0 |
| Marcus L. Smith | Direktor | 1. Mai 2026 A | 5.444 | 0 | 0 | $0 |
| Jacques P Perold | Direktor | 1. Mai 2026 A | 6.272 | 0 | 0 | $0 |
| Robert G. Ashe | Direktor | 1. Mai 2026 A | 1.168 | 1 | 0 | $1.999.556 |
| Chirantan Jitendra Desai | Direktor | 1. Mai 2024 A | 496 | 0 | 0 | $0 |
| Wayne Edmunds | Direktor | 1. Mai 2024 A | 9.706 | 0 | 0 | $0 |
| Catherine R Kinney | Direktor | 29. Februar 2024 A | 19.314 | 0 | 0 | $0 |
| Benjamin F Dupont | Direktor | 26. Februar 2021 A | 17.681 | 0 | 0 | $0 |
| Alice Handy | Direktor | 6. März 2020 A | 35.569 | 0 | 0 | $0 |
| George W Siguler | Direktor | 1. Mai 2019 A | 30.254 | 0 | 0 | $0 |
| Wendy E Lane | Direktor | 1. Mai 2018 A | 6.882 | 0 | 0 | $0 |
| Scott Sipprelle | Direktor | 5. Mai 2011 A | 123.045 | 0 | 0 | $0 |
| David H Sidwell | Direktor | 9. April 2008 A | 11.909 | 0 | 0 | $0 |
| Kenneth Michael Deregt | Direktor | 14. November 2007 J | 33.888 | 0 | 0 | $0 |
| MORGAN STANLEY | 10%-Eigentümer | 22. Mai 2009 S | · | 0 | 0 | $0 |
| Capital Group Companies Charitable Foundation | 10%-Eigentümer | 28. April 2008 S | 0 | 0 | 0 | $0 |
| CAPITAL GROUP INTERNATIONAL INC | 10%-Eigentümer | 25. April 2008 C | 0 | 0 | 0 | $0 |
| Patrick Tierney | · | 1. Mai 2017 A | 14.637 | 0 | 0 | $0 |
| Rodolphe M Vallee | · | 1. Mai 2017 A | 26.556 | 0 | 0 | $0 |
Insider aus SEC-Einreichungen Form 3/4/5; Netto = nur P/S aus offenen Märkten
ETF-Besitz Gehalten von 125 ETFs
Gewichtung spiegelt nur direkte Aktienbestände (N-PORT) wider; gehebelte oder derivatbasierte Fonds können zusätzliche Swap-Exposure halten, die hier nicht angezeigt wird.
| Fonds | Gewicht | Anteile | Stand | Quelle |
|---|---|---|---|---|
| KMID · Virtus ETF Trust II | 3,47% | 2.768 NS | 31. Juli 2026 | N-PORT |
| POWA · Invesco Exchange-Traded Self-Indexe… | 2,18% | 5.953 SH | 23. Oktober 2026 | Täglich |
| CZA · Invesco Exchange-Traded Fund Trust | 2,13% | 6.186 SH | 23. Oktober 2026 | Täglich |
| RSPF · Invesco Exchange-Traded Fund Trust | 1,47% | 7.754 SH | 23. Oktober 2026 | Täglich |
| PKW · Invesco Exchange-Traded Fund Trust | 1,34% | 37.906 SH | 23. Oktober 2026 | Täglich |
| MMLG · First Trust Exchange-Traded Fund VI… | 1,01% | 1.653 NS | 31. August 2026 | N-PORT |
| VOT · VANGUARD INDEX FUNDS | 0,85% | 532.150 SH | 19. August 2026 | Täglich |
| VMAX · Lattice Strategies Trust | 0,74% | 639 NS | 31. Juli 2026 | N-PORT |
| FQAL · FIDELITY COVINGTON TRUST | 0,60% | 14.692 NS | 31. Juli 2026 | N-PORT |
| IYF · iShares Trust | 0,59% | 46.889 SH | 11. September 2026 | Täglich |
| ESLV · Strategy Shares | 0,59% | 146 NS | 31. Juli 2026 | N-PORT |
| ESUM · Strategy Shares | 0,58% | 1.855 NS | 31. Juli 2026 | N-PORT |
| LCOW · Pacer Funds Trust | 0,57% | 257 NS | 31. Juli 2026 | N-PORT |
| IYG · iShares Trust | 0,55% | 22.106 SH | 11. September 2026 | Täglich |
| IMCG · iShares Trust | 0,54% | 39.327 SH | 11. September 2026 | Täglich |
| VFH · VANGUARD WORLD FUND | 0,47% | 116.122 SH | 19. August 2026 | Täglich |
| FNCL · FIDELITY COVINGTON TRUST | 0,45% | 18.744 NS | 31. Juli 2026 | N-PORT |
| HDUS · Lattice Strategies Trust | 0,45% | 1.595 NS | 31. Juli 2026 | N-PORT |
| REVS · Columbia ETF Trust I | 0,41% | 2.402 NS | 31. Juli 2026 | N-PORT |
| VO · VANGUARD INDEX FUNDS | 0,38% | 1.505.355 SH | 19. August 2026 | Täglich |
| IWS · iShares Trust | 0,36% | 99.709 SH | 11. September 2026 | Täglich |
| FAS · Direxion Shares ETF Trust | 0,35% | 14.344 NS | 31. Juli 2026 | N-PORT |
| FTLS · First Trust Exchange-Traded Fund III | 0,33% | 14.335 NS | 31. Juli 2026 | N-PORT |
| HQGO · Lattice Strategies Trust | 0,30% | 258 NS | 31. Juli 2026 | N-PORT |
| OMFL · Invesco Exchange-Traded Self-Indexe… | 0,30% | 22.891 SH | 23. Oktober 2026 | Täglich |
| IWR · iShares Trust | 0,28% | 288.308 SH | 11. September 2026 | Täglich |
| IMCB · iShares Trust | 0,27% | 8.320 SH | 11. September 2026 | Täglich |
| FEUS · FlexShares Trust | 0,25% | 495 NS | 31. Juli 2026 | N-PORT |
| IXG · iShares Trust | 0,25% | 3.141 SH | 11. September 2026 | Täglich |
| GLOF · iShares Trust | 0,24% | 895 SH | 11. September 2026 | Täglich |
| ROUS · Lattice Strategies Trust | 0,24% | 2.976 NS | 31. Juli 2026 | N-PORT |
| XOEF · iShares Trust | 0,22% | 91 SH | 11. September 2026 | Täglich |
| RECS · Columbia ETF Trust I | 0,22% | 22.369 NS | 31. Juli 2026 | N-PORT |
| RSP · Invesco Exchange-Traded Fund Trust | 0,22% | 353.964 SH | 23. Oktober 2026 | Täglich |
| EUSA · iShares, Inc. | 0,20% | 6.906 SH | 11. September 2026 | Täglich |
| FTC · First Trust Exchange-Traded AlphaDE… | 0,19% | 4.470 NS | 31. Juli 2026 | N-PORT |
| VIG · VANGUARD SPECIALIZED FUNDS | 0,18% | 411.287 SH | 19. August 2026 | Täglich |
| SIZE · iShares Trust | 0,18% | 1.396 SH | 11. September 2026 | Täglich |
| SNPG · DBX ETF Trust | 0,17% | 43 NS | 31. August 2026 | N-PORT |
| HAPI · Harbor ETF Trust | 0,16% | 1.407 NS | 31. Juli 2026 | N-PORT |
| VYM · VANGUARD WHITEHALL FUNDS | 0,16% | 280.853 SH | 19. August 2026 | Täglich |
| PFM · Invesco Exchange-Traded Fund Trust | 0,16% | 2.068 SH | 23. Oktober 2026 | Täglich |
| QARP · DBX ETF Trust | 0,15% | 209 NS | 31. August 2026 | N-PORT |
| LRGF · iShares Trust | 0,14% | 9.535 SH | 11. September 2026 | Täglich |
| DEUS · DBX ETF Trust | 0,14% | 742 NS | 31. August 2026 | N-PORT |
| VEGN · ETF Series Solutions | 0,13% | 415 NS | 31. Juli 2026 | N-PORT |
| ILCG · iShares Trust | 0,12% | 6.906 SH | 11. September 2026 | Täglich |
| IQSU · New York Life Investments ETF Trust | 0,12% | 689 NS | 31. Juli 2026 | N-PORT |
| VUG · VANGUARD INDEX FUNDS | 0,12% | 833.177 SH | 19. August 2026 | Täglich |
| ESG · FlexShares Trust | 0,12% | 270 NS | 31. Juli 2026 | N-PORT |
| ESSC · Strategy Shares | 0,12% | 73 NS | 31. Juli 2026 | N-PORT |
| DFSU · Dimensional ETF Trust | 0,12% | 4.592 NS | 31. Juli 2026 | N-PORT |
| DGRO · iShares Trust | 0,11% | 90.164 SH | 11. September 2026 | Täglich |
| LGDX · Tidal Trust III | 0,11% | 263 NS | 31. Juli 2026 | N-PORT |
| GLBL · Pacer Funds Trust | 0,10% | 2 NS | 31. Juli 2026 | N-PORT |
| SNPE · DBX ETF Trust | 0,10% | 5.245 NS | 31. August 2026 | N-PORT |
| VONV · VANGUARD SCOTTSDALE FUNDS | 0,10% | 40.258 SH | 19. August 2026 | Täglich |
| IWD · iShares Trust | 0,10% | 148.371 SH | 11. September 2026 | Täglich |
| FAD · First Trust Exchange-Traded AlphaDE… | 0,10% | 969 NS | 31. Juli 2026 | N-PORT |
| MPLY · Strategy Shares | 0,09% | 26 NS | 31. Juli 2026 | N-PORT |
| PFIG · Invesco Exchange-Traded Fund Trust … | 0,09% | 140.000 | 23. Oktober 2026 | Täglich |
| CATH · Global X Funds | 0,07% | 1.673 NS | 31. Juli 2026 | N-PORT |
| EQAL · Invesco Exchange-Traded Fund Trust … | 0,07% | 959 SH | 23. Oktober 2026 | Täglich |
| XYLG · Global X Funds | 0,07% | 81 NS | 31. Juli 2026 | N-PORT |
| TOPC · iShares Trust | 0,07% | 43 SH | 11. September 2026 | Täglich |
| VOOV · VANGUARD ADMIRAL FUNDS | 0,07% | 8.018 SH | 19. August 2026 | Täglich |
| ESGV · VANGUARD WORLD FUND | 0,07% | 15.906 SH | 19. August 2026 | Täglich |
| PBP · Invesco Exchange-Traded Fund Trust | 0,07% | 436 SH | 23. Oktober 2026 | Täglich |
| DFAU · Dimensional ETF Trust | 0,07% | 14.920 NS | 31. Juli 2026 | N-PORT |
| XVV · iShares Trust | 0,07% | 835 SH | 11. September 2026 | Täglich |
| PBUS · Invesco Exchange-Traded Fund Trust … | 0,07% | 11.401 SH | 23. Oktober 2026 | Täglich |
| PTLC · Pacer Funds Trust | 0,07% | 3.717 NS | 31. Juli 2026 | N-PORT |
| XYLD · Global X Funds | 0,07% | 3.687 NS | 31. Juli 2026 | N-PORT |
| CHRI · Global X Funds | 0,06% | 9 NS | 31. Juli 2026 | N-PORT |
| IVE · iShares Trust | 0,06% | 57.996 SH | 11. September 2026 | Täglich |
| XCLR · Global X Funds | 0,06% | 4 NS | 31. Juli 2026 | N-PORT |
| XRMI · Global X Funds | 0,06% | 55 NS | 31. Juli 2026 | N-PORT |
| BBUS · J.P. Morgan Exchange-Traded Fund Tr… | 0,06% | 9.777 NS | 31. Juli 2026 | N-PORT |
| VOTE · TCW ETF Trust | 0,06% | 1.202 NS | 31. Juli 2026 | N-PORT |
| BKLC · BNY Mellon ETF Trust | 0,06% | 5.975 NS | 31. Juli 2026 | N-PORT |
| IUSV · iShares Trust | 0,06% | 30.686 SH | 11. September 2026 | Täglich |
| IVV · iShares Trust | 0,06% | 917.806 SH | 11. September 2026 | Täglich |
| VOO · VANGUARD INDEX FUNDS | 0,06% | 1.891.438 SH | 19. August 2026 | Täglich |
| VV · VANGUARD INDEX FUNDS | 0,06% | 81.129 SH | 19. August 2026 | Täglich |
| VOOG · VANGUARD ADMIRAL FUNDS | 0,06% | 28.158 SH | 19. August 2026 | Täglich |
| VONE · VANGUARD SCOTTSDALE FUNDS | 0,06% | 11.676 SH | 19. August 2026 | Täglich |
| TOV · EA Series Trust | 0,06% | 267 NS | 31. Juli 2026 | N-PORT |
| DFUS · Dimensional ETF Trust | 0,06% | 21.823 NS | 31. Juli 2026 | N-PORT |
| SPUU · Direxion Shares ETF Trust | 0,06% | 275 NS | 31. Juli 2026 | N-PORT |
| XTR · Global X Funds | 0,06% | 5 NS | 31. Juli 2026 | N-PORT |
| VOXP · Advisors Series Trust | 0,06% | 6 NS | 31. Juli 2026 | N-PORT |
| IWP · iShares Trust | 0,06% | 20.692 SH | 11. September 2026 | Täglich |
| QDPL · Pacer Funds Trust | 0,06% | 1.741 NS | 31. Juli 2026 | N-PORT |
| ILCB · iShares Trust | 0,06% | 1.374 SH | 11. September 2026 | Täglich |
| IVW · iShares Trust | 0,06% | 80.696 SH | 11. September 2026 | Täglich |
| IUS · Invesco Exchange-Traded Self-Indexe… | 0,06% | 942 SH | 23. Oktober 2026 | Täglich |
| IYY · iShares Trust | 0,06% | 3.141 SH | 11. September 2026 | Täglich |
| PHDG · Invesco Actively Managed Exchange-T… | 0,06% | 57 SH | 23. Oktober 2026 | Täglich |
| DCOR · Dimensional ETF Trust | 0,06% | 3.328 NS | 31. Juli 2026 | N-PORT |
| IUSG · iShares Trust | 0,06% | 33.370 SH | 11. September 2026 | Täglich |
| IWB · iShares Trust | 0,05% | 48.547 SH | 11. September 2026 | Täglich |
| ITOT · iShares Trust | 0,05% | 94.977 SH | 11. September 2026 | Täglich |
| IWV · iShares Trust | 0,05% | 19.314 SH | 11. September 2026 | Täglich |
| HCMT · Direxion Shares ETF Trust | 0,05% | 507 NS | 31. Juli 2026 | N-PORT |
| VTI · VANGUARD INDEX FUNDS | 0,05% | 2.205.575 SH | 19. August 2026 | Täglich |
| VTHR · VANGUARD SCOTTSDALE FUNDS | 0,05% | 5.924 SH | 19. August 2026 | Täglich |
| SPXL · Direxion Shares ETF Trust | 0,05% | 5.690 NS | 31. Juli 2026 | N-PORT |
| KOKU · DBX ETF Trust | 0,05% | 671 NS | 31. August 2026 | N-PORT |
| TOK · iShares Trust | 0,05% | 198 SH | 11. September 2026 | Täglich |
| DFAC · Dimensional ETF Trust | 0,05% | 37.993 NS | 31. Juli 2026 | N-PORT |
| URTH · iShares, Inc. | 0,04% | 6.680 SH | 11. September 2026 | Täglich |
| ACVF · ETF Opportunities Trust | 0,04% | 116 NS | 31. Juli 2026 | N-PORT |
| TILT · FlexShares Trust | 0,04% | 1.580 NS | 31. Juli 2026 | N-PORT |
| ACWI · iShares Trust | 0,04% | 23.664 SH | 11. September 2026 | Täglich |
| APUE · Trust for Professional Managers | 0,03% | 1.507 NS | 31. August 2026 | N-PORT |
| SPXD · DBX ETF Trust | 0,03% | 4 NS | 31. August 2026 | N-PORT |
| VT · VANGUARD INTERNATIONAL EQUITY INDEX… | 0,03% | 59.397 SH | 19. August 2026 | Täglich |
| PRF · Invesco Exchange-Traded Fund Trust | 0,03% | 4.482 SH | 23. Oktober 2026 | Täglich |
| RWL · Invesco Exchange-Traded Fund Trust … | 0,02% | 3.039 SH | 23. Oktober 2026 | Täglich |
| DXUV · Dimensional ETF Trust | 0,01% | 97 NS | 31. Juli 2026 | N-PORT |
| VONG · VANGUARD SCOTTSDALE FUNDS | 0,01% | 6.005 SH | 19. August 2026 | Täglich |
| IWF · iShares Trust | 0,01% | 13.351 SH | 11. September 2026 | Täglich |
| NPFE · Elevation Series Trust | 0,00% | 5 NS | 31. Juli 2026 | N-PORT |
| GTO · Invesco Actively Managed Exchange-T… | 0,00% | 6.000 | 20. Oktober 2026 | Täglich |
| IAI · iShares Trust | · | 89.770 SH | 11. September 2026 | Täglich |
MSCI Analysten-Konsens Bullische und bärische Analystenmeinungen, 12-Monats-Kursziel, Aufwärtspotenzial
12-Monats-Kursziel
17 Analysten · 2026-10-25Mittelwert-Ziel $681.47 +12,6%
Peer-Vergleich (GICS-Subbranche) Wichtige Kennzahlen im Vergleich zu Branchenkollegen
FY-Basis, Kurse zum Schlusskurs am Ende des letzten Geschäftsjahres jedes Unternehmens.
| Ticker | Marktkapitalisierung | P/E | Umsatz Vj. | Nettomarge | ROE | Bruttogewinnmarge |
|---|---|---|---|---|---|---|
| MSCI | $42.21B | 36.6 | 9.8% | 38.4% | -67.9% | · |
| CME | · | 24.5 | 6.4% | 62.5% | 14.8% | · |
| ICE | $91.83B | 28.1 | 7.5% | 26.2% | 11.7% | · |
| MCO | · | 37.4 | 8.9% | 31.9% | 64.5% | · |
| NDAQ | $55.35B | 31.4 | 11.7% | 21.6% | 15.3% | 63.5% |
| COIN | $60.57B | 50.8 | 9.4% | 17.5% | 9.4% | · |
| CBOE | · | · | 15.1% | 23.3% | 22.4% | 51.5% |
| TW | $25.32B | 28.4 | 18.9% | 39.6% | 13.2% | · |
| FDS | $11.05B | 21.5 | 6.7% | 21.5% | 25.8% | · |
| MORN | $8.64B | 24.5 | 7.5% | 15.3% | 26.4% | · |
Neueste Nachrichten Aktuelle Schlagzeilen über dieses Unternehmen
Meine Kennzahlen Ihre persönliche Watchlist — ausgewählte Zeilen aus den vollständigen Fundamentaldaten
Wählen Sie die Kennzahlen, die für Sie wichtig sind — klicken Sie auf das + neben jeder Zeile in den vollständigen Fundamentaldaten oben.
Ihre Auswahl wird gespeichert und begleitet Sie über alle Ticker hinweg.