
LMT Lockheed Martin Corporation Common Stock
About Lockheed Martin Corporation Common Stock Company overview from Wikipedia
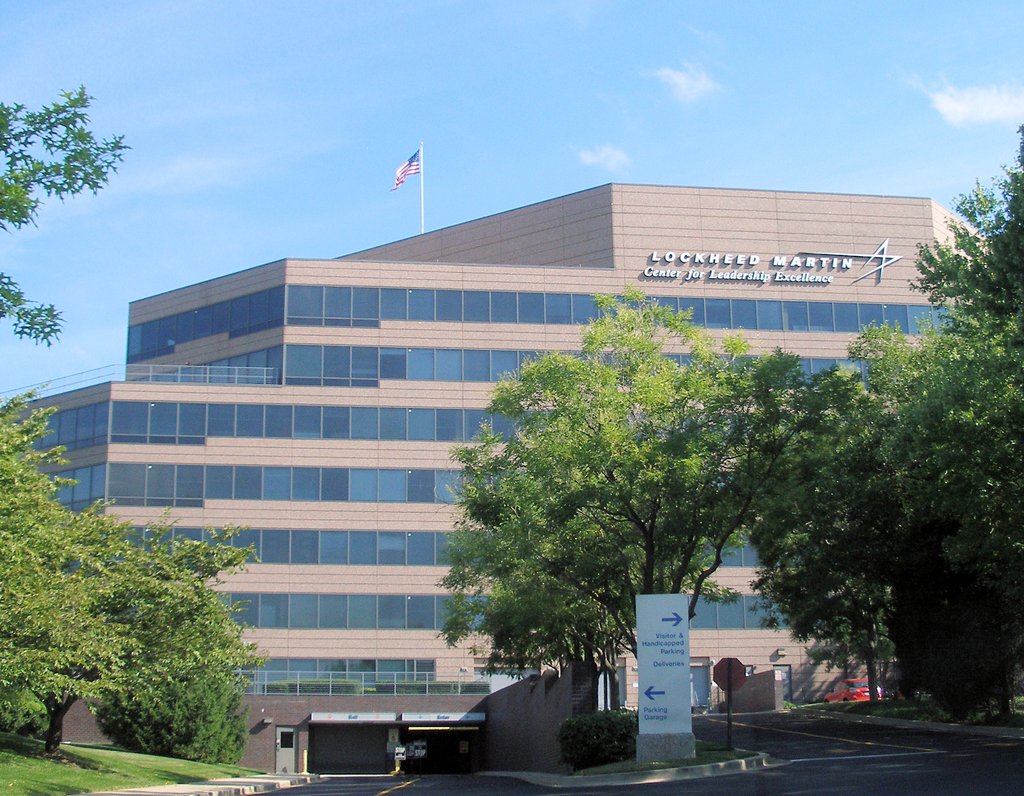
The Lockheed Martin Corporation is an American defense and aerospace manufacturer. It is headquartered in North Bethesda, Maryland, United States. The company was formed by the merger of the Lockheed Corporation with Martin Marietta on March 15, 1995.
Read more
The Lockheed Martin Corporation is an American defense and aerospace manufacturer. It is headquartered in North Bethesda, Maryland, United States. The company was formed by the merger of the Lockheed Corporation with Martin Marietta on March 15, 1995.
Lockheed Martin operates 4 divisions: Lockheed Martin Aeronautics (39% of 2024 revenues); Lockheed Martin Missiles and Fire Control (18% of 2024 revenues); Lockheed Martin Rotary and Mission Systems (24% of 2024 revenues); and Lockheed Martin Space (18% of 2024 revenues).
As of 2023, it is the top contractor of the United States federal government, and has been since at least 2008. As of 2024, 73% of the company's revenue came from the federal government, including 65% from the United States Department of Defense. In 2024, 26% of revenue was from sales of the F-35 fighter.
Lockheed Martin is also a contractor for the U.S. Department of Energy and the National Aeronautics and Space Administration (NASA). It also provides products and services to the Department of Defense and the Department of Energy to the Department of Agriculture and the Environmental Protection Agency. It is involved in surveillance and information processing for the CIA, the FBI, the Internal Revenue Service (IRS), the National Security Agency (NSA), the Pentagon, the Census Bureau, and the Postal Service.
The company has received the Collier Trophy six times, including in 2001 for being part of developing the X-35/F-35B LiftFan Propulsion System and in 2018 for the Automatic Ground Collision Avoidance System (Auto-GCAS). Lockheed Martin currently produces the F-35 and leads the international supply chain, leads the team for the development and implementation of technology solutions for the new USAF Space Fence (AFSSS replacement), and is the primary contractor for the development of the Orion command module. The company also invests in healthcare systems, renewable energy systems, intelligent energy distribution, and compact nuclear fusion.
History
1990s
Merger talks between Lockheed Corporation and Martin Marietta began in March 1994, with the companies announcing their $10 billion planned merger on August 30, 1994. The headquarters for the combined companies would be at Martin Marietta headquarters in North Bethesda, Maryland. The deal was finalized on March 15, 1995, when the two companies' shareholders approved the merger. The segments of the two companies not retained by the new company formed the basis for L-3 Communications, a mid-size defense contractor in its own right. Lockheed Martin also later spun off the materials company Martin Marietta Materials.
The company's executives received large bonuses directly from the government as a result of the merger. Norman R. Augustine, who was at the time CEO of Martin Marietta, received an $8.2 million bonus.
Both companies contributed important products to the new portfolio. Lockheed products included the Trident missile, P-3 Orion maritime patrol aircraft, U-2 and SR-71 Blackbird reconnaissance airplanes, F-117 Nighthawk, F-16 Fighting Falcon, F-22 Raptor, C-130 Hercules, A-4AR Fightinghawk and the DSCS-3 satellite. Martin Marietta products included Titan rockets, Sandia National Laboratories (management contract acquired in 1993), Space Shuttle External Tank, Viking 1 and Viking 2 landers, the Transfer Orbit Stage (under subcontract to Orbital Sciences Corporation) and various satellite models.
On April 22, 1996, Lockheed Martin completed the acquisition of Loral Corporation's defense electronics and system integration businesses for $9.1 billion, the deal having been announced in January. The remainder of Loral became Loral Space & Communications. Lockheed Martin abandoned plans for an $8.3 billion merger with Northrop Grumman on July 16, 1998, due to government concerns over the potential strength of the new group; Lockheed/Northrop would have had control of 25% of the Department of Defense's procurement budget.
For the Mars Climate Orbiter, Lockheed Martin incorrectly provided NASA with software using measurements in US Customary force units when metric units were expected; this resulted in the loss of the Orbiter at a cost of $125 million. The development of the spacecraft cost $193 million.
In addition to their military products, in the 1990s Lockheed Martin developed the texture mapping chip for the Sega Model 2 arcade system board and the entire graphics system for the Sega Model 3, which were used to power some of the most popular arcade games of the time.
2000s
In May 2001, Lockheed Martin sold Lockheed Martin Control Systems to BAE Systems. On November 27, 2000, Lockheed completed the sale of its Aerospace Electronic Systems business to BAE Systems for $1.67 billion, a deal announced in July 2000. This group encompassed Sanders Associates, Fairchild Systems, and Lockheed Martin Space Electronics & Communications. In 2001, Lockheed Martin won the contract to build the F-35 Lightning II; this was the largest fighter aircraft procurement project since the F-16, with an initial order of 3,000 aircraft. In 2001, Lockheed Martin settled a nine–year investigation conducted by NASA's Office of Inspector General with the assistance of the Defense Contract Audit Agency. The company paid the United States government $7.1 million based on allegations that its predecessor, Lockheed Engineering Science Corporation, submitted false lease costs claims to NASA.
On July 8, 2003, a Lockheed Martin plant in Meridian, Mississippi became the scene of a racially motivated mass shooting when an assembly line worker murdered six co-workers (five of whom were black) and wounded eight before killing himself. In the immediate aftermath of the shooting, Lockheed Martin's President refused to disclose whether company officials were previously aware of any red flags regarding the worker. The company had launched its own investigation into the worker's behavior prior to the massacre following complaints from numerous black employees regarding incidents involving the worker. He had been ordered to attend anger management courses and diversity training but refused.
On May 12, 2006, The Washington Post reported that when Robert Stevens took control of Lockheed Martin in 2004, he faced the dilemma that within 10 years, 100,000 of the about 130,000 Lockheed Martin employees – more than three-quarters – would be retiring. On August 31, 2006, Lockheed Martin won a $3.9 billion contract from NASA to design and build the CEV capsule, later named Orion for the Ares I rocket in the Constellation Program. In 2009, NASA reduced the capsule crew requirements from the initial six seats to four for transport to the International Space Station.
In August 2007, Lockheed Martin acquired 3Dsolve, a Cary, North Carolina, company that created simulations and training modules for the military and corporate clients. Renamed Lockheed Martin 3D Learning Systems, the company remained in Cary with 3D's founder Richard Boyd as director. The name was eventually shortened to Lockheed Martin 3D Solutions.
On August 13, 2008, Lockheed Martin acquired the government business unit of Nantero, Inc., a company that had developed methods and processes for incorporating carbon nanotubes in next-generation electronic devices. In 2009, Lockheed Martin bought Unitech.
2010s
On November 18, 2010, Lockheed Martin announced that it would be closing its Eagan, Minnesota, location by 2013 to reduce costs and optimize capacity at its locations nationwide. In January 2011, Lockheed Martin agreed to pay the U.S. Government $2 million to settle allegations that the company submitted false claims on a U.S. government contract for that amount. The allegations came from a contract with the Naval Oceanographic Office Major Shared Resource Center in Mississippi.
On May 25, 2011, Lockheed Martin bought the first Quantum Computing System from D-Wave Systems. Lockheed Martin and D-Wave will collaborate to realize the benefits of a computing platform based upon a quantum annealing processor, as applied to some of Lockheed Martin's most challenging computation problems. Lockheed Martin established a multi-year contract that includes one system, maintenance, and services.
On May 28, 2011, it was reported that a cyberattack using previously stolen EMC files had broken through to sensitive materials at the contractor. It is unclear if the Lockheed incident is the specific prompt whereby on June 1, 2011, the new United States military strategy, makes explicit that a cyberattack is casus belli for a traditional act of war.
On March 3, 2012, the U.S. Department of Justice (DOJ) said that Lockheed Martin had agreed to settle allegations that the defense contractor had sold overpriced perishable tools used on many contracts. The DOJ said the allegations were based specifically on the subsidiary Tools & Metals Inc's inflation of costs between 1998 and 2005, which Lockheed Martin then passed on to the U.S. government under its contracts. Further, in March 2006, Todd B. Loftis, a former TMI president, was sentenced to 87 months in prison and ordered to pay a fine of $20 million following his guilty plea.
On July 10, 2012, Lockheed Martin announced it was cutting its workforce by 740 workers to reduce costs and remain competitive as necessary for future growth. On November 27, 2012, Lockheed Martin announced that Marillyn Hewson would become the corporation's chief executive officer on January 1, 2013.
On January 7, 2013, Lockheed Martin Canada announced that it would be acquiring the engine maintenance, repair, and overhaul assets from Aveos Fleet Performance in Montreal, Quebec, Canada. On February 20, 2013, Lockheed Martin Corp complied with the United States District Court for the Southern District of New York, agreeing to pay a $19.5 million lawsuit to conclude a securities fraud class-action legal battle that had accused the company of deceiving shareholders in regards to expectations for the company's information technology division. On July 3, 2013, Lockheed Martin announced that it was partnering with DreamHammer to use the company's software for integrated command and control of its unmanned aerial vehicles. Lockheed Martin teamed up with Bell Helicopter to propose the V-280 Valor tiltrotor for the Future Vertical Lift (FVL) program. In September 2013, Lockheed Martin acquired the Scotland-based tech firm, Amor Group, saying the deal would aid its plans to expand internationally and into non-defense markets. On November 14, 2013, Lockheed announced they would be closing their Akron, Ohio facility laying off 500 employees and transferring other employees to other locations.
In October 2013, Lockheed announced it expected to finalize a $2.2 billion contract with the United States Air Force for two advanced military communications satellites.
In March 2014, Lockheed Martin acquired Beontra AG, a provider of integrated planning and demand forecasting tools for airport, planning to expand their business in commercial airport information technology solutions. Also, in March 2014, Lockheed Martin announced its acquisition of Industrial Defender Inc. On June 2, 2014, Lockheed Martin received a Pentagon contract to build a space fence that would track debris, keeping it from damaging satellites and spacecraft.
On December 20, 2014, Lockheed Martin Integrated Systems agreed to settle a False Claims Act lawsuit paying $27.5 million to finalize allegations that it had knowingly overbilled taxpayers for work performed by company staff who did not hold the relevant essential qualifications for the contract.
On July 20, 2015, Lockheed Martin announced plans to purchase Sikorsky Aircraft from United Technologies Corporation at a cost of $7.1 billion. The Pentagon has criticized the acquisition as causing a reduction in competition. In November 2015, the acquisition received final approval from the Chinese government, with a total cost of $9 billion. Dan Schulz was named the president of Lockheed Martin's Sikorsky company. Lockheed Martin has shown sketches for a twin-engine, blended wing body strategic airlifter similar in size to the C-5. On March 31, 2015, the US Navy awarded Lockheed Martin a contract worth $362 million for the construction of Freedom-class ship LCS 21 and $79 million for advance procurement for LCS 23. The Freedom-class ships are built by Fincantieri Marinette Marine in Marinette, Wisconsin. In December 2015, Lockheed won an $867 million seven-year contract to train Australia's next generation of military pilots. The deal also has the option to extend this contract across 26 years, which would greatly increase the deal's value.
In August 2016, Canadian Forces Maritime tested an integrated submarine combat system developed by Lockheed Martin. The test marked Canada's first use of the combat system with the MK 48 heavyweight torpedo, variant 7AT. The same month, a deal to merge Leidos with the entirety of Lockheed Martin's Information Systems & Global Solutions (IS&GS) business came to a close.
In May 2017, during a visit to Saudi Arabia by President Donald Trump, Saudi Arabia signed business deals worth tens of billions of dollars with U.S. companies, including Lockheed Martin. (See: 2017 United States–Saudi Arabia arms deal)
On August 13, 2018, Lockheed Martin announced that the company had secured a $480 million contract from the United States Air Force to develop a hypersonic weapon prototype. A hypersonic missile can travel at one mile a second. This is the second contract for hypersonic weapons that Martin has secured; The first was from the Air Force as well and for $928 million which was announced in April 2018.
On November 29, 2018, Lockheed Martin was awarded a Commercial Lunar Payload Services contract by NASA, which makes it eligible to bid on delivering science and technology payloads to the Moon for NASA, worth $2.6 billion. Lockheed Martin plans to formally propose a lander called McCandless Lunar Lander, named after the late astronaut and former Lockheed Martin employee Bruce McCandless II, who in 1984 performed the first free-flying spacewalk without a lifeline to the orbiting shuttle, using a jetpack built by the company. This lander would be based on the successful design of the Phoenix and InSight Mars landers.
On April 11, 2019, at 6:35 pm EDT, an Arabsat-6A satellite was successfully launched from (LC-39A). This satellite is one of two, the other being SaudiGeoSat-1/HellasSat-4 and they are the "most advanced commercial communications satellites ever built by" Lockheed Martin.
On September 23, 2019, Lockheed Martin and NASA signed a $4.6-billion contract to build six or more Orion capsules for NASA's Artemis program to send astronauts to the Moon.
2020s
In January 2020, the Naval Sea Systems Command awarded Lockheed Martin with a $138 million contract related with the AEGIS Combat System Engineering Agent (CSEA). The LMT Rotary and Mission Systems (RMS) unit of the company is to develop, integrate, test, and deliver the AEGIS Advanced Capability Build (ACB) 20 integrated combat system. Martin will work on the AEGIS in New Jersey. The project is expected to be completed by December 2020. In January 2020, the Pentagon found at least 800 software defects in Lockheed Martin's F-35 fighter jets owned by the US Armed Forces during an annual review. The 2018 and 2019 reviews revealed a large number of defects as well. In February 2020, Lockheed Martin acquired Vector Launch Inc's satellite software technology GalacticSky for $4.25 million after a bankruptcy court received no bids by the February 21 deadline. On March 16, 2020, Lockheed Martin announced that James D. Taiclet would replace Marillyn Hewson as CEO, effective June 15. In January 2021, Taiclet became chairman of the company as well.
Lockheed Martin was sanctioned by the Chinese government in July 2020, October 2020, and February 2023 due to arm sales to Taiwan. On December 20, 2020, it was announced that Lockheed Martin would acquire Aerojet Rocketdyne Holdings for $4.4 billion. The acquisition was expected to close in first quarter of 2022. On February 13, 2022, Lockheed abandoned the deal following regulatory disapproval.
In 2022, due to the Russo-Ukrainian war, major arms manufacturers, including Lockheed Martin, reported a sharp increase in interim sales and profits. In May 2023, Lockheed formed a new microelectronics subsidiary ForwardEdge ASIC to design custom application-specific integrated circuits for its customers.
In November 2023, attempts at direct action were taken against arms companies in the US and the UK, including Lockheed Martin, that supplied weapons to Israel during the Gaza war. In 2025, Lockheed Martin was included in a UN report on corporations complicit in the Gaza genocide.
In March 2024, Lockheed Martin submitted a bid to acquire Terran Orbital. On June 28, 2024, the U.S. Army awarded Lockheed Martin a $4.5 billion contract to supply Patriot Advanced Capability-3 (PAC-3) missiles. The contract included 870 PAC-3 MSE missiles and related hardware. Lockheed was tasked with manufacturing the newest version of these interceptors, with each PAC-3 MSE missile costing approximately $4 million, as per Army budget documents.
On October 9, 2024, Lockheed Martin announced the appointment of Chauncey McIntosh as vice president and general manager of the F-35 Lightning II Program, effective December 1, 2024. He succeeded Bridget Lauderdale, who retired after 38 years with the company. In December 2024, Lockheed Martin announced that it had formed a subsidiary, Astris AI, that would help U.S. defense companies to incorporate artificial intelligence into their operations.
In May 2026, the company expanded its missile production capacity further with the construction of a new 87,000-square-foot munitions facility in Alabama intended for the production of Terminal High Altitude Area Defense (THAAD) interceptors. The facility is part of a broader investment plan of approximately $8–9 billion through 2030 aimed at increasing overall missile output.
Finances
For the fiscal year 2020, Lockheed Martin reported earnings of $6.833 billion, with an annual revenue of $65.398 billion, an increase of 9.3% over the previous year. Backlog was 144.0 billion at the end of 2019, up from 130.5 billion at the end of the 2018. Firm orders were $94.5 billion at the end of 2019. Its shares traded at over $389 per share. Its market capitalization was valued at US$109.83 billion at the end of 2019. Lockheed Martin ranked No. 60 in the 2019 Fortune 500 list of the largest United States corporations by total revenue (down from No. 59 in 2018).
Q2 2025 loss in classified program
Lockheed profits sharply dropped 80% in Q2 2025, owing to a highly classified U.S. government aerospace program CEO James Taiclet described as "magical". The loss from development of the described "game changing" classified aerospace program totaled $1.6 billion. Taiclet stated investors would be unable to know details of the "magical" classified aerospace program for many years to come. During the same earnings call, Lockheed acknowledged the existence of a classified Lockheed Martin Missiles and Fire Control (MFC) program, described as game-changing.
Organization
Primary business areas
Lockheed Martin Aeronautics
Skunk Works
F-35 Lightning II
Lockheed C-130 Hercules
F-16 Fighting Falcon
F-22 Raptor
Lockheed Martin Missiles and Fire Control
MIM-104 Patriot surface-to-air missile
Terminal High Altitude Area Defense
M270 Multiple Launch Rocket System
Precision Strike Missile
AGM-158 JASSM air-launched cruise missile
AGM-158C LRASM anti-ship missile
AGM-114 Hellfire
Apache fire-control system
Sniper Advanced Targeting Pod
Infrared search and track
Special forces support services
Lockheed Martin Rotary and Mission Systems
Sikorsky Aircraft
Sikorsky UH-60 Black Hawk
Sikorsky HH-60 Pave Hawk
Sikorsky VH-92 Patriot
Sikorsky CH-53K King Stallion
Sikorsky SH-60 Seahawk
Aegis Combat System
Littoral combat ships
Freedom-class littoral combat ships
River-class destroyers
C2BMC missile defense program
Lockheed Martin Space
UGM-133 Trident II ballistic missile
Orion spacecraft
Next-Generation Overhead Persistent Infrared
GPS Block III
hypersonic weapons
Ground-Based Interceptor
Other business areas
International operations
Lockheed Martin UK
Lockheed Martin Canada
Lockheed Martin Australia
Enterprise operations
Corporate Headquarters Operations
Internal Corporate Functions: Ethics, Finance, HR, Legal, etc.
Lockheed Martin Advanced Technology Laboratories
Wholly owned corporate subsidiaries
ForwardEdge ASIC
Lockheed Martin Finance Corporation
LMC Properties
Joint ventures
International Launch Services (with Khrunichev, RSC Energia)
Lockheed Martin Alenia Tactical Transport Systems (with Alenia Aeronautica), now folded
MEADS International (with EADS and MBDA)
Space Imaging (46%, remainder public)
United Launch Alliance (with Boeing)
Javelin Joint Venture (with Raytheon)
Longbow LLC (with Northrop Grumman)
United Space Alliance (with Boeing)
Kelly Aviation Center (with GE and Rolls-Royce)
Protector USV – an unmanned surface vehicle (with Rafael Advanced Defense Systems and BAE Systems)
Defense Support Services (DS2) with Day & Zimmermann
Tata Lockheed Martin Aerostructures Limited (with Indian company Tata Advanced Systems)
Advanced Military Maintenance Repair and Overhaul Center (AMMROC) (with Mubadala Development Company)
Divested
Pacific Architects and Engineers (PAE) Holding, Inc
SIM Industries (to CAE)
Corporate governance
Board of directors
The board of directors consists of 14 members. As of 2020, members include:
Daniel Akerson (since 2014)
David Burritt (since 2008)
Bruce Carlson (since 2015)
Joseph F. Dunford (since 2020)
James Ellis (since 2004)
Thomas Falk (since 2010)
Ilene S. Gordon (since 2016)
Vicki A. Hollub (since 2018)
Jeh Johnson (since 2018)
Debra L. Reed-Klages (since 2019)
James D. Taiclet (since 2018)
Chief executive officer
Daniel Tellep (1995–1996)
Norman Augustine (1996–1997)
Vance Coffman (1997–2004)
Robert J. Stevens (2004–2012)
Marillyn Hewson (2013–2020)
James D. Taiclet (2020–present)
Chairman of the board
Robert J. Stevens (2005–2013)
Marillyn Hewson (2014–2021)
James D. Taiclet (2021-present)
Ownership
As of December 2023, Lockheed Martin shares are mainly held by institutional investors (State Street Corporation, Vanguard group, BlackRock, Capital Group Companies, and others).
Criticism
Lockheed Martin is listed as the largest U.S. government contractor and ranks first for the number of incidents, and fifth for the size of settlements on the 'contractor misconduct' database maintained by the Project on Government Oversight, a Washington, D.C.–based watchdog group. Since 1995, the company has agreed to pay $676.8 million to settle 88 instances of misconduct.
In 2015, Lockheed Martin agreed to pay $4.7 million to settle charges that it illegally used taxpayer money to lobby the federal government to block competitors, including by funneling funds through its subsidiary, Sandia Corporation. This involved hiring former Representative Heather Wilson, one of the most influential ex-lawmakers in the defense sector, as an unregistered lobbyist to maintain Lockheed's lucrative nuclear weapons lab contracts. More broadly, commentators have criticized Lockheed Martin and other weapons defense firms for using secretive spending and dark money to influence defense policy, raising concerns about reduced accountability and national security risks.
In 2013, Lt. Gen. Christopher Bogdan criticized the company's F-35 fighter program. The general said: "I want them both to start behaving like they want to be around for 40 years ... I want them to take on some of the risk of this program. I want them to invest in cost reductions. I want them to do the things that will build a better relationship. I'm not getting all that love yet." The criticism came in the wake of previous criticism from former Defense Secretary Robert Gates regarding the same program.
Lockheed Martin has highlighted the conflicts in Gaza and Ukraine as potential opportunities for future revenue growth.
In March 2026, a panel of the Fifth Circuit Court of Appeals revived a qui tam lawsuit in United States ex rel. Ferguson v. Lockheed Martin Corp. The case involves allegations that the company violated the Truth in Negotiations Act and the False Claims Act by providing inaccurate labor cost data during negotiations for the F-35 program.
Lobbying
According to the magazine Politico, Lockheed Martin has "a political network that is already the envy of its competitors", and its contracts enjoy wide bipartisan support in the U.S. Congress thanks to it having "perfected the strategy of spreading jobs on weapons programs in key states and congressional districts". The company's 2022 lobbying expenditure is $13.6 million (2009 total: $13.7 million).
Through its political action committee (PAC), the company provides low levels of financial support to candidates who advocate national defense and relevant business issues. It was the largest contributor to the House Armed Services Committee chairman, Republican Buck McKeon of California with over $50,000 donated in the election cycle as of January 2011. It also was the top donor to Sen. Daniel Inouye (D-HI), the chair of the Senate Appropriations Committee before his death in 2012.
Lockheed Martin Employees Political Action Committee is one of the 50 largest in the country, according to FEC data. With contributions from 3,000 employees, it donates $500,000 a year to about 260 House and Senate candidates.
In 2025, Lockheed Martin was one of the donors who funded the Trump administration's East Wing demolition and planned building of a ballroom. A 2026 report found that no single donor to Trump's ballroom project subsequently received more federal government contracts than Lockheed Martin.
Management
Senior management consists of the CEO, CFO, and Executive Vice Presidents (EVPs) of four business areas. The EVPs are responsible for managing major programs.
On March 16, 2020, Lockheed announced that CEO Marillyn Hewson would become executive chair and be succeeded as CEO by James Taiclet on June 15; Taiclet was at the time the head of American Tower, and had previously been the president of Honeywell Aerospace and before that a VP at United Technologies. Lockheed also announced that it would create the chief operating officer role, to which current EVP Frank A. St John would be promoted.
Employees in each program are organized into four tiers: Tier 1: Program Manager/VP, Tier 2: Functional Teams (Finance, Chief Engineer, Quality, Operations, etc.), Tier 3: Integrated Product Teams (IPTs) (Weapon System Development, Weapon System Integration, etc.), and Tier 4: detailed product development. Floor or touch workers belong to component assembly teams. Lockheed Martin manages and maintains its relationship with these touch workers through its supervisors and unions.
Lockheed Martin manages employees through its Full Spectrum Leadership and LM21 programs. The LM21 program relies on Six Sigma principles, which are techniques to improve efficiency. Senior management constructs leadership councils and assigns managers to facilitate Kaizen events, which target specific processes for improvement. A manager facilitates teams and processes stakeholders and suppliers to streamline process implementation.
Tier 2 Functional Leads and Tier 3 IPT Leads report to Tier 1. IPT leads are responsible for entire systems or products defined by the contract's Statement of Work.
To control quality, Lockheed Martin trains and builds IPT teams. and ensures that work is executed correctly through a Technical Performance Measure (TPM) system which emphasizes its Lean and 6 Sigma processes. Middle management uses commitment mechanisms that parallel high commitment and human relations theory.
Floor employees assemble aircraft using Flow-to-takt lean manufacturing process which uses properties from both division of labor and scientific management. By separating tasks based on parts, Lockheed Martin utilizes the division of labor theory, specialization on a specific area creates efficiency.
Double Helix methodology
The "Double Helix methodology" is a systems development methodology used by Lockheed Martin. It combines experimentation, technology, and a warfighter's concept of operations to create new tactics and weapons.
Source: Wikipedia, CC BY-SA 4.0 · View on Wikipedia ↗
LMT Stock Snapshot Price, market cap, P/E, EPS, ROE, debt/equity, 52-week range
LMT Stock Price Chart Daily OHLCV with technical indicators — pan, zoom, and customize your view
10-Year Performance Revenue, net income, margins and EPS trends
Valuation P/E, P/S, P/B, EV/EBITDA ratios — is the stock expensive or cheap?
Profitability Gross, operating and net margins; ROE, ROA, ROIC
Financial Health Debt, liquidity, solvency — balance sheet strength
Growth Revenue, EPS and net income growth: YoY, 3Y CAGR, 5Y CAGR
Capital Efficiency Asset turnover, inventory turnover, receivables turnover
Dividends Yield, payout ratio, dividend history, 5Y CAGR
| Ex-date | Amount |
|---|---|
| June 1, 2026 | $3.4500 |
| March 2, 2026 | $3.4500 |
| Dec. 1, 2025 | $3.4500 |
| Sept. 2, 2025 | $3.3000 |
| June 2, 2025 | $3.3000 |
| March 3, 2025 | $3.3000 |
| Dec. 2, 2024 | $3.3000 |
| Sept. 3, 2024 | $3.1500 |
| June 3, 2024 | $3.1500 |
| Feb. 29, 2024 | $3.1500 |
| Nov. 30, 2023 | $3.1500 |
| Aug. 31, 2023 | $3.0000 |
| May 31, 2023 | $3.0000 |
| Feb. 28, 2023 | $3.0000 |
| Nov. 30, 2022 | $3.0000 |
| Aug. 31, 2022 | $2.8000 |
| May 31, 2022 | $2.8000 |
| Feb. 28, 2022 | $2.8000 |
| Nov. 30, 2021 | $2.8000 |
| Aug. 31, 2021 | $2.6000 |
LMT Analyst Consensus Bullish and bearish analyst opinions, 12-month price target, upside
- Strong Buy 6 21.4%
- Buy 7 25.0%
- Hold 14 50.0%
- Sell 1 3.6%
- Strong Sell 0 0.0%
12-Month Price Target
19 analysts · 2026-08-20Earnings History EPS actual vs estimate, surprise %, beat rate, next earnings date
| Period | EPS Actual | EPS Est | Surprise |
|---|---|---|---|
| June 30, 2026 | $7.94 | $7.18 | 0.76% |
| March 31, 2026 | $6.44 | $6.79 | -0.35% |
| Dec. 31, 2025 | $7.43 | $5.76 | 1.7% |
| Sept. 30, 2025 | $6.95 | $6.42 | 0.53% |
| June 30, 2025 | $7.29 | $6.51 | 0.78% |
| March 31, 2025 | $7.28 | $6.40 | 0.88% |
Peer comparison (GICS sub-industry) Key metrics vs sector peers
| Ticker | Market Cap | P/E | Rev YoY | Net Margin | ROE | Gross Margin |
|---|---|---|---|---|---|---|
| LMT | $110.76B | 22.5 | 5.6% | 6.7% | 83.2% | 10.2% |
| GE | $323.05B | 37.8 | 18.5% | 19.0% | 45.8% | — |
| RTX | — | 37.0 | 9.7% | 7.6% | 10.7% | — |
| BA | $219.78B | 87.5 | 34.5% | 2.5% | 289.1% | 4.8% |
| HWM | $82.34B | 55.3 | 11.1% | 18.3% | 29.0% | — |
| GD | $91.03B | 21.8 | 10.1% | 8.0% | 17.1% | — |
| NOC | $80.97B | 19.6 | 2.2% | 10.0% | 26.4% | — |
| TDG | — | 41.1 | 11.2% | 23.5% | -26.0% | 60.1% |
| HONA | — | — | — | — | — | — |
| LHX | $56.89B | 35.7 | 9.8% | — | 8.2% | — |
Full Fundamentals All metrics by year — income statement, balance sheet, cash flow
Income Statement 15
| Metric | Trend | 2025 | 2024 | 2023 | 2022 | 2021 | 2020 | 2019 | 2018 | 2017 | 2016 | 2015 | 2014 |
|---|---|---|---|---|---|---|---|---|---|---|---|---|---|
| Revenue | $75.05B | $71.04B | $67.57B | $65.98B | $67.04B | $65.40B | $59.81B | $53.76B | $49.96B | $47.29B | $40.54B | $39.95B | |
| Cost of Revenue | $67.43B | $64.11B | $59.09B | $57.70B | $57.98B | $56.74B | $51.45B | $46.49B | $43.59B | $41.89B | $36.04B | $35.26B | |
| Gross Profit | $7.62B | $6.93B | $8.48B | $8.29B | $9.06B | $8.65B | $8.37B | $7.27B | $6.37B | $5.40B | $4.49B | $4.68B | |
| R&D Expense | $2.00B | $1.60B | $1.50B | $1.70B | $1.50B | $1.30B | $1.30B | $1.30B | $1.20B | $988M | $817M | $733M | |
| Operating Income | $7.73B | $7.01B | $8.51B | $8.35B | $9.12B | $8.64B | $8.54B | $7.33B | $6.74B | $5.89B | $4.71B | $5.01B | |
| Interest Expense | · | · | $916M | $623M | $569M | $591M | $653M | $668M | $651M | $663M | $443M | $340M | |
| Other Non-op | $183M | $181M | $64M | $-74M | $288M | $-37M | $-74M | $-828M | $-847M | $-471M | $30M | $5M | |
| Pretax Income | $5.92B | $6.22B | $8.10B | $6.68B | $7.55B | $8.23B | $7.24B | $5.84B | $5.25B | $4.75B | $4.30B | $4.68B | |
| Income Tax | $905M | $884M | $1.18B | $948M | $1.24B | $1.35B | $1.01B | $792M | $3.36B | $1.09B | $1.17B | $1.42B | |
| Net Income | $5.02B | $5.34B | $6.92B | $5.73B | $6.32B | $6.83B | $6.23B | $5.05B | $1.96B | $5.17B | $3.60B | $3.61B | |
| EPS (Basic) | $21.56 | $22.39 | $27.65 | $21.74 | $22.85 | $24.40 | $22.09 | $17.74 | $6.82 | $17.28 | $11.62 | $11.41 | |
| EPS (Diluted) | $21.49 | $22.31 | $27.55 | $21.66 | $22.76 | $24.30 | $21.95 | $17.59 | $6.75 | $17.07 | $11.46 | $11.21 | |
| Shares (Basic) | 232,700,000 | 238,300,000 | 250,300,000 | 263,700,000 | 276,400,000 | 280,000,000 | 282,000,000 | 284,500,000 | 287,800,000 | 299,300,000 | 310,300,000 | 316,800,000 | |
| Shares (Diluted) | 233,500,000 | 239,200,000 | 251,200,000 | 264,600,000 | 277,400,000 | 281,200,000 | 283,800,000 | 286,800,000 | 290,600,000 | 303,100,000 | 314,700,000 | 322,400,000 | |
| EBITDA | $9.42B | $7.01B | $8.51B | $8.35B | $9.12B | $8.64B | $8.54B | $7.33B | $5.92B | $5.55B | $5.44B | $5.59B |
Balance Sheet 26
| Metric | Trend | 2025 | 2024 | 2023 | 2022 | 2021 | 2020 | 2019 | 2018 | 2017 | 2016 | 2015 | 2014 |
|---|---|---|---|---|---|---|---|---|---|---|---|---|---|
| Cash & Equivalents | $4.12B | $2.48B | $1.44B | $2.55B | $3.60B | $3.16B | $1.51B | $772M | $2.86B | $1.84B | $1.09B | $1.45B | |
| Receivables | $3.90B | $2.35B | $2.13B | $2.50B | $1.96B | $1.98B | $2.34B | $2.44B | $2.27B | $8.20B | $7.25B | $5.88B | |
| Inventory | $3.52B | $3.47B | $3.13B | $3.09B | $2.98B | $3.54B | $3.62B | $3.00B | $2.88B | · | · | · | |
| Other Current Assets | $815M | $584M | $632M | $533M | $688M | $1.15B | $531M | $418M | $1.51B | $399M | $441M | $744M | |
| Current Assets | $25.36B | $21.85B | $20.52B | $20.99B | $19.82B | $19.38B | $17.09B | $16.10B | $17.50B | $15.11B | $14.57B | $12.32B | |
| PP&E (Net) | $11.29B | $8.73B | $8.37B | $7.97B | $7.60B | $7.21B | $6.59B | $6.12B | $5.78B | $5.55B | $5.39B | $4.75B | |
| PP&E (Gross) | $23.10B | $22.22B | $21.18B | $20.14B | $19.10B | $18.15B | $16.98B | $16.09B | $15.36B | $14.88B | $14.27B | $13.49B | |
| Accum. Depreciation | $14.23B | $13.49B | $12.81B | $12.16B | $11.50B | $10.94B | $10.39B | $9.96B | $9.59B | $9.33B | $8.88B | $8.74B | |
| Goodwill | $11.31B | $11.07B | $10.80B | $10.78B | $10.81B | $10.81B | $10.60B | $10.77B | $10.81B | $10.76B | $10.70B | $7.96B | |
| Intangibles | $1.89B | $2.02B | $2.21B | $2.46B | $2.71B | $3.01B | $3.21B | $3.49B | $3.80B | $4.09B | $4.02B | $324M | |
| Other Non-current Assets | $7.01B | $6.54B | $7.60B | $6.93B | $7.65B | $6.83B | $6.71B | $5.18B | $5.58B | $5.67B | $5.40B | $4.77B | |
| Total Assets | $59.84B | $55.62B | $52.46B | $52.88B | $50.87B | $50.71B | $47.53B | $44.88B | $46.62B | $47.81B | $49.30B | $37.05B | |
| Accounts Payable | $3.63B | $2.22B | $2.31B | $2.12B | $780M | $880M | $1.28B | $2.40B | $1.47B | $1.65B | $1.75B | $1.56B | |
| Short-term Debt | · | · | · | · | · | · | $0 | $600M | $0 | $0 | $0 | · | |
| Current Liabilities | $23.34B | $19.42B | $16.94B | $15.89B | $14.00B | $13.93B | $13.97B | $14.40B | $12.91B | $12.54B | $13.92B | $11.11B | |
| Capital Leases | $825M | $833M | $862M | $916M | $1.10B | $841M | $855M | · | · | · | · | · | |
| Other Non-current Liabilities | $5.34B | $5.45B | $5.23B | $6.83B | $5.93B | $6.20B | $5.75B | $4.31B | $4.55B | $4.66B | $4.90B | $3.88B | |
| Total Liabilities | $53.12B | $49.28B | $45.62B | $43.61B | $39.91B | $44.67B | $44.36B | $43.43B | $47.40B | $46.20B | $46.21B | $33.65B | |
| Long-term Debt | $21.70B | $20.27B | $17.46B | $15.55B | $11.68B | $12.17B | $12.65B | $14.10B | $14.26B | $14.28B | $15.26B | $6.14B | |
| Total Debt | $21.70B | $20.27B | $17.46B | $15.55B | $11.68B | $12.17B | $12.65B | $14.70B | $14.26B | $14.28B | $15.26B | $6.17B | |
| Common Stock | $229M | $234M | $240M | $254M | $271M | $279M | $280M | $281M | $284M | $289M | $303M | $314M | |
| Retained Earnings | $14.03B | $14.55B | $15.40B | $16.94B | $21.60B | $21.64B | $18.40B | $15.43B | $11.40B | $13.32B | $0 | $14.96B | |
| AOCI | $-7.54B | $-8.45B | $-8.80B | $-8.02B | $-11.01B | $-16.12B | $-15.55B | $-14.32B | $-12.54B | $-12.10B | $-11.44B | $-11.87B | |
| Stockholders' Equity | $6.72B | $6.33B | $6.83B | $9.27B | $10.96B | $6.01B | $3.13B | $1.39B | $-850M | $1.51B | $3.10B | $3.40B | |
| Liabilities + Equity | $59.84B | $55.62B | $52.46B | $52.88B | $50.87B | $50.71B | $47.53B | $44.88B | $46.62B | $47.81B | $49.30B | $37.05B | |
| Shares Outstanding | 229,000,000 | 234,000,000 | 240,000,000 | 254,000,000 | 271,000,000 | 279,000,000 | 280,000,000 | · | 284,000,000 | 289,000,000 | 303,000,000 | 314,000,000 |
Cash Flow 19
| Metric | Trend | 2025 | 2024 | 2023 | 2022 | 2021 | 2020 | 2019 | 2018 | 2017 | 2016 | 2015 | 2014 |
|---|---|---|---|---|---|---|---|---|---|---|---|---|---|
| D&A | $1.69B | $1.56B | $1.43B | $1.40B | $1.36B | $1.02B | $906M | $1.16B | $1.20B | $1.17B | $945M | $927M | |
| Stock-based Comp | $304M | $277M | $265M | $238M | $227M | $221M | $189M | $173M | $158M | $149M | $138M | $164M | |
| Deferred Tax | $372M | $-588M | $-498M | $-757M | $-183M | $5M | $222M | $-244M | $3.45B | $-193M | $-445M | $-401M | |
| Amort. of Intangibles | $254M | $254M | $247M | $248M | $285M | $271M | $284M | $296M | $312M | $284M | $68M | $20M | |
| Restructuring | · | · | · | · | · | · | $0 | $96M | $0 | · | · | · | |
| Other Non-cash | $1.18B | · | · | · | · | · | · | · | · | · | · | · | |
| Operating Cash Flow | $8.56B | $6.97B | $7.92B | $7.80B | $9.22B | $8.18B | $7.31B | $3.14B | $6.48B | $5.19B | $5.10B | $3.87B | |
| CapEx | $1.65B | $1.69B | $1.69B | $1.67B | $1.52B | $1.77B | $1.48B | $1.28B | $1.18B | $1.06B | $939M | $845M | |
| Investing Cash Flow | $-1.98B | $-1.79B | $-1.69B | $-1.79B | $-1.16B | $-2.01B | $-1.24B | $-1.07B | $-1.15B | $-985M | $-9.73B | $-1.72B | |
| Debt Issued | · | · | · | · | · | $1.13B | $0 | $0 | $0 | $0 | $9.10B | · | |
| Net Debt Issued | · | · | · | · | · | $1.13B | $-900M | $-750M | $0 | $-952M | $9.10B | · | |
| Stock Repurchased | $3.00B | $3.70B | $6.00B | $7.90B | $4.09B | $1.10B | $1.20B | $1.49B | $2.00B | $2.10B | $3.07B | $1.90B | |
| Net Stock Activity | $-3.00B | $-3.70B | $-6.00B | $-7.90B | $-4.09B | $-1.10B | $-1.20B | $-1.49B | $-2.00B | $-2.10B | $-3.07B | $-1.90B | |
| Dividends Paid | $3.13B | $3.06B | $3.06B | $3.02B | $2.94B | $2.76B | $2.56B | $2.35B | $2.16B | $2.05B | $1.93B | $1.76B | |
| Financing Cash Flow | $-4.94B | $-4.14B | $-7.33B | $-7.07B | $-7.62B | $-4.53B | $-5.33B | $-4.15B | $-4.30B | $-3.46B | $4.28B | $-3.31B | |
| Net Change in Cash | $1.64B | $1.04B | $-1.10B | $-1.06B | $444M | $1.65B | $742M | $-2.09B | $1.02B | $747M | $-356M | $-1.17B | |
| Taxes Paid | $788M | $1.30B | $1.80B | $1.60B | $1.40B | $1.40B | $940M | $-41M | $1.10B | $1.30B | $1.80B | $1.50B | |
| Free Cash Flow | $6.91B | $5.29B | $6.23B | $6.13B | $7.70B | $6.42B | $5.83B | $1.86B | $5.30B | $4.13B | $4.16B | $3.02B | |
| Levered FCF | · | · | $5.45B | $5.60B | $7.22B | $5.92B | $5.27B | $1.28B | $5.06B | $3.62B | $3.84B | $2.79B |
Profitability 8
| Metric | Trend | 2025 | 2024 | 2023 | 2022 | 2021 | 2020 | 2019 | 2018 | 2017 | 2016 | 2015 | 2014 |
|---|---|---|---|---|---|---|---|---|---|---|---|---|---|
| Gross Margin | 10.2% | 9.8% | 12.6% | 12.6% | 13.5% | 13.2% | 14.0% | 13.5% | 10.9% | 10.7% | 11.3% | 11.5% | |
| Operating Margin | 10.3% | 9.9% | 12.6% | 12.7% | 13.6% | 13.2% | 14.3% | 13.6% | 11.6% | 11.7% | 11.8% | 12.3% | |
| Net Margin | 6.7% | 7.5% | 10.2% | 8.7% | 9.4% | 10.4% | 10.4% | 9.4% | 3.9% | 11.2% | 7.8% | 7.9% | |
| Pretax Margin | 7.9% | 8.8% | 12.0% | 10.1% | 11.3% | 12.6% | 12.1% | 10.9% | 10.3% | 10.3% | 10.9% | 11.5% | |
| EBITDA Margin | 12.6% | 9.9% | 12.6% | 12.7% | 13.6% | 13.2% | 14.3% | 13.6% | 11.6% | 11.7% | 11.8% | 12.3% | |
| ROA | 8.7% | 9.9% | 13.1% | 11.1% | 12.4% | 13.9% | 13.5% | 11.0% | 4.2% | 10.9% | 8.4% | 9.9% | |
| ROE | 83.2% | 78.9% | 85.9% | 56.7% | 74.4% | 149.5% | 275.6% | 1855.2% | 483.6% | 230.1% | 118.6% | 90.6% | |
| ROIC | 23.0% | 22.6% | 29.9% | 28.9% | 33.7% | 39.8% | 46.6% | 39.4% | 16.0% | 27.0% | 21.2% | 40.2% |
Liquidity & Solvency 5
| Metric | Trend | 2025 | 2024 | 2023 | 2022 | 2021 | 2020 | 2019 | 2018 | 2017 | 2016 | 2015 | 2014 |
|---|---|---|---|---|---|---|---|---|---|---|---|---|---|
| Current Ratio | 1.1 | 1.1 | 1.2 | 1.3 | 1.4 | 1.4 | 1.2 | 1.1 | 1.4 | 1.2 | 1.2 | 1.1 | |
| Quick Ratio | 0.3 | 0.2 | 0.2 | 0.3 | 0.4 | 0.4 | 0.3 | 0.2 | 0.9 | 0.8 | 0.7 | 0.7 | |
| Debt / Equity | 3.2 | 3.2 | 2.6 | 1.7 | 1.1 | 2.0 | 4.0 | 10.5 | -20.9 | 9.5 | 4.9 | 1.8 | |
| LT Debt / Equity | 3.1 | 3.1 | 2.5 | 1.7 | 1.1 | 1.9 | 3.6 | 9.0 | -19.8 | 9.5 | 4.6 | 1.8 | |
| Interest Coverage | · | · | 9.3 | 13.4 | 16.0 | 14.6 | 13.1 | 11.0 | 9.1 | 8.4 | 12.3 | 16.4 |
Efficiency 3
| Metric | Trend | 2025 | 2024 | 2023 | 2022 | 2021 | 2020 | 2019 | 2018 | 2017 | 2016 | 2015 | 2014 |
|---|---|---|---|---|---|---|---|---|---|---|---|---|---|
| Asset Turnover | 1.3 | 1.3 | 1.3 | 1.3 | 1.3 | 1.3 | 1.3 | 1.2 | 1.1 | 1.0 | 1.1 | 1.2 | |
| Inventory Turnover | 19.3 | 19.4 | 19.0 | 19.0 | 17.8 | 15.8 | 15.6 | 15.8 | · | · | · | · | |
| Receivables Turnover | 24.0 | 31.7 | 29.1 | 29.5 | 34.0 | 30.3 | 25.0 | 22.8 | 6.1 | 6.1 | 6.6 | 7.8 |
Growth Rates 10
| Metric | Trend | 2025 | 2024 | 2023 | 2022 | 2021 | 2020 | 2019 | 2018 | 2017 | 2016 | 2015 | 2014 |
|---|---|---|---|---|---|---|---|---|---|---|---|---|---|
| Revenue YoY | 5.6% | 5.1% | 2.4% | -1.6% | 2.5% | · | · | · | · | · | · | · | |
| Revenue CAGR 3Y | 4.4% | 1.9% | 1.1% | · | · | · | · | · | · | · | · | · | |
| Revenue CAGR 5Y | 2.8% | · | · | · | · | · | · | · | · | · | · | · | |
| EPS YoY | -3.7% | -19.0% | 27.2% | -4.8% | -6.3% | · | · | · | · | · | · | · | |
| EPS CAGR 3Y | -0.26% | -0.66% | 4.3% | · | · | · | · | · | · | · | · | · | |
| EPS CAGR 5Y | -2.4% | · | · | · | · | · | · | · | · | · | · | · | |
| Net Income YoY | -6.0% | -22.9% | 20.7% | -9.2% | -7.6% | · | · | · | · | · | · | · | |
| Net Income CAGR 3Y | -4.3% | -5.5% | 0.42% | · | · | · | · | · | · | · | · | · | |
| Net Income CAGR 5Y | -6.0% | · | · | · | · | · | · | · | · | · | · | · | |
| Dividend CAGR 5Y | 2.5% | · | · | · | · | · | · | · | · | · | · | · |
Valuation (TTM) 16
| Metric | Trend | 2025 | 2024 | 2023 | 2022 | 2021 | 2020 | 2019 | 2018 | 2017 | 2016 | 2015 | 2014 |
|---|---|---|---|---|---|---|---|---|---|---|---|---|---|
| Revenue TTM | $75.05B | $71.04B | $67.57B | $65.98B | $67.04B | $65.40B | $59.81B | $53.76B | $49.96B | $47.29B | $40.54B | $39.95B | |
| Net Income TTM | $5.02B | $5.34B | $6.92B | $5.73B | $6.32B | $6.83B | $6.23B | $5.05B | $1.96B | $5.17B | $3.60B | $3.61B | |
| Market Cap | $110.76B | $113.71B | $108.78B | $123.57B | $96.32B | $99.04B | · | · | $91.18B | $72.23B | $65.80B | $60.47B | |
| Enterprise Value | $128.34B | $131.50B | $124.79B | $136.57B | $104.39B | $108.05B | · | · | $102.58B | $84.68B | $79.97B | $65.19B | |
| P/E | 22.5 | 21.8 | 16.5 | 22.5 | 15.6 | 14.6 | 17.7 | 14.9 | 47.6 | 14.6 | 18.9 | 17.2 | |
| P/S | 1.5 | 1.6 | 1.6 | 1.9 | 1.4 | 1.5 | · | · | 1.8 | 1.5 | 1.6 | 1.5 | |
| P/B | 16.5 | 18.0 | 15.9 | 13.3 | 8.8 | 16.5 | · | · | -133.5 | 47.8 | 21.2 | 17.8 | |
| P / Cash Flow | 12.9 | 16.3 | 13.7 | 15.8 | 10.4 | 12.1 | · | · | 14.1 | 13.9 | 12.9 | 15.6 | |
| P / FCF | 16.0 | 21.5 | 17.5 | 20.2 | 12.5 | 15.4 | · | · | 17.2 | 17.5 | 15.8 | 20.0 | |
| EV / EBITDA | 13.6 | 18.8 | 14.7 | 16.4 | 11.4 | 12.5 | · | · | 17.3 | 15.3 | 14.7 | 11.7 | |
| EV / FCF | 18.6 | 24.9 | 20.0 | 22.3 | 13.6 | 16.8 | · | · | 19.4 | 20.5 | 19.2 | 21.6 | |
| EV / Revenue | 1.7 | 1.9 | 1.8 | 2.1 | 1.6 | 1.7 | · | · | 2.1 | 1.8 | 2.0 | 1.6 | |
| Dividend Yield | 2.8% | 2.7% | 2.8% | 2.4% | 3.0% | 2.8% | · | · | 2.4% | 2.8% | 2.9% | 2.9% | |
| Earnings Yield | 4.4% | 4.6% | 6.1% | 4.5% | 6.4% | 6.9% | 5.6% | 6.7% | 2.1% | 6.8% | 5.3% | 5.8% | |
| Payout Ratio | 62.4% | 57.3% | 44.2% | 52.6% | 46.6% | 40.5% | 41.0% | 46.5% | 108.0% | 38.6% | 53.6% | 48.7% | |
| Annual Payout | $3.13B | $3.06B | $3.06B | $3.02B | $2.94B | $2.76B | $2.56B | $2.35B | $2.16B | $2.05B | $1.93B | $1.76B |
Income Statement 14
| Metric | Trend | Q2 2026 | Q1 2026 | Q4 2025 | Q3 2025 | Q2 2025 | Q1 2025 | Q4 2024 | Q3 2024 | Q2 2024 | Q1 2024 | Q4 2023 | Q3 2023 | Q2 2023 | Q1 2023 | Q4 2022 | Q3 2022 |
|---|---|---|---|---|---|---|---|---|---|---|---|---|---|---|---|---|---|
| Revenue | $20.06B | $18.02B | $20.32B | $18.61B | $18.16B | $17.96B | $18.62B | $17.10B | $18.12B | $17.20B | $18.87B | $16.88B | $16.69B | $15.13B | $18.99B | $16.58B | |
| Cost of Revenue | $17.62B | $15.94B | $18.00B | $16.37B | $17.42B | $15.64B | $17.93B | $14.99B | $15.99B | $15.20B | $16.58B | $14.83B | $14.60B | $13.08B | $16.69B | $14.46B | |
| Gross Profit | $2.45B | $2.08B | $2.32B | $2.24B | $734M | $2.32B | $690M | $2.12B | $2.13B | $1.99B | $2.29B | $2.05B | $2.09B | $2.05B | $2.30B | $2.12B | |
| Operating Income | $2.48B | $2.06B | $2.33B | $2.28B | $748M | $2.37B | $696M | $2.14B | $2.15B | $2.03B | $2.29B | $2.04B | $2.13B | $2.04B | $2.29B | $2.16B | |
| Interest Expense | · | · | · | · | · | · | · | · | · | $255M | · | $237M | $223M | $202M | · | $145M | |
| Other Non-op | $45M | $60M | $68M | $43M | $42M | $30M | $72M | $18M | $46M | $45M | $-5M | $37M | $-17M | $49M | $-10M | $-26M | |
| Pretax Income | $2.18B | $1.77B | $1.53B | $1.94B | $417M | $2.04B | $519M | $1.92B | $1.95B | $1.83B | $2.15B | $1.95B | $2.01B | $1.99B | $2.19B | $2.10B | |
| Income Tax | $342M | $286M | $187M | $319M | $75M | $324M | $-8M | $295M | $307M | $290M | $279M | $269M | $325M | $305M | $278M | $321M | |
| Net Income | $1.84B | $1.49B | $1.34B | $1.62B | $342M | $1.71B | $527M | $1.62B | $1.64B | $1.54B | $1.87B | $1.68B | $1.68B | $1.69B | $1.91B | $1.78B | |
| EPS (Basic) | $7.98 | $6.47 | $5.82 | $6.98 | $1.46 | $7.30 | $2.27 | $6.83 | $6.87 | $6.42 | $7.62 | $6.75 | $6.65 | $6.63 | $7.39 | $6.73 | |
| EPS (Diluted) | $7.94 | $6.44 | $5.80 | $6.95 | $1.46 | $7.28 | $2.27 | $6.80 | $6.85 | $6.39 | $7.58 | $6.73 | $6.63 | $6.61 | $7.35 | $6.71 | |
| Shares (Basic) | 230,200,000 | 229,900,000 | -467,100,000 | 231,900,000 | 233,500,000 | 234,400,000 | -478,800,000 | 237,500,000 | 238,900,000 | 240,700,000 | -506,500,000 | 249,300,000 | 252,800,000 | 254,700,000 | -534,500,000 | 264,100,000 | |
| Shares (Diluted) | 231,100,000 | 231,100,000 | -468,900,000 | 232,800,000 | 234,300,000 | 235,300,000 | -480,600,000 | 238,600,000 | 239,600,000 | 241,600,000 | -508,300,000 | 250,200,000 | 253,600,000 | 255,700,000 | -536,400,000 | 265,100,000 | |
| EBITDA | $2.48B | $2.46B | · | $2.28B | $748M | $2.37B | · | $2.14B | $2.15B | $2.03B | · | $2.04B | $2.13B | $2.04B | · | $2.16B |
Balance Sheet 25
| Metric | Trend | Q2 2026 | Q1 2026 | Q4 2025 | Q3 2025 | Q2 2025 | Q1 2025 | Q4 2024 | Q3 2024 | Q2 2024 | Q1 2024 | Q4 2023 | Q3 2023 | Q2 2023 | Q1 2023 | Q4 2022 | Q3 2022 |
|---|---|---|---|---|---|---|---|---|---|---|---|---|---|---|---|---|---|
| Cash & Equivalents | $3.79B | $1.89B | $4.12B | $3.47B | $1.29B | $1.80B | $2.48B | $3.15B | $2.52B | $2.79B | · | $3.55B | $3.67B | $2.44B | · | $2.43B | |
| Receivables | $3.36B | $2.32B | $3.90B | $3.84B | $3.31B | $2.02B | $2.35B | $2.14B | $2.93B | $2.26B | · | $2.40B | $3.43B | $2.58B | · | $2.48B | |
| Inventory | $4.41B | $4.25B | $3.52B | $3.75B | $3.70B | $3.60B | $3.47B | $3.23B | $3.10B | $3.28B | · | · | · | · | · | · | |
| Other Current Assets | $805M | $728M | $815M | $924M | $794M | $698M | $584M | $461M | $510M | $583M | · | $449M | $481M | $461M | · | $600M | |
| Current Assets | $28.40B | $25.08B | $25.36B | $25.94B | $23.99B | $22.80B | $21.85B | $23.21B | $22.97B | $22.96B | · | $23.32B | $24.09B | $22.14B | · | $20.96B | |
| PP&E (Net) | $11.39B | $11.28B | $8.88B | $8.72B | $8.67B | $8.71B | $8.73B | $8.45B | $8.39B | $8.35B | · | $8.05B | $7.97B | $7.94B | · | $7.63B | |
| PP&E (Gross) | · | · | $23.10B | · | · | · | $22.22B | · | · | · | · | · | · | · | · | · | |
| Accum. Depreciation | · | · | $14.23B | · | · | · | $13.49B | · | · | · | · | · | · | · | · | · | |
| Goodwill | $11.30B | $11.31B | $11.31B | $11.31B | $11.31B | $11.08B | $11.07B | $10.80B | $10.79B | $10.79B | $10.80B | $10.78B | $10.79B | $10.78B | $10.78B | $10.76B | |
| Intangibles | $1.79B | $1.84B | $1.89B | $1.94B | $2.01B | $1.95B | $2.02B | $1.98B | $2.04B | $2.15B | · | $2.27B | $2.34B | $2.40B | · | $2.52B | |
| Other Non-current Assets | $7.16B | $6.93B | $7.01B | $8.95B | $8.82B | $8.56B | $6.54B | $7.97B | $7.81B | $7.69B | · | $7.37B | $7.28B | $7.19B | · | $7.04B | |
| Total Assets | $62.45B | $59.24B | $59.84B | $60.28B | $58.87B | $56.67B | $55.62B | $55.52B | $55.08B | $54.96B | · | $56.67B | $56.98B | $54.62B | · | $52.03B | |
| Accounts Payable | $4.92B | $4.71B | $3.63B | $3.83B | $3.65B | $3.82B | $2.22B | $3.22B | $3.28B | $3.52B | · | $3.82B | $3.47B | $3.27B | · | $2.62B | |
| Current Liabilities | $23.81B | $22.09B | $23.34B | $22.97B | $24.35B | $21.19B | $19.42B | $17.81B | $18.49B | $17.70B | · | $17.19B | $17.70B | $16.98B | · | $16.35B | |
| Capital Leases | · | · | $825M | · | · | · | · | · | · | · | · | · | · | · | · | · | |
| Other Non-current Liabilities | $5.40B | $5.21B | $5.34B | $5.74B | $5.82B | $5.32B | $5.45B | $5.25B | $5.19B | $5.23B | · | $7.66B | $7.40B | $7.09B | · | $6.49B | |
| Total Liabilities | $53.68B | $51.75B | $53.12B | $54.09B | $53.54B | $49.99B | $49.28B | $48.32B | $48.90B | $48.31B | · | $47.39B | $47.74B | $44.98B | · | $40.06B | |
| Long-term Debt | $20.54B | $20.70B | $21.70B | $22.19B | $21.64B | $20.30B | $20.27B | $19.32B | $19.26B | $19.42B | · | $17.39B | $17.55B | $15.60B | · | · | |
| Total Debt | $20.54B | $20.70B | · | $22.19B | $21.64B | $20.30B | · | $19.32B | $19.26B | $19.42B | · | $17.39B | $17.55B | $15.60B | · | $11.48B | |
| Common Stock | $230M | $230M | $229M | $230M | $232M | $233M | $234M | $236M | $237M | $239M | · | $247M | $251M | $254M | · | $261M | |
| Retained Earnings | $15.76B | $14.72B | $14.03B | $14.05B | $13.26B | $14.77B | $14.55B | $15.66B | $14.71B | $15.22B | · | $17.07B | $17.07B | $17.48B | · | $19.84B | |
| AOCI | $-7.47B | $-7.50B | $-7.54B | $-8.10B | $-8.16B | $-8.32B | $-8.45B | $-8.69B | $-8.77B | $-8.81B | · | $-8.15B | $-8.08B | $-8.09B | · | $-8.13B | |
| Stockholders' Equity | $8.77B | $7.49B | $6.72B | $6.18B | $5.33B | $6.68B | $6.33B | $7.20B | $6.17B | $6.65B | $6.83B | $9.27B | $9.24B | $9.65B | $9.27B | $11.97B | |
| Liabilities + Equity | $62.45B | $59.24B | $59.84B | $60.28B | $58.87B | $56.67B | $55.62B | $55.52B | $55.08B | $54.96B | · | $56.67B | $56.98B | $54.62B | · | $52.03B | |
| Shares Outstanding | · | · | 229,000,000 | · | · | · | 234,000,000 | · | · | · | · | · | · | · | · | · |
Cash Flow 15
| Metric | Trend | Q2 2026 | Q1 2026 | Q4 2025 | Q3 2025 | Q2 2025 | Q1 2025 | Q4 2024 | Q3 2024 | Q2 2024 | Q1 2024 | Q4 2023 | Q3 2023 | Q2 2023 | Q1 2023 | Q4 2022 | Q3 2022 |
|---|---|---|---|---|---|---|---|---|---|---|---|---|---|---|---|---|---|
| D&A | $400M | $398M | · | · | $399M | $397M | · | · | · | · | · | · | · | · | · | · | |
| Stock-based Comp | $97M | $83M | $89M | $74M | $81M | $60M | $48M | $75M | $93M | $61M | $44M | $75M | $89M | $57M | $43M | $61M | |
| Deferred Tax | $377M | $161M | $300M | $633M | $-527M | $-34M | $-414M | $-29M | $-68M | $-77M | $-103M | $-161M | $-117M | $-117M | $-217M | $632M | |
| Other Non-cash | · | $-1.91B | · | · | · | · | · | · | · | · | · | · | · | · | · | · | |
| Operating Cash Flow | $3.23B | $220M | $3.22B | $3.73B | $201M | $1.41B | $1.02B | $2.44B | $1.88B | $1.64B | $2.37B | $2.89B | $1.10B | $1.56B | $1.93B | $3.13B | |
| CapEx | $318M | $511M | $463M | $381M | $351M | $454M | $582M | $355M | $370M | $378M | $704M | $364M | $329M | $294M | $693M | $405M | |
| Investing Cash Flow | $-349M | $-541M | $-513M | $-319M | $-715M | $-430M | $-838M | $-210M | $-372M | $-372M | $-703M | $-398M | $-334M | $-259M | $-808M | $-398M | |
| Net Debt Issued | · | $-1.00B | · | · | · | · | · | · | · | · | · | · | · | · | · | · | |
| Stock Repurchased | $0 | $0 | $750M | $1.00B | $500M | $750M | $1.00B | $850M | $850M | $1.00B | $3.00B | $1.75B | $750M | $500M | $4.21B | $1.34B | |
| Net Stock Activity | · | $0 | · | · | · | $-750M | · | · | · | $-1.00B | · | · | · | $-500M | · | · | |
| Dividends Paid | $796M | $816M | $799M | $765M | $771M | $796M | $778M | $749M | $752M | $780M | $767M | $747M | $758M | $784M | $766M | $739M | |
| Financing Cash Flow | $-989M | $-1.91B | $-2.06B | $-1.23B | $4M | $-1.66B | $-853M | $-1.60B | $-1.77B | $85M | $-3.77B | $-2.62B | $467M | $-1.41B | $-1.00B | $-2.08B | |
| Net Change in Cash | $1.90B | $-2.23B | $651M | $2.18B | $-510M | $-680M | $-668M | $628M | $-267M | $1.35B | $-2.11B | $-122M | $1.23B | $-107M | $117M | $655M | |
| Free Cash Flow | · | $-291M | · | · | · | $955M | · | · | · | $1.26B | · | · | · | $1.27B | · | · | |
| Levered FCF | · | · | · | · | · | · | · | · | · | $1.04B | · | · | · | $1.10B | · | · |
Profitability 8
| Metric | Trend | Q2 2026 | Q1 2026 | Q4 2025 | Q3 2025 | Q2 2025 | Q1 2025 | Q4 2024 | Q3 2024 | Q2 2024 | Q1 2024 | Q4 2023 | Q3 2023 | Q2 2023 | Q1 2023 | Q4 2022 | Q3 2022 |
|---|---|---|---|---|---|---|---|---|---|---|---|---|---|---|---|---|---|
| Gross Margin | 12.2% | 11.5% | · | 12.0% | 4.0% | 12.9% | · | 12.4% | 11.8% | 11.6% | · | 12.1% | 12.5% | 13.5% | · | 12.8% | |
| Operating Margin | 12.4% | 11.5% | · | 12.2% | 4.1% | 13.2% | · | 12.5% | 11.8% | 11.8% | · | 12.1% | 12.8% | 13.5% | · | 13.0% | |
| Net Margin | 9.2% | 8.3% | · | 8.7% | 1.9% | 9.5% | · | 9.5% | 9.1% | 9.0% | · | 10.0% | 10.1% | 11.2% | · | 10.7% | |
| Pretax Margin | 10.9% | 9.8% | · | 10.4% | 2.3% | 11.3% | · | 11.2% | 10.8% | 10.7% | · | 11.6% | 12.0% | 13.2% | · | 12.7% | |
| EBITDA Margin | 12.4% | 13.7% | · | 12.2% | 4.1% | 13.2% | · | 12.5% | 11.8% | 11.8% | · | 12.1% | 12.8% | 13.5% | · | 13.0% | |
| ROA | 3.0% | 2.6% | · | 2.8% | 0.60% | 3.1% | · | 2.9% | 2.9% | 2.8% | · | 3.1% | 3.1% | 3.2% | · | 3.4% | |
| ROE | 26.0% | 21.0% | · | 24.2% | 5.9% | 25.7% | · | 19.7% | 21.3% | 19.0% | · | 15.9% | 16.3% | 17.2% | · | 16.5% | |
| ROIC | 7.1% | 6.1% | · | 6.7% | 2.3% | 7.4% | · | 6.8% | 7.1% | 6.6% | · | 6.6% | 6.7% | 6.8% | · | 7.8% |
Liquidity & Solvency 5
| Metric | Trend | Q2 2026 | Q1 2026 | Q4 2025 | Q3 2025 | Q2 2025 | Q1 2025 | Q4 2024 | Q3 2024 | Q2 2024 | Q1 2024 | Q4 2023 | Q3 2023 | Q2 2023 | Q1 2023 | Q4 2022 | Q3 2022 |
|---|---|---|---|---|---|---|---|---|---|---|---|---|---|---|---|---|---|
| Current Ratio | 1.2 | 1.1 | · | 1.1 | 1.0 | 1.1 | · | 1.3 | 1.2 | 1.3 | · | 1.4 | 1.4 | 1.3 | · | 1.3 | |
| Quick Ratio | 0.3 | 0.2 | · | 0.3 | 0.2 | 0.2 | · | 0.3 | 0.3 | 0.3 | · | 0.3 | 0.4 | 0.3 | · | 0.3 | |
| Debt / Equity | 2.3 | 2.8 | · | 3.6 | 4.1 | 3.0 | · | 2.7 | 3.1 | 2.9 | · | 1.9 | 1.9 | 1.6 | · | 1.0 | |
| LT Debt / Equity | 2.3 | 2.7 | · | 3.3 | 3.5 | 2.8 | · | 2.7 | 3.1 | 2.9 | · | 1.9 | 1.9 | 1.6 | · | 1.0 | |
| Interest Coverage | · | · | · | · | · | · | · | · | · | 8.0 | · | 8.6 | 9.6 | 10.1 | · | 14.9 |
Efficiency 3
| Metric | Trend | Q2 2026 | Q1 2026 | Q4 2025 | Q3 2025 | Q2 2025 | Q1 2025 | Q4 2024 | Q3 2024 | Q2 2024 | Q1 2024 | Q4 2023 | Q3 2023 | Q2 2023 | Q1 2023 | Q4 2022 | Q3 2022 |
|---|---|---|---|---|---|---|---|---|---|---|---|---|---|---|---|---|---|
| Asset Turnover | 0.3 | 0.3 | · | 0.3 | 0.3 | 0.3 | · | 0.3 | 0.3 | 0.3 | · | 0.3 | 0.3 | 0.3 | · | 0.3 | |
| Inventory Turnover | 4.3 | 4.1 | · | 4.7 | 5.1 | 4.5 | · | 6.0 | 6.0 | 5.4 | · | · | · | · | · | · | |
| Receivables Turnover | 6.0 | 8.3 | · | 6.2 | 5.8 | 8.4 | · | 7.5 | 5.7 | 7.1 | · | 6.9 | 4.9 | 5.9 | · | 7.0 |
Valuation (TTM) 5
| Metric | Trend | Q2 2026 | Q1 2026 | Q4 2025 | Q3 2025 | Q2 2025 | Q1 2025 | Q4 2024 | Q3 2024 | Q2 2024 | Q1 2024 | Q4 2023 | Q3 2023 | Q2 2023 | Q1 2023 | Q4 2022 | Q3 2022 |
|---|---|---|---|---|---|---|---|---|---|---|---|---|---|---|---|---|---|
| Revenue TTM | $74.85B | $72.75B | · | $71.83B | $71.34B | $70.38B | · | $69.30B | $68.89B | $65.89B | · | $65.28B | $63.85B | $62.12B | · | $63.02B | |
| Net Income TTM | $5.29B | $5.16B | · | $5.30B | $5.32B | $6.52B | · | $6.49B | $6.55B | $6.60B | · | $6.83B | $5.46B | $5.51B | · | $4.43B | |
| P/E | 22.3 | 27.8 | · | 21.7 | 20.5 | 16.2 | · | 21.8 | 17.6 | 17.3 | · | 15.5 | 21.8 | 22.7 | · | 25.0 | |
| Earnings Yield | 4.5% | 3.6% | · | 4.6% | 4.9% | 6.2% | · | 4.6% | 5.7% | 5.8% | · | 6.5% | 4.6% | 4.4% | · | 4.0% | |
| Payout Ratio | · | 54.8% | · | · | · | 46.5% | · | · | · | 50.5% | · | · | · | 46.4% | · | · |
Financial Statements Income statement, balance sheet, cash flow — annual, last 5 years
Income Statement
| 2025-12-31 | 2024-12-31 | 2023-12-31 | 2022-12-31 | 2021-12-31 | |
|---|---|---|---|---|---|
| Revenue | $75.05B | $71.04B | $67.57B | $65.98B | $67.04B |
| Gross Margin % | 10.2% | 9.8% | 12.6% | 12.6% | 13.5% |
| Operating Margin % | 10.3% | 9.9% | 12.6% | 12.7% | 13.6% |
| Net Income | $5.02B | $5.34B | $6.92B | $5.73B | $6.32B |
| Diluted EPS | $21.49 | $22.31 | $27.55 | $21.66 | $22.76 |
Balance Sheet
| 2025-12-31 | 2024-12-31 | 2023-12-31 | 2022-12-31 | 2021-12-31 | |
|---|---|---|---|---|---|
| Debt / Equity | 3.2 | 3.2 | 2.6 | 1.7 | 1.1 |
| Current Ratio | 1.1 | 1.1 | 1.2 | 1.3 | 1.4 |
| Quick Ratio | 0.3 | 0.2 | 0.2 | 0.3 | 0.4 |
Cash Flow
| 2025-12-31 | 2024-12-31 | 2023-12-31 | 2022-12-31 | 2021-12-31 | |
|---|---|---|---|---|---|
| Free Cash Flow | $6.91B | $5.29B | $6.23B | $6.13B | $7.70B |
Latest News Recent headlines mentioning this company
- Patriots and THAAD: Lockheed Martin Corporation (LMT) and Northrop Grumman Corporation (NOC) Bet Big on Missile Defense Surge
- Jim Cramer says surging defense stock is a sensational buy
- Goldman Sachs wins $70 billion in asset management deals with Verizon, Lockheed Martin
- Forget AI Stocks: This Defense Giant Has Raised Its Dividend Each of the Last 10 Years and Currently Pays a 2.75% Yield
- Huntington Ingalls Industries vs. Lockheed Martin: Which Industrial Stock Is a Better Buy in 2026?
- GM Reportedly In Talks With Lockheed Martin To Supply Weapons Components
- Germany's First F-35 Stealth Fighter Moves Closer To Service With Key Engine Installation
- US Special Ops Fields Caliber-Swapping MK24 Rifle For 7.62 Combat And 6.5 Range
- Lockheed Martin (LMT) Makes its First Delivery of ICS Baseline
- Why Did South Korea Just Order $4.2 Billion in Military Helicopters From Boeing and Lockheed?
My Metrics Your personal watchlist — selected rows from Full Fundamentals
Pick the metrics that matter to you — click the ➕ next to any row in Full Fundamentals above.
Your selection is saved and follows you across all tickers.
Institutional owners (13F) 3,057 filers · $60.4B total · As of June 30, 2026
Institutions that report holding this stock in their quarterly SEC Form 13F. Long positions only; a single filer may appear twice for separate option legs. Large offsetting put/call legs typically reflect market-making or hedged inventory, not directional conviction.
| New positions | Exited positions | Increased | Decreased | Net shares change |
|---|---|---|---|---|
| 137 (-251 vs prior Q) | 244 (+145 vs prior Q) | 1,152 (+106 vs prior Q) | 1,025 (-111 vs prior Q) | +954K |
Compared to Q1 2026. SEC Form 13F filings are due within 45 days of quarter-end plus a short buffer for late filers — quarters still inside that window are skipped in favor of the most recent fully-reported pair.
| Institution | Value | Shares | % of tracked 13F | Type |
|---|---|---|---|---|
| STATE STREET CORP | $16,799,530,108 | 32,975,170 | 27.80% | Shares |
| VANGUARD CAPITAL MANAGEMENT LLC | $7,213,320,850 | 14,158,758 | 11.94% | Shares |
| VANGUARD PORTFOLIO MANAGEMENT LLC | $2,832,276,131 | 5,559,369 | 4.69% | Shares |
| GEODE CAPITAL MANAGEMENT, LLC | $2,332,227,110 | 4,566,525 | 3.86% | Shares |
| Sanders Capital, LLC | $1,066,571,322 | 2,093,533 | 1.77% | Shares |
| Capital World Investors | $939,555,249 | 1,844,218 | 1.55% | Shares |
| TWO SIGMA INVESTMENTS, LP | $799,768,649 | 1,569,836 | 1.32% | Shares |
| MIRAE ASSET GLOBAL ETFS HOLDINGS Ltd. | $670,920,163 | 1,317,110 | 1.11% | Shares |
| Capital Research Global Investors | $630,985,060 | 1,238,537 | 1.04% | Shares |
| VANGUARD FIDUCIARY TRUST CO | $605,114,681 | 1,187,757 | 1.00% | Shares |
| DIMENSIONAL FUND ADVISORS LP | $604,949,137 | 1,187,433 | 1.00% | Shares |
| TWO SIGMA ADVISERS, LP | $591,605,797 | 1,223,160 | 0.98% | Shares |
| GOLDMAN SACHS GROUP INC | $461,730,827 | 906,314 | 0.76% | Shares |
| UBS Group AG | $435,728,911 | 855,276 | 0.72% | Shares |
| BANK OF AMERICA CORP /DE/ | $399,174,318 | 783,524 | 0.66% | Shares |
| LPL Financial LLC | $390,096,957 | 765,707 | 0.65% | Shares |
| WELLINGTON MANAGEMENT GROUP LLP | $370,380,986 | 727,007 | 0.61% | Shares |
| FMR LLC | $353,085,566 | 693,058 | 0.58% | Shares |
| BlackRock, Inc. | $342,801,369 | 672,872 | 0.57% | Shares |
| National Pension Service | $331,322,216 | 650,340 | 0.55% | Shares |
| CITADEL ADVISORS LLC | $318,310,608 | 624,800 | 0.53% | Call option |
| Qube Research & Technologies Ltd | $317,171,455 | 622,564 | 0.52% | Shares |
| CANADA PENSION PLAN INVESTMENT BOARD | $303,835,830 | 596,388 | 0.50% | Shares |
| Holocene Advisors, LP | $290,622,476 | 570,452 | 0.48% | Shares |
| Mitsubishi UFJ Asset Management Co., Ltd. | $268,757,194 | 527,532 | 0.44% | Shares |
| Sumitomo Mitsui Trust Group, Inc. | $255,470,245 | 501,453 | 0.42% | Shares |
| PeakShares LLC | $254,730,000 | 500 | 0.42% | Shares |
| ENVESTNET ASSET MANAGEMENT INC | $253,875,910 | 498,324 | 0.42% | Shares |
| CITADEL ADVISORS LLC | $244,153,101 | 479,239 | 0.40% | Shares |
| JANE STREET GROUP, LLC | $239,955,660 | 471,000 | 0.40% | Put option |
| FIRST TRUST ADVISORS LP | $239,140,779 | 469,401 | 0.40% | Shares |
| Legal & General Group Plc | $226,734,664 | 445,049 | 0.38% | Shares |
| JANE STREET GROUP, LLC | $225,079,428 | 441,800 | 0.37% | Call option |
| Vanguard Global Advisers, LLC | $223,104,252 | 437,923 | 0.37% | Shares |
| VANGUARD ASSET MANAGEMENT, Ltd | $214,730,258 | 421,486 | 0.36% | Shares |
| California Public Employees Retirement System | $211,616,438 | 415,374 | 0.35% | Shares |
| HighTower Advisors, LLC | $210,162,901 | 412,521 | 0.35% | Shares |
| CALIFORNIA STATE TEACHERS RETIREMENT SYSTEM | $196,728,341 | 325,499 | 0.33% | Shares |
| Balyasny Asset Management L.P. | $189,318,902 | 371,607 | 0.31% | Shares |
| BNP PARIBAS FINANCIAL MARKETS | $184,152,978 | 361,467 | 0.30% | Shares |
| CAPTRUST FINANCIAL ADVISORS | $181,708,485 | 356,669 | 0.30% | Shares |
| RAYMOND JAMES FINANCIAL INC | $179,642,224 | 352,613 | 0.30% | Shares |
| RHUMBLINE ADVISERS | $178,182,080 | 349,747 | 0.29% | Shares |
| Allianz Asset Management GmbH | $174,500,749 | 342,521 | 0.29% | Shares |
| LAZARD ASSET MANAGEMENT LLC | $173,726,369 | 341,001 | 0.29% | Shares |
| ROYAL BANK OF CANADA | $161,984,000 | 317,952 | 0.27% | Shares |
| HSBC HOLDINGS PLC | $155,297,997 | 307,168 | 0.26% | Shares |
| RENAISSANCE TECHNOLOGIES LLC | $152,083,999 | 298,520 | 0.25% | Shares |
| CAPITOLIS LIQUID GLOBAL MARKETS LLC | $149,739,974 | 293,919 | 0.25% | Shares |
| MANUFACTURERS LIFE INSURANCE COMPANY, THE | $148,339,825 | 291,171 | 0.25% | Shares |
| D. E. Shaw & Co., Inc. | $146,402,501 | 287,368 | 0.24% | Shares |
| PNC Financial Services Group, Inc. | $145,884,380 | 286,351 | 0.24% | Shares |
| WEALTH ENHANCEMENT ADVISORY SERVICES, LLC | $141,491,602 | 297,372 | 0.23% | Shares |
| VICTORY CAPITAL MANAGEMENT INC | $138,624,575 | 272,101 | 0.23% | Shares |
| ALLIANCEBERNSTEIN L.P. | $138,434,321 | 229,048 | 0.23% | Shares |
| ARROWSTREET CAPITAL, LIMITED PARTNERSHIP | $136,696,779 | 268,317 | 0.23% | Shares |
| ROYAL LONDON ASSET MANAGEMENT LTD | $134,301,298 | 263,615 | 0.22% | Shares |
| Canoe Financial LP | $132,976,702 | 261,015 | 0.22% | Shares |
| CONFLUENCE INVESTMENT MANAGEMENT LLC | $131,294,479 | 257,713 | 0.22% | Shares |
| HOTCHKIS & WILEY CAPITAL MANAGEMENT LLC | $130,691,774 | 256,530 | 0.22% | Shares |
| BANK OF MONTREAL /CAN/ | $127,679,337 | 250,617 | 0.21% | Shares |
| Cetera Investment Advisers | $127,055,700 | 249,393 | 0.21% | Shares |
| AMERIPRISE FINANCIAL INC | $125,567,280 | 246,467 | 0.21% | Shares |
| PRINCIPAL FINANCIAL GROUP INC | $123,990,338 | 243,376 | 0.21% | Shares |
| JONES FINANCIAL COMPANIES LLLP | $117,954,041 | 232,468 | 0.20% | Shares |
| Mirae Asset Global Investments Co., Ltd. | $117,504,911 | 230,646 | 0.19% | Shares |
| CREDIT AGRICOLE S A | $116,308,190 | 228,297 | 0.19% | Shares |
| TRUIST FINANCIAL CORP | $115,610,396 | 226,927 | 0.19% | Shares |
| NEW YORK STATE COMMON RETIREMENT FUND | $113,362,492 | 222,515 | 0.19% | Shares |
| WOLVERINE TRADING, LLC | $112,220,638 | 228,100 | 0.19% | Call option |
| SUSQUEHANNA INTERNATIONAL GROUP, LLP | $111,700,124 | 219,252 | 0.18% | Shares |
| YACKTMAN ASSET MANAGEMENT LP | $110,226,256 | 216,359 | 0.18% | Shares |
| Focus Partners Wealth | $109,911,379 | 215,672 | 0.18% | Shares |
| Brandywine Global Investment Management, LLC | $108,884,758 | 225,122 | 0.18% | Shares |
| AMERICAN CENTURY COMPANIES INC | $102,138,578 | 200,484 | 0.17% | Shares |
| UniSuper Management Pty Ltd | $102,001,024 | 200,214 | 0.17% | Shares |
| HSBC HOLDINGS PLC | $98,790,332 | 195,400 | 0.16% | Put option |
| MORGAN STANLEY | $98,650,949 | 193,638 | 0.16% | Shares |
| BARCLAYS PLC | $96,257,884 | 188,941 | 0.16% | Shares |
| JACOBS LEVY EQUITY MANAGEMENT, INC | $95,526,807 | 187,506 | 0.16% | Shares |
| ING GROEP NV | $94,732,049 | 185,946 | 0.16% | Shares |
| COMMONWEALTH EQUITY SERVICES, LLC | $89,567,224 | 175,808 | 0.15% | Shares |
| STATE BOARD OF ADMINISTRATION OF FLORIDA RETIREMENT SYSTEM | $87,986,289 | 172,705 | 0.15% | Shares |
| Chevy Chase Trust Holdings, LLC | $85,911,769 | 168,633 | 0.14% | Shares |
| Connor, Clark & Lunn Investment Management Ltd. | $84,425,164 | 165,715 | 0.14% | Shares |
| Korea Investment CORP | $83,552,459 | 164,002 | 0.14% | Shares |
| Migdal Insurance & Financial Holdings Ltd. | $80,966,597 | 158,939 | 0.13% | Shares |
| BANK OF NOVA SCOTIA | $80,095,773 | 157,217 | 0.13% | Shares |
| UBS AM, a distinct business unit of UBS ASSET MANAGEMENT AMERICAS LLC | $79,936,621 | 132,260 | 0.13% | Shares |
| MACKENZIE FINANCIAL CORP | $78,980,565 | 155,028 | 0.13% | Shares |
| Focused Investors LLC | $75,349,134 | 147,900 | 0.12% | Shares |
| OSAIC HOLDINGS, INC. | $75,291,718 | 147,456 | 0.12% | Shares |
| Walleye Trading LLC | $72,088,590 | 141,500 | 0.12% | Call option |
| Mitsubishi UFJ Trust & Banking Corp | $70,829,714 | 139,029 | 0.12% | Shares |
| FIFTH THIRD BANCORP | $67,360,258 | 132,219 | 0.11% | Shares |
| ADAGE CAPITAL PARTNERS GP, L.L.C. | $67,143,262 | 131,793 | 0.11% | Shares |
| Defiance ETFs, LLC | $66,581,623 | 127,595 | 0.11% | Shares |
| Welch Group, LLC | $66,352,373 | 130,241 | 0.11% | Shares |
| VOLORIDGE INVESTMENT MANAGEMENT, LLC | $66,350,033 | 130,236 | 0.11% | Shares |
| WOODLEY FARRA MANION PORTFOLIO MANAGEMENT INC | $65,068,119 | 127,720 | 0.11% | Shares |
Company insiders 78 insiders · 13 officers · 8 directors
| Insider | Role | Last activity | Shares owned | Buys 12m | Sells 12m | Net 12m |
|---|---|---|---|---|---|---|
| Christopher E Kubasik | President & COO | Jan. 30, 2012 A | 69,151 | 0 | 0 | $0 |
| Stephanie C. Hill | Pres. Rotary & Mission Systems | June 11, 2026 G | 8,964 | 0 | 1 | $-6,660 |
| Richard H Edwards | Executive Vice President | Feb. 14, 2017 S | 652 | 0 | 0 | $0 |
| Sondra L Barbour | Executive Vice President | Aug. 3, 2016 M | 0 | 0 | 0 | $0 |
| Patrick M Dewar | Executive Vice President | Dec. 4, 2015 M | 0 | 0 | 0 | $0 |
| Christopher J Gregoire | Vice President & Controller | Feb. 3, 2014 M | 0 | 0 | 0 | $0 |
| Linda R Gooden | Executive Vice President | Jan. 28, 2013 A | 15,783 | 0 | 0 | $0 |
| Larry A Lawson | Executive Vice President | Jan. 24, 2013 A | 1,852 | 0 | 0 | $0 |
| Joanne M Maguire | Executive Vice President | Jan. 24, 2013 A | 34,938 | 0 | 0 | $0 |
| Ralph D Heath | Executive Vice President | Jan. 26, 2012 A | 42,594 | 0 | 0 | $0 |
| John C Mccarthy | VP & Treasurer | Jan. 28, 2011 M | 2,745 | 0 | 0 | $0 |
| James B Comey | Senior VP & General Counsel | June 15, 2010 S | 0 | 0 | 0 | $0 |
| Mark R Bostic | VP and Acting Controller & CAO | Feb. 1, 2010 A | 2,982 | 0 | 0 | $0 |
| David B Burritt | Director | June 30, 2026 A | 1,796 | 0 | 0 | $0 |
| Anne Stevens | Director | Jan. 30, 2017 A | 0 | 0 | 0 | $0 |
| Gwendolyn S King | Director | Feb. 1, 2016 A | 536 | 0 | 0 | $0 |
| Douglas H Mccorkindale | Director | April 23, 2015 M | 13,660 | 0 | 0 | $0 |
| E C Aldridge JR | Director | Jan. 31, 2011 A | — | 0 | 0 | $0 |
| James R Ukropina | Director | Feb. 1, 2010 A | — | 0 | 0 | $0 |
| Frank Savage | Director | Feb. 1, 2010 A | 1 | 0 | 0 | $0 |
| James M Schnieder | Director | Feb. 1, 2010 A | — | 0 | 0 | $0 |
| LOCKHEED MARTIN CORP | 10% owner | Oct. 30, 2024 P | 1,000 | 0 | 0 | $0 |
| John Donovan | — | Aug. 13, 2026 S | 0 | 0 | 0 | $0 |
| Robert M Lightfoot JR | — | Aug. 12, 2026 S | 2,015 | 0 | 1 | $-117,624 |
| Frank A St John | — | July 31, 2026 I | 0 | 0 | 3 | $-3,826,160 |
| Vicki A. Hollub | — | April 1, 2026 M | 416 | 0 | 0 | $0 |
| Joseph F Dunford Jr | — | March 31, 2026 A | — | 0 | 0 | $0 |
| Timothy S Cahill | — | March 11, 2026 S | 9,591 | 0 | 0 | $0 |
| Gregory M Ulmer | — | Feb. 27, 2026 S | 5,661 | 0 | 0 | $0 |
| Kevin J. O'Connor | — | Feb. 26, 2026 M | 2,719 | 0 | 0 | $0 |
| Harry Edward Paul III | — | Feb. 25, 2026 A | 2,878 | 0 | 0 | $0 |
| Evan T Scott | — | Feb. 25, 2026 A | 945 | 0 | 0 | $0 |
| James D Taiclet JR | — | Feb. 25, 2026 A | 43,963 | 0 | 0 | $0 |
| Maria Ricciardone Lee | — | Feb. 22, 2026 M | 1,047 | 0 | 0 | $0 |
| John C Aquilino | — | Feb. 13, 2026 A | — | 0 | 0 | $0 |
| Heather A Wilson | — | Feb. 13, 2026 A | — | 0 | 0 | $0 |
| Patricia E Yarrington | — | Feb. 13, 2026 A | — | 0 | 0 | $0 |
| Debra L Reed | — | Feb. 13, 2026 A | — | 0 | 0 | $0 |
| Thomas J Falk | — | Feb. 13, 2026 A | 5,250 | 0 | 0 | $0 |
| Jesus Malave JR | — | Feb. 26, 2025 A | 15,035 | 0 | 0 | $0 |
| Bruce A Carlson | — | Feb. 14, 2025 A | — | 0 | 0 | $0 |
| Maryanne Lavan | — | Dec. 6, 2024 M | 0 | 0 | 0 | $0 |
| James O Ellis Jr | — | April 1, 2024 M | 200 | 0 | 0 | $0 |
| Ilene S Gordon | — | April 1, 2024 M | 1,770 | 0 | 0 | $0 |
| Jeh C. Johnson | — | Feb. 15, 2024 A | — | 0 | 0 | $0 |
| Daniel F Akerson | — | Feb. 15, 2024 A | 3 | 0 | 0 | $0 |
| Vincent R. Stewart | — | Aug. 1, 2022 A | — | 0 | 0 | $0 |
| Scott T Greene | — | May 3, 2022 G | 6,644 | 0 | 0 | $0 |
| John W Mollard | — | March 1, 2022 S | 2,967 | 0 | 0 | $0 |
| Brian P Colan | — | Feb. 28, 2022 S | 0 | 0 | 0 | $0 |
Insiders from SEC Form 3/4/5 filings; net = open-market P/S only
Activists & 5%+ owners 1 position
Investors who filed SEC Schedule 13D — beneficial ownership above 5% with an intent to influence the issuer (activist stakes, board campaigns, M&A). Each row shows the most recent known state of that filer's position.
| Filer | Filed | Stake | Status | Purpose | Filing |
|---|---|---|---|---|---|
| Lockheed Martin Corporation, Astrolink International LLC ×8 filings | Nov. 1, 2024 | — | Initial filing | M&A / sale | SEC |
Purpose is an automated classification of the filer's own stated purpose (SEC Item 4) — not investment advice. "—" means no clear purpose was stated or the text could not be classified.
ETF ownership Held by 247 ETFs
Weight reflects direct equity holdings (N-PORT) only; leveraged or derivative-based funds may hold additional swap exposure not shown.
| Fund | Weight | Units | As of | Source |
|---|---|---|---|---|
| LMTL · Direxion Shares ETF Trust | 15.01% | 2,113 NS | April 30, 2026 | N-PORT |
| SHLD · Global X Funds | 8.42% | 1,267,716 NS | May 31, 2026 | N-PORT |
| PPA · Invesco Exchange-Traded Fund Trust | 6.53% | 944,917 SH | Aug. 21, 2026 | Daily |
| FOWF · Pacer Funds Trust | 6.37% | 1,822 NS | April 30, 2026 | N-PORT |
| MISL · First Trust Exchange-Traded Fund | 6.11% | 96,137 NS | June 30, 2026 | N-PORT |
| ITA · iShares Trust | 4.64% | 1,159,675 SH | Aug. 21, 2026 | Daily |
| EGGS · Tidal Trust III | 4.08% | 4,321 NS | May 31, 2026 | N-PORT |
| ICAP · Series Portfolios Trust | 3.85% | 7,887 NS | May 31, 2026 | N-PORT |
| CCOR · Listed Funds Trust | 2.79% | 1,487 NS | April 30, 2026 | N-PORT |
| DFEN · Direxion Shares ETF Trust | 2.77% | 19,562 NS | April 30, 2026 | N-PORT |
| SCHD · SCHWAB STRATEGIC TRUST | 2.70% | 4,835,703 NS | May 31, 2026 | N-PORT |
| KEAT · EA Series Trust | 2.47% | 5,720 NS | April 30, 2026 | N-PORT |
| VALQ · AMERICAN CENTURY ETF TRUST | 2.19% | 14,330 NS | May 31, 2026 | N-PORT |
| GEND · Spinnaker ETF Series | 2.12% | 183 NS | April 30, 2026 | N-PORT |
| ESN · Northern Lights Fund Trust II | 2.10% | 11,045 NS | May 31, 2026 | N-PORT |
| FDIV · EA Series Trust | 2.03% | 2,843 NS | April 30, 2026 | N-PORT |
| QDIV · Global X Funds | 2.03% | 1,252 NS | May 31, 2026 | N-PORT |
| TBG · EA Series Trust | 1.95% | 8,677 NS | April 30, 2026 | N-PORT |
| YOKE · EA Series Trust | 1.92% | 8,338 NS | April 30, 2026 | N-PORT |
| FLAG · Global X Funds | 1.92% | 61 NS | April 30, 2026 | N-PORT |
| BMVP · Invesco Exchange-Traded Fund Trust | 1.91% | 3,519 SH | Aug. 21, 2026 | Daily |
| EMOT · First Trust Exchange-Traded Fund VI | 1.89% | 99 NS | June 30, 2026 | N-PORT |
| NUKZ · EXCHANGE TRADED CONCEPTS TRUST | 1.84% | 30,893 NS | May 31, 2026 | N-PORT |
| PPI · INVESTMENT MANAGERS SERIES TRUST II | 1.82% | 5,519 NS | June 30, 2026 | N-PORT |
| QUSA · Tidal Trust III | 1.77% | 604 NS | April 30, 2026 | N-PORT |
| RFDA · ALPS ETF Trust | 1.75% | 2,891 NS | May 31, 2026 | N-PORT |
| ABFL · Abacus FCF ETF Trust | 1.74% | 16,741 NS | April 30, 2026 | N-PORT |
| FTCS · First Trust Exchange-Traded Fund | 1.73% | 260,108 NS | June 30, 2026 | N-PORT |
| UFO · Procure ETF Trust II | 1.65% | 23,857 NS | April 30, 2026 | N-PORT |
| MADE · iShares Trust | 1.62% | 1,731 SH | Aug. 21, 2026 | Daily |
| GINX · RBB Fund, Inc. | 1.60% | 2,874 NS | May 31, 2026 | N-PORT |
| ARMY · Tema ETF Trust | 1.58% | 144 NS | May 31, 2026 | N-PORT |
| SDOG · ALPS ETF Trust | 1.55% | 40,417 NS | May 31, 2026 | N-PORT |
| FIDU · FIDELITY COVINGTON TRUST | 1.54% | 61,765 NS | April 30, 2026 | N-PORT |
| DRES · GMO ETF Trust | 1.49% | 1,018 NS | May 31, 2026 | N-PORT |
| VIS · VANGUARD WORLD FUND | 1.41% | 251,874 SH | Aug. 19, 2026 | Daily |
| IYJ · iShares Trust | 1.39% | 46,401 SH | Aug. 21, 2026 | Daily |
| DUSL · Direxion Shares ETF Trust | 1.36% | 1,421 NS | April 30, 2026 | N-PORT |
| AUSF · Global X Funds | 1.34% | 21,431 NS | May 31, 2026 | N-PORT |
| EQIN · Columbia ETF Trust I | 1.30% | 6,934 NS | April 30, 2026 | N-PORT |
| HDV · iShares Trust | 1.29% | 345,416 SH | Aug. 21, 2026 | Daily |
| RSPN · Invesco Exchange-Traded Fund Trust | 1.25% | 23,099 SH | Aug. 21, 2026 | Daily |
| UXI · ProShares Trust | 1.25% | 668 NS | May 31, 2026 | N-PORT |
| WBIL · Absolute Shares Trust | 1.23% | 734 NS | June 30, 2026 | N-PORT |
| DIVD · EA Series Trust | 1.20% | 405 NS | April 30, 2026 | N-PORT |
| DDIV · First Trust Exchange-Traded Fund VI | 1.18% | 1,570 NS | June 30, 2026 | N-PORT |
| LGDX · Tidal Trust III | 1.16% | 3,094 NS | April 30, 2026 | N-PORT |
| EXI · iShares Trust | 1.13% | 28,758 SH | Aug. 21, 2026 | Daily |
| SPHQ · Invesco Exchange-Traded Fund Trust | 1.07% | 356,213 SH | Aug. 21, 2026 | Daily |
| SHRY · First Trust Exchange-Traded Fund VI | 1.06% | 311 NS | June 30, 2026 | N-PORT |