
COF Capital One Financial Corporation Common Stock
O Capital One Financial Corporation Common Stock Przegląd firmy z Wikipedii
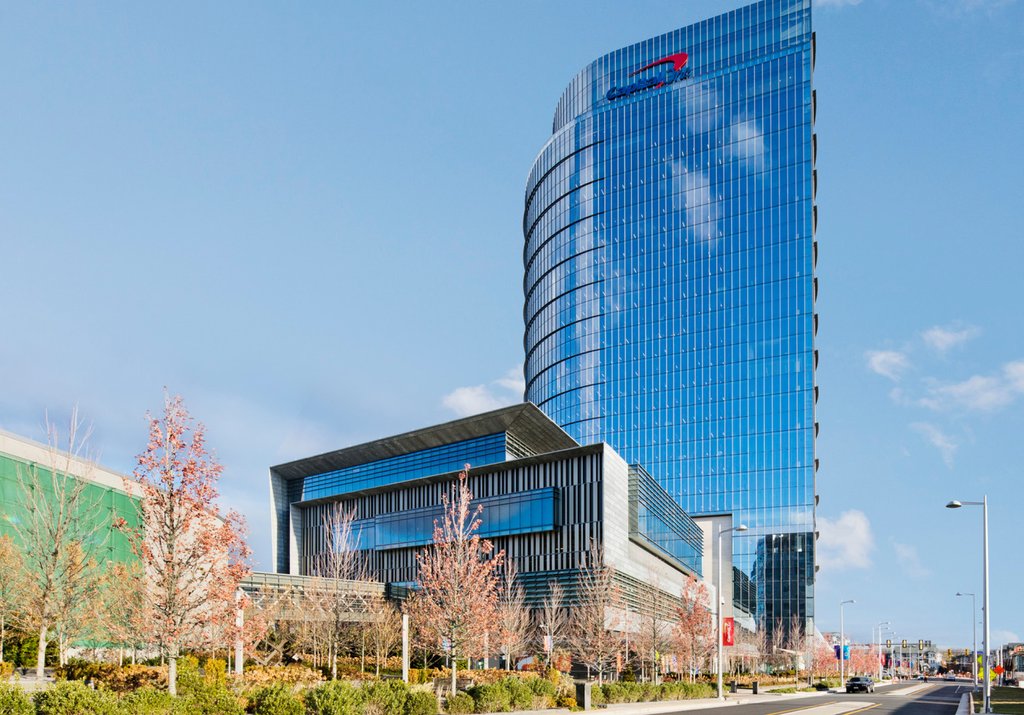
Capital One Financial Corporation is an American bank holding company headquartered in Tysons, Virginia, with operations in the United States, Canada, and the United Kingdom. It is one of the largest banks in the United States, one of the largest car finance companies in the United States, and is the largest issuer of credit cards in the United States. It owns the Discover Card, Diners Club, and Pulse payment networks. The company's three business segments are credit cards, consumer banking, and commercial banking. It has approximately 750 bank branches, including over 60 café style locations, and 7,000 ATMs in the United States. The company's corporate headquarters are in the Capital One Tower and its European headquarters are in Trent House, Nottingham.
Czytaj więcej
Capital One Financial Corporation is an American bank holding company headquartered in Tysons, Virginia, with operations in the United States, Canada, and the United Kingdom. It is one of the largest banks in the United States, one of the largest car finance companies in the United States, and is the largest issuer of credit cards in the United States. It owns the Discover Card, Diners Club, and Pulse payment networks. The company's three business segments are credit cards, consumer banking, and commercial banking. It has approximately 750 bank branches, including over 60 café style locations, and 7,000 ATMs in the United States. The company's corporate headquarters are in the Capital One Tower and its European headquarters are in Trent House, Nottingham.
The company is ranked 82nd on the Fortune 500. The company helped pioneer the mass marketing of credit cards in the 1990s.
History
1994–2004
Richard Fairbank and Nigel Morris developed the idea of using information technology and statistical analysis to create customized credit card offers for different segments of customers in 1987. At the time, most credit cards would offer the same terms—interest rate and annual fee—to almost everyone, regardless of the financial risks of each customer. However, Fairbank and Morris' idea was to drop the fee and target various credit card terms to specific customers. They consulted with Oracle Corporation on how to compile the demographics and other statistics that would help them sort out and identify those customer market segments.
They then started soliciting banks regarding using their approach, indicating that they anticipated large profits based on the large numbers of customers they projected to enroll. They convinced Richmond, Virginia-based Signet Bank to start a credit card division called Signet Financial in 1988 that would utilize their approach. As part of the deal, they became employees of Signet. In 1991, Fairbank and Morris were successful with a mass mailing that offered to transfer existing credit card balances from other banks' credit cards for the opportunity of a lower interest rate with Signet.
In July 1994, Signet Financial announced the corporate spin-off of Capital One, at first naming it OakStone Financial with Fairbank as CEO and Morris as COO. After the initial public offering in October 1994, the new company was renamed Capital One. The spin-off was completed in February 1995.
At that time, Capital One was a monoline bank, meaning that all of its revenue came from a single product, in this case, credit cards. This strategy is risky in that it can lead to losses during bad times. Capital One attributed its relative success as a monoline to its use of data collection to build demographic profiles, allowing it to target personalized offers of credit directly to consumers.
1996–2005
In 1996, Capital One moved from relying on teaser rates to generate new clients to adopting more innovative techniques that would attract more customers to their business model. At the time, it was losing customers to competitors who offered higher ceilings on loan balances and no-annual-fee accounts. The company came up with co-branded, secured, and joint account credit cards. In mid-1996, Capital One received approval from the federal government to set up Capital One FSB. This meant that the company could now retain and lend out deposits on secured cards and even issue automobile installment loans.
In 1996, Capital One expanded to the United Kingdom and Canada.
In July 1998, Capital One acquired auto financing company Summit Acceptance Corporation.
In 1999, CEO Richard Fairbank announced moves to use Capital One's experience with collecting consumer data to offer loans, insurance, and phone service.
In October 2001, PeopleFirst Finance was acquired by Capital One. The companies were combined and re-branded as Capital One Auto Finance Corporation in 2003.
In late 2002, Capital One and the United States Postal Service proposed a negotiated services agreement (NSA) for bulk discounts in mailing services. The resulting three-year agreement was extended in 2006. In June 2008, however, Capital One filed a complaint with the USPS regarding the terms of the next agreement, citing the terms of the NSA of Capital One's competitor, Bank of America. Capital One subsequently withdrew its complaint to the Postal Regulatory Commission following a settlement with the USPS.
Automobile loan financer Onyx Acceptance Corporation was acquired by Capital One in January 2005.
2005–present
In 2005, Capital One acquired New Orleans, Louisiana-based Hibernia National Bank for $4.9 billion in cash and stock, becoming the first monoline credit card issuer to buy a bank. This reduced its dependency on the credit-card business.
Capital One acquired Melville, New York-based North Fork Bank and its subsidiary, GreenPoint Mortgage, for $13.2 billion in cash and stock in 2006. In August 2007, during the subprime mortgage crisis, Capital One closed GreenPoint Mortgage, due in part to investor pressures, cutting 1,900 jobs and leading to $860 million in charges.
In August 2007, Capital One agreed to acquire NetSpend for $700 million. In November 2007, the transaction was modified; Capital One instead acquired just a minority interest in NetSpend.
In 2008, Capital One received an investment of $3.56 billion from the United States Treasury as a result of the Troubled Asset Relief Program. In June 2009, Capital One repurchased the stock the company issued to the U.S. Treasury for $3.67 billion, resulting in a profit of over $100 million to the U.S. Treasury.
In 2008, Capital One debuted its blue and red "swoosh" logo, and began a $13 billion marketing campaign. The similarity of the logo to that of Credit One Bank, which adopted a similar logo in 2006, caused confusion among consumers, with many not realizing they were separate companies. In February 2009, Capital One acquired Chevy Chase Bank for $520 million in cash and stock. In January 2011, Capital One acquired Canada-based Hudson's Bay Company's private credit card portfolio from GE Financial.
In April 2011, Capital One signed a deal with Kohl's to handle Kohl's private label credit card program that was previously serviced by Chase Bank for a seven-year period for an undisclosed amount. The contract was extended several times.
In June 2011, ING Group announced the sale of its ING Direct division to Capital One for $9 billion in cash and stock. The transaction was scrutinized by Barney Frank, Thomas M. Hoenig, and others on the basis of the bank becoming too big to fail, but nevertheless, the acquisition received regulatory approval and was completed in February 2012. ING Direct was rebranded as Capital One 360 in November 2012.
In August 2011, Capital One acquired the U.S. credit card operations of HSBC. Capital One paid $31.3 billion in exchange for $28.2 billion in loans and $600 million in other assets. The acquisition was completed in May 2012. The acquisition also included private issued credit cards for such companies as Saks Fifth Avenue, Neiman Marcus, and Lord & Taylor that were previously handled by HSBC.
In February 2012, along with several other banks, Capital One announced support for the Isis Mobile Wallet payment system. However, in September 2013, Capital One dropped support for the venture.
In 2012, Capital One closed 41 branch locations.
In February 2014, Capital One amended its terms of use to allow it to "contact you in any manner we choose", including a "personal visit . . . at your home and at your place of employment". It also asserted its right to "modify or suppress caller ID and similar services and identify ourselves on these services in any manner we choose". The company stated that it would not actually make personal visits to customers except "As a last resort, . . . if it becomes necessary to repossess [a] sports vehicle". Capital One also attributed its assertion of a right to "spoof" as necessary because "sometimes the number is 'displayed differently' by 'some local phone exchanges,' something that is 'beyond our control'".
In February 2014, Capital One acquired 25% of ClearXchange, a peer-to-peer transaction money transfer service. ClearXchange was sold to Early Warning in 2016. In October 2014, Capital One acquired Adaptive Path, a San Francisco-based user experience and digital design consultancy. In January 2015, Capital One acquired Level Money, a budgeting app for consumers. In July 2015, the company acquired Monsoon, a design studio, development shop, marketing house and strategic consultancy. In 2015, Capital One acquired General Electric's Healthcare Financial Services unit, which included $8.5 billion in loans made to businesses in the healthcare industry, for $9 billion.
In October 2016, Capital One acquired Paribus, a price tracking service, for an undisclosed amount. The company exited the mortgage origination business in November 2017 due to competition, laying off 1,100 employees.
In January 2018, Capital One sold its online brokerage with more than 1 million brokerage accounts to E-Trade for $170 million. In May 2018, the company acquired Confyrm, a digital identity and fraud alert service. In July 2018, Capital One sold its full-service investment advisory and brokerage division to Woodbury Financial. In November 2018, Capital One acquired Wikibuy, a shopping comparison app and browser extension from an Austin, Texas start-up business and renamed it Capital One Shopping. In June 2019, Capital One acquired BlueTarp Financial, a business-to-business credit services provider. In July 2019, Capital One signed a deal with Walmart to handle Walmart's private label and co-branded credit card programs that was previously serviced by Synchrony Financial. Walmart terminated the deal in April 2024 after customer service failures by Capital One. In August 2019, Capital One acquired KippsDeSanto, an investment bank focused on government contractors.
In October 2021, Capital One acquired the healthcare investment bank of TripleTree Holdings.
In November 2021, the company introduced Venture X, an incentive program credit card, with a $395 annual fee.
In March 2022, Capital One announced a partnership with Vivid Seats to launch Capital One Entertainment, a rewards programs for cardholders.
In February 2024, Capital One agreed to acquire Discover Financial in an all-stock deal worth $35.3 billion, making it the largest credit card issuer in the U.S. The deal was approved by U.S. banking regulators in April 2025 after an investigation by the Attorney General of New York and a proposed consumer class action lawsuit by customers on anti-trust concerns. The acquisition was completed in May 2025.
In November 2025, Capital One acquired Hopper Travel Software, which powered Capital One Travel. In March 2026, Capital One announced it would lay off over 1,100 employees from the former Discover headquarters. In April 2026, the company acquired Brex for $5.15 billion. Brex had around 1,100 employees.
Television advertisements
Between 2010 and 2013, Alec Baldwin was the spokesperson for Capital One's television ad campaigns. Following his 2013 confrontation with a videographer reported by TMZ, his contract was not renewed, and he was succeeded in the campaign by Jennifer Garner.
In 2012, Capital One released an advert featuring British power metal band DragonForce. The advert showed Herman Li and Sam Totman playing guitar on an asteroid while using Capital One's mobile app.
Sports sponsorships
From 2001 to 2014, Capital One was the principal sponsor of the college football Florida Citrus Bowl, which was called the Capital One Bowl from 2003 to 2014. It sponsored a mascot challenge every year, announcing the winner on the day of the Capital One Bowl. The name of the bowl game was changed in 2015 to the Buffalo Wild Wings Citrus Bowl. Capital One is the title sponsor of the Orange Bowl since 2015. Capital One Venture X is the presenting sponsor of the Rose Bowl Game since 2022.
Capital One has been a major sponsor of the NCAA since 2010. As of 2013, it paid an estimated $35 million annually in exchange for advertising and access to consumer data. Capital One also sponsored the EFL Cup, an English soccer knockout tournament, from 2012 to 2016. The company sponsored English soccer clubs Nottingham Forest from 2003 to 2009 and Sheffield United from 2006 to 2008. From 2009 to 2022, the company owned the naming rights to the field at SECU Stadium (formerly Byrd Stadium), inherited in the bank's acquisition of Chevy Chase Bank.
In August 2017, the company agreed to pay $100 million for a 10-year deal for the naming rights of the Capital One Arena in Washington D.C.
To celebrate the Washington Capitals' appearance in the 2018 Stanley Cup Final, the firm temporarily changed its logo by replacing the word "Capital" with the Capitals' titular logo, without the "s" plural.
In March 2022, Capital One agreed to pay $125 million over 5 years to become the "official bank and credit card partner" of Major League Baseball and a presenting sponsor for the World Series.
Legal actions
Fines for misleading customers to pay extra for services
In July 2012, Capital One was fined by the Office of the Comptroller of the Currency and the Consumer Financial Protection Bureau for misleading millions of its customers, for example by requiring customers to pay extra for payment protection or credit monitoring when they took out a card. The company agreed to pay $210 million to settle the legal action and to refund two million customers. This was the CFPB's first public enforcement action.
Automated dialing to customers' phones
In August 2014, Capital One and three collection agencies entered into an agreement to pay $75.5 million to end a consolidated class action lawsuit pending in the United States District Court for the Northern District of Illinois alleging that the companies used an automated dialer to call customers' cellphones without consent, which is a violation of the Telephone Consumer Protection Act of 1991. This legal action involved informational telephone calls, which are not subject to the "prior express written consent" requirements in place for telemarketing calls since October 2013.
July 2019 data breach
In July 2019, in one of the largest data breaches of personal information, Capital One found unauthorized access had occurred by an individual who had breached the account and identity security of 106 million people in the United States and Canada.
The FBI arrested Paige Thompson, who had previously worked as a software engineer for Amazon Web Services, a cloud computing hosting company used by Capital One. Thompson had accessed about 140,000 Social Security numbers, a million Canadian Social insurance numbers; 80,000 bank account numbers, and an unknown number of names and addresses of customers. Capital One began offering free credit report monitoring services and identity theft protection to those affected by the breach. It was ultimately determined there was no evidence the data was shared by Thompson.
Amazon stated that the security vulnerability used to access the Capital One records could have been discovered by anyone, the information that facilitated her activity was not gained from work at Amazon, and that she gained access via "a misconfiguration of the (Capital One-designed) web application and not the underlying (Amazon-designed) cloud-based infrastructure".
In 2022, Thompson was convicted of five felonies and two misdemeanors. She was sentenced to time served and five years of probation.
Capital One was alerted to the breach on July 17, 2019, 12 days before it was publicly acknowledged. Several Capital One customers stated that the first time they heard about the hack was through the media and the bank did not disclose the breach or explain its implications to affected customers. On social media and in the mainstream press, Capital One's contradictory July 2019 press statement was mocked for saying "No bank account numbers or Social Security numbers were compromised," but then listing hundreds of thousands of bank account numbers and Social Security numbers that were compromised.
In August 2020, the Federal Reserve Board of Governors announced a cease and desist order against Capital One resulting from the data breach. The order mandated, among other things, significant improvements in Capital One's governance, risk management and compliance (GRC) practices. The Federal Reserve ended the enforcement action in 2023.
Lawsuits were filed against Capital One and its employees in federal and circuit courts.
Understatement of losses
The U.S. Securities and Exchange Commission alleged that Capital One understated auto loan losses during the 2008 financial crisis. In 2013, Capital One paid $3.5 million to settle the case, but was not required to directly address the allegations of wrongdoing.
Bank fraud, money laundering, and possible racketeering
In 2018, Capital One was fined $100 million by the Office of the Comptroller of the Currency for failure to monitor, detect, and prevent money laundering. The bank allegedly failed to file suspicious activity reports, had deficiencies in its risk assessment, remote deposit capture, and generally had weaknesses that compromised national bank security controls. The bank was the subject of a larger investigation that alleged funds were siphoned out of US jurisdiction to safe havens.
In January 2021, Capital One was fined $390 million by FINCEN for anti-money laundering control failure concerning a now-defunct small portfolio of check-cashing businesses that Capital One acquired around 2008 and sold in 2014. Capital One later admitted that it failed to file thousands of suspicious activity reports and lapsed on filing currency transaction reports on around 50,000 reportable cash transactions valued around $16 billion.
Alleged misleading interest rates on savings accounts
In July 2023, a lawsuit claimed that, since February 2013, the company unfairly began offering a savings account with higher yield but didn’t tell legacy customers.
In January 2025, the Consumer Financial Protection Bureau sued Capital One for cheating savings account holders out of $2 billion by "deceptive, abusive and illegal" practices which obscured the difference between the high-interest "360 Performance Savings" accounts vs. low-interest "360 Savings" accounts; however, the following month, after Donald Trump became president of the United States, the suit was dropped.
The State of New York filed a similar lawsuit against Capital One in May 2025 on behalf of depositors promised "one of the country's highest interest rates" on their "360 Savings" accounts; however, they were only paid an annual interest rate of 0.30%; the higher rates were paid on the similarly-named "360 Performance Savings" accounts. The company agreed to a $425 million settlement, which was approved by a judge in April 2026.
Źródło: Wikipedia (Angielski), CC BY-SA 4.0 · Zobacz w Wikipedii ↗
COF Migawka akcji Cena, kapitalizacja rynkowa, P/E, EPS, ROE, zadłużenie/kapitał własny, zakres 52-tygodniowy
COF Wykres ceny akcji Dzienny OHLCV ze wskaźnikami technicznymi — przesuwaj, powiększaj i dostosowuj widok
Wyniki 10-letnie Trendy przychodów, zysku netto, marż i EPS
Wycena Wskaźniki P/E, P/S, P/B, EV/EBITDA — czy akcje są drogie, czy tanie?
Rentowność Marże brutto, operacyjne i netto; ROE, ROA, ROIC
Zdrowie finansowe Dług, płynność, wypłacalność — siła bilansu
Rozwój Wzrost przychodów, EPS i zysku netto: r/r, CAGR 3-letni, CAGR 5-letni
Efektywność kapitałowa Rotacja aktywów, rotacja zapasów, rotacja należności
Dywidendy Stopa dywidendy, wskaźnik wypłaty, historia dywidend, 5-letni CAGR
| Data ex-dywidendy | Kwota |
|---|---|
| 17 sierpnia 2026 | $0,8000 |
| 19 maja 2026 | $0,8000 |
| 19 lutego 2026 | $0,8000 |
| 17 listopada 2025 | $0,8000 |
| 15 sierpnia 2025 | $0,6000 |
| 23 maja 2025 | $0,6000 |
| 18 lutego 2025 | $0,6000 |
| 14 listopada 2024 | $0,6000 |
| 12 sierpnia 2024 | $0,6000 |
| 10 maja 2024 | $0,6000 |
| 9 lutego 2024 | $0,6000 |
| 10 listopada 2023 | $0,6000 |
| 4 sierpnia 2023 | $0,6000 |
| 12 maja 2023 | $0,6000 |
| 3 lutego 2023 | $0,6000 |
| 10 listopada 2022 | $0,6000 |
| 5 sierpnia 2022 | $0,6000 |
| 13 maja 2022 | $0,6000 |
| 11 lutego 2022 | $0,6000 |
| 12 listopada 2021 | $0,6000 |
COF Konsensus analityków Bycze i niedźwiedzie opinie analityków, 12-miesięczny cel cenowy, potencjał wzrostu
- Mocne kupno 8 27,6%
- Kup 16 55,2%
- Trzymaj 5 17,2%
- Sprzedaj 0 0,0%
- Mocna sprzedaż 0 0,0%
12-miesięczny cel cenowy
22 analityków · 2026-08-23Historia zysków EPS faktyczny vs szacowany, zaskoczenie %, wskaźnik trafień, data następnych wyników
| Okres | EPS Actual | EPS Szacowany | Niespodzianka |
|---|---|---|---|
| 30 czerwca 2026 | $5.81 | $4.80 | 1.0% |
| 31 marca 2026 | $4.42 | $4.60 | -0.18% |
| 31 grudnia 2025 | $3.86 | $4.16 | -0.29% |
| 30 września 2025 | $5.95 | $4.41 | 1.5% |
| 30 czerwca 2025 | $5.48 | $3.75 | 1.7% |
| 31 marca 2025 | $4.06 | $3.73 | 0.33% |
Porównanie z porównywalnymi firmami (podbranża GICS) Kluczowe metryki w porównaniu do konkurentów z sektora
| Ticker | Kapitalizacja Rynkowa | P/E | Przychody r/r | Marża Netto | ROE | Marża brutto |
|---|---|---|---|---|---|---|
| COF | $151.50B | 60.1 | 36.6% | 4.6% | 2.2% | — |
| AXP | $253.79B | 24.1 | 6.4% | 26.2% | 32.9% | — |
| SYF | $28.95B | 9.0 | -2.8% | 18.7% | 21.1% | — |
| SOFI | $33.26B | 67.1 | 23.1% | 77.7% | 5.5% | — |
| ALLY | $13.97B | 19.1 | -3.3% | 10.8% | 5.7% | — |
| FCFS | $7.01B | 21.5 | 8.0% | 9.0% | 15.3% | 50.3% |
| FIGR | $0 | 92.8 | 48.7% | 26.4% | 16.9% | — |
| OMF | $7.92B | 10.3 | 8.9% | 16.0% | 23.3% | — |
| CACC | $4.74B | 12.2 | 7.2% | 18.3% | 27.5% | — |
| ENVA | $3.89B | 13.6 | 18.6% | 9.8% | 24.3% | 58.1% |
| SLM | $5.39B | 7.8 | 7.3% | 37.5% | 30.9% | — |
Pełne podstawowe wskaźniki Wszystkie wskaźniki roczne — rachunek zysków i strat, bilans, przepływy pieniężne
Rachunek zysków i strat 10
| Wskaźnik | Trend | 2025 | 2024 | 2023 | 2022 | 2021 | 2020 | 2019 | 2018 | 2017 | 2016 | 2015 | 2014 |
|---|---|---|---|---|---|---|---|---|---|---|---|---|---|
| Revenue | $53.43B | $39.11B | $36.79B | $34.25B | $30.43B | $28.52B | $28.59B | $28.08B | $27.24B | $25.50B | $23.41B | $22.29B | |
| Interest Expense | · | · | $12.70B | $4.12B | $1.60B | $3.12B | $5.17B | $4.30B | $2.76B | $2.02B | $1.62B | $1.58B | |
| Interest Income | $58.70B | $46.03B | $41.94B | $31.24B | $25.77B | $26.03B | $28.51B | $27.18B | $25.22B | $22.89B | $20.46B | $19.40B | |
| Pretax Income | $2.28B | $5.91B | $6.04B | $9.24B | $15.81B | $3.20B | $6.87B | $7.32B | $5.49B | $5.48B | $5.88B | $6.57B | |
| Income Tax | $193M | $1.16B | $1.16B | $1.88B | $3.42B | $486M | $1.34B | $1.29B | $3.38B | $1.71B | $1.87B | $2.15B | |
| Net Income | $2.45B | $4.75B | $4.89B | $7.36B | $12.39B | $2.71B | $5.55B | $6.01B | $1.98B | $3.75B | $4.05B | $4.43B | |
| EPS (Basic) | $4.03 | $11.61 | $11.98 | $17.98 | $27.04 | $5.19 | $11.10 | $11.90 | $3.52 | $6.96 | $7.15 | $7.71 | |
| EPS (Diluted) | $4.03 | $11.59 | $11.95 | $17.91 | $26.94 | $5.18 | $11.05 | $11.82 | $3.49 | $6.89 | $7.07 | $7.59 | |
| Shares (Basic) | 540,700,000 | 382,700,000 | 382,400,000 | 391,800,000 | 442,500,000 | 457,800,000 | 467,600,000 | 479,900,000 | 484,200,000 | 504,900,000 | 541,800,000 | 563,100,000 | |
| Shares (Diluted) | 541,300,000 | 383,600,000 | 383,400,000 | 393,200,000 | 444,200,000 | 458,900,000 | 469,900,000 | 483,100,000 | 488,600,000 | 509,800,000 | 548,000,000 | 571,900,000 |
Bilans 18
| Wskaźnik | Trend | 2025 | 2024 | 2023 | 2022 | 2021 | 2020 | 2019 | 2018 | 2017 | 2016 | 2015 | 2014 |
|---|---|---|---|---|---|---|---|---|---|---|---|---|---|
| PP&E (Net) | $5.60B | $4.51B | $4.38B | $4.35B | $4.21B | $4.29B | $4.38B | $4.19B | $4.03B | $3.67B | $3.58B | $3.69B | |
| PP&E (Gross) | $12.20B | $10.11B | $9.56B | $9.36B | $8.74B | $8.99B | $9.19B | $8.73B | $8.26B | $7.49B | $7.00B | $6.88B | |
| Accum. Depreciation | $6.60B | $5.60B | $5.18B | $5.00B | $4.53B | $4.71B | $4.81B | $4.54B | $4.23B | $3.81B | $3.42B | $3.20B | |
| Goodwill | $28.51B | $15.06B | $15.06B | $14.78B | $14.78B | $14.65B | $14.65B | $14.54B | $14.53B | $14.52B | $14.48B | $13.98B | |
| Intangibles | $16.58B | $233M | $310M | $159M | $111M | $90M | $174M | $254M | $421M | $665M | $1.04B | $1.32B | |
| Total Assets | $669.01B | $490.14B | $478.46B | $455.25B | $432.38B | $421.60B | $390.37B | $372.54B | $365.69B | $357.03B | $334.05B | $308.17B | |
| Short-term Debt | $1.09B | $562M | $538M | $883M | $820M | $668M | $7.31B | $9.40B | $576M | $992M | $981M | $17.08B | |
| Total Liabilities | $555.39B | $429.36B | $420.38B | $402.67B | $371.35B | $361.40B | $332.35B | $320.87B | $316.96B | $309.52B | $286.76B | $263.11B | |
| Long-term Debt | · | · | · | · | · | · | · | · | · | · | · | $31.38B | |
| Total Debt | $1.09B | $562M | $538M | $883M | $820M | $668M | $7.31B | $9.40B | $576M | · | $981M | $17.08B | |
| Common Stock | $7M | $7M | $7M | $7M | $7M | $7M | $7M | $7M | $7M | $7M | $6M | $6M | |
| Paid-in Capital | $64.03B | $36.43B | $35.54B | $34.73B | $34.11B | $33.48B | $32.98B | $32.04B | $31.66B | $31.16B | $29.66B | $27.87B | |
| Retained Earnings | $65.19B | $64.50B | $60.95B | $57.18B | $51.01B | $40.09B | $40.34B | $35.88B | $30.70B | $29.77B | $27.05B | $23.97B | |
| Treasury Stock | $10.15B | $30.87B | $30.14B | $29.42B | $24.47B | $16.86B | $16.47B | $14.99B | $12.71B | $12.47B | $8.81B | $6.37B | |
| AOCI | $-5.47B | $-9.29B | $-8.27B | $-9.92B | $374M | $3.49B | $1.16B | $-1.26B | $-926M | $-949M | $-616M | $-430M | |
| Stockholders' Equity | $113.62B | $60.78B | $58.09B | $52.58B | $61.03B | $60.20B | $58.01B | $51.67B | $48.73B | $47.51B | $47.28B | $45.05B | |
| Liabilities + Equity | $669.01B | $490.14B | $478.46B | $455.25B | $432.38B | $421.60B | $390.37B | $372.54B | $365.69B | $357.03B | $334.05B | $308.17B | |
| Shares Outstanding | 625,102,271 | 381,230,343 | 380,389,609 | 381,318,702 | 413,858,537 | 458,972,202 | 456,562,399 | 467,717,306 | 485,525,340 | 480,218,547 | 527,259,920 | 553,391,311 |
Przepływy pieniężne 17
| Wskaźnik | Trend | 2025 | 2024 | 2023 | 2022 | 2021 | 2020 | 2019 | 2018 | 2017 | 2016 | 2015 | 2014 |
|---|---|---|---|---|---|---|---|---|---|---|---|---|---|
| D&A | $5.26B | $3.24B | $3.23B | $3.21B | $3.48B | $3.50B | $3.34B | $2.40B | $2.44B | $2.43B | $2.10B | $2.00B | |
| Stock-based Comp | $776M | $569M | $513M | $314M | $331M | $203M | $239M | $170M | $244M | $239M | $161M | $205M | |
| Deferred Tax | $-1.91B | $-853M | $-723M | $-772M | $605M | $-1.63B | $-296M | $714M | $1.43B | $-686M | $-402M | $-76M | |
| Amort. of Intangibles | $1.33B | $77M | $82M | $60M | $29M | $60M | $112M | $174M | $245M | $386M | $430M | $532M | |
| Restructuring | · | · | · | · | · | · | $28M | $34M | $184M | $0 | $120M | · | |
| Operating Cash Flow | $27.72B | $18.16B | $20.57B | $13.81B | $12.31B | $16.70B | $16.64B | $12.98B | $14.18B | $11.86B | $10.13B | $9.30B | |
| CapEx | $1.58B | $1.20B | $961M | $934M | $698M | $710M | $887M | $874M | $1.02B | $779M | $532M | $502M | |
| Investing Cash Flow | $-444M | $-26.41B | $-21.92B | $-29.74B | $-31.50B | $-14.84B | $-23.00B | $-15.62B | $-15.54B | $-25.63B | $-29.73B | $-15.99B | |
| Stock Issued | $400M | $323M | $299M | $276M | $253M | $241M | $199M | $175M | $164M | $131M | $111M | $100M | |
| Stock Repurchased | $4.10B | $734M | $718M | $4.95B | $7.61B | $393M | $1.48B | $2.28B | $240M | $3.66B | $2.44B | $2.04B | |
| Net Stock Activity | $-3.70B | $-411M | $-419M | $-4.67B | $-7.35B | $-152M | $-1.28B | $-2.11B | $-76M | $-3.53B | $-2.33B | $-1.95B | |
| Dividends Paid | $1.52B | $932M | $931M | $950M | $1.15B | $460M | $753M | $773M | $780M | $812M | $816M | $679M | |
| Financing Cash Flow | $-8.85B | $8.17B | $13.84B | $25.13B | $474M | $25.16B | $6.62B | $1.78B | $3.22B | $17.23B | $21.16B | $7.64B | |
| Net Change in Cash | $18.42B | $-84M | $12.50B | $9.20B | $-18.72B | $27.02B | $260M | $-863M | $1.86B | $3.45B | $1.56B | $951M | |
| Taxes Paid | $806M | $1.10B | $1.35B | · | · | · | · | · | · | · | · | · | |
| Free Cash Flow | $26.14B | $16.95B | $19.61B | $12.88B | $11.61B | $15.99B | $15.75B | $12.10B | $13.16B | $11.08B | $9.60B | $8.80B | |
| Levered FCF | · | · | $9.35B | $9.59B | $10.36B | $13.34B | $11.59B | $8.56B | $12.10B | $9.69B | $8.49B | $7.74B |
Rentowność 4
| Wskaźnik | Trend | 2025 | 2024 | 2023 | 2022 | 2021 | 2020 | 2019 | 2018 | 2017 | 2016 | 2015 | 2014 |
|---|---|---|---|---|---|---|---|---|---|---|---|---|---|
| Net Margin | 4.6% | 12.1% | 13.3% | 21.5% | 40.7% | 9.5% | 19.4% | 21.4% | 7.3% | 14.7% | 17.3% | 19.9% | |
| Pretax Margin | 4.3% | 15.1% | 16.4% | 27.0% | 51.9% | 11.2% | 24.0% | 26.1% | 20.2% | 21.5% | 25.1% | 29.5% | |
| ROA | 0.42% | 0.98% | 1.1% | 1.7% | 2.9% | 0.67% | 1.5% | 1.6% | 0.55% | · | 1.3% | 1.5% | |
| ROE | 2.2% | 7.7% | 8.8% | 14.2% | 19.9% | 4.6% | 9.5% | 11.8% | 4.1% | · | 8.8% | 9.9% |
Płynność i wypłacalność 1
| Wskaźnik | Trend | 2025 | 2024 | 2023 | 2022 | 2021 | 2020 | 2019 | 2018 | 2017 | 2016 | 2015 | 2014 |
|---|---|---|---|---|---|---|---|---|---|---|---|---|---|
| Debt / Equity | 0.0 | 0.0 | 0.0 | 0.0 | 0.0 | 0.0 | 0.1 | 0.2 | 0.0 | · | 0.0 | 0.4 |
Efektywność 1
| Wskaźnik | Trend | 2025 | 2024 | 2023 | 2022 | 2021 | 2020 | 2019 | 2018 | 2017 | 2016 | 2015 | 2014 |
|---|---|---|---|---|---|---|---|---|---|---|---|---|---|
| Asset Turnover | 0.1 | 0.1 | 0.1 | 0.1 | 0.1 | 0.1 | 0.1 | 0.1 | 0.1 | · | 0.1 | 0.1 |
Stopy Wzrostu 10
| Wskaźnik | Trend | 2025 | 2024 | 2023 | 2022 | 2021 | 2020 | 2019 | 2018 | 2017 | 2016 | 2015 | 2014 |
|---|---|---|---|---|---|---|---|---|---|---|---|---|---|
| Revenue YoY | 36.6% | 6.3% | 7.4% | 12.5% | 6.7% | · | · | · | · | · | · | · | |
| Revenue CAGR 3Y | 16.0% | 8.7% | 8.8% | · | · | · | · | · | · | · | · | · | |
| Revenue CAGR 5Y | 13.4% | · | · | · | · | · | · | · | · | · | · | · | |
| EPS YoY | -65.2% | -3.0% | -33.3% | -33.5% | 420.1% | · | · | · | · | · | · | · | |
| EPS CAGR 3Y | -39.2% | -24.5% | 32.1% | · | · | · | · | · | · | · | · | · | |
| EPS CAGR 5Y | -4.9% | · | · | · | · | · | · | · | · | · | · | · | |
| Net Income YoY | -48.4% | -2.8% | -33.6% | -40.6% | 356.5% | · | · | · | · | · | · | · | |
| Net Income CAGR 3Y | -30.7% | -27.4% | 21.7% | · | · | · | · | · | · | · | · | · | |
| Net Income CAGR 5Y | -2.0% | · | · | · | · | · | · | · | · | · | · | · | |
| Dividend CAGR 5Y | 26.9% | · | · | · | · | · | · | · | · | · | · | · |
Wycena (TTM) 13
| Wskaźnik | Trend | 2025 | 2024 | 2023 | 2022 | 2021 | 2020 | 2019 | 2018 | 2017 | 2016 | 2015 | 2014 |
|---|---|---|---|---|---|---|---|---|---|---|---|---|---|
| Revenue TTM | $53.43B | $39.11B | $36.79B | $34.25B | $30.43B | $28.52B | $28.59B | $28.08B | $27.24B | $25.50B | $23.41B | $22.29B | |
| Net Income TTM | $2.45B | $4.75B | $4.89B | $7.36B | $12.39B | $2.71B | $5.55B | $6.01B | $1.98B | $3.75B | $4.05B | $4.43B | |
| Market Cap | $151.50B | $67.98B | $49.88B | $35.45B | $60.05B | $45.37B | $46.98B | $35.35B | $48.35B | · | $38.06B | $45.68B | |
| P/E | 60.1 | 15.4 | 11.0 | 5.2 | 5.4 | 19.1 | 9.3 | 6.4 | 28.5 | 12.7 | 10.2 | 10.9 | |
| P/S | 2.8 | 1.7 | 1.4 | 1.0 | 2.0 | 1.6 | 1.6 | 1.3 | 1.8 | · | 1.6 | 2.0 | |
| P/B | 1.3 | 1.1 | 0.9 | 0.7 | 1.0 | 0.8 | 0.8 | 0.7 | 1.0 | · | 0.8 | 1.0 | |
| P / Tangible Book | 2.2 | 1.5 | 1.2 | 0.9 | 1.3 | 1.0 | · | · | · | · | · | · | |
| P / Cash Flow | 5.5 | 3.7 | 2.4 | 2.6 | 4.9 | 2.7 | 2.8 | 2.7 | 3.4 | · | 3.8 | 4.9 | |
| P / FCF | 5.8 | 4.0 | 2.5 | 2.8 | 5.2 | 2.8 | 3.0 | 2.9 | 3.7 | · | 4.0 | 5.2 | |
| Dividend Yield | 1.0% | 1.4% | 1.9% | 2.7% | 1.9% | 1.0% | 1.6% | 2.2% | 1.6% | · | 2.1% | 1.5% | |
| Earnings Yield | 1.7% | 6.5% | 9.1% | 19.3% | 18.6% | 5.2% | 10.7% | 15.6% | 3.5% | 7.9% | 9.8% | 9.2% | |
| Payout Ratio | 61.8% | 19.6% | 19.1% | 12.9% | 9.3% | 17.0% | 13.6% | 12.8% | 39.4% | 21.6% | 20.2% | 15.3% | |
| Annual Payout | $1.52B | $932M | $931M | $950M | $1.15B | $460M | $753M | $773M | $780M | $812M | $816M | $679M |
Rachunek zysków i strat 10
| Wskaźnik | Trend | Q2 2026 | Q1 2026 | Q4 2025 | Q3 2025 | Q2 2025 | Q1 2025 | Q4 2024 | Q3 2024 | Q2 2024 | Q1 2024 | Q4 2023 | Q3 2023 | Q2 2023 | Q1 2023 | Q4 2022 | Q3 2022 |
|---|---|---|---|---|---|---|---|---|---|---|---|---|---|---|---|---|---|
| Revenue | $15.85B | $15.23B | $15.58B | $15.36B | $12.49B | $10.00B | $10.19B | $10.01B | $9.51B | $9.40B | $9.51B | $9.37B | $9.01B | $8.90B | $9.04B | $8.80B | |
| Interest Expense | · | · | · | · | · | · | · | · | · | $3.69B | · | $3.45B | $3.05B | $2.57B | · | $1.20B | |
| Interest Income | $16.39B | $16.23B | $16.69B | $16.76B | $13.83B | $11.42B | $11.72B | $11.86B | $11.28B | $11.18B | $11.14B | $10.87B | $10.17B | $9.75B | $9.16B | $8.20B | |
| Pretax Income | $3.82B | $2.70B | $2.10B | $4.38B | $-5.93B | $1.73B | $1.46B | $2.22B | $651M | $1.58B | $932M | $2.22B | $1.73B | $1.16B | $1.54B | $2.19B | |
| Income Tax | $798M | $518M | $345M | $1.19B | $-1.67B | $325M | $366M | $441M | $54M | $302M | $226M | $432M | $297M | $203M | $312M | $493M | |
| Net Income | $3.02B | $2.17B | $2.13B | $3.19B | $-4.28B | $1.40B | $1.10B | $1.78B | $597M | $1.28B | $706M | $1.79B | $1.43B | $960M | $1.23B | $1.69B | |
| EPS (Basic) | $4.73 | $3.34 | $4.32 | $4.83 | $-8.58 | $3.46 | $2.66 | $4.42 | $1.39 | $3.14 | $1.67 | $4.46 | $3.53 | $2.32 | $3.14 | $4.21 | |
| EPS (Diluted) | $4.73 | $3.34 | $4.33 | $4.83 | $-8.58 | $3.45 | $2.67 | $4.41 | $1.38 | $3.13 | $1.67 | $4.45 | $3.52 | $2.31 | $3.13 | $4.20 | |
| Shares (Basic) | 620,500,000 | 622,500,000 | -987,000,000 | 639,000,000 | 505,600,000 | 383,100,000 | -765,600,000 | 383,000,000 | 383,100,000 | 382,200,000 | -765,500,000 | 382,500,000 | 382,800,000 | 382,600,000 | -793,200,000 | 383,400,000 | |
| Shares (Diluted) | 621,100,000 | 623,400,000 | -987,800,000 | 639,500,000 | 505,600,000 | 384,000,000 | -767,400,000 | 383,700,000 | 383,900,000 | 383,400,000 | -767,400,000 | 383,300,000 | 383,700,000 | 383,800,000 | -796,200,000 | 384,600,000 |
Bilans 17
| Wskaźnik | Trend | Q2 2026 | Q1 2026 | Q4 2025 | Q3 2025 | Q2 2025 | Q1 2025 | Q4 2024 | Q3 2024 | Q2 2024 | Q1 2024 | Q4 2023 | Q3 2023 | Q2 2023 | Q1 2023 | Q4 2022 | Q3 2022 |
|---|---|---|---|---|---|---|---|---|---|---|---|---|---|---|---|---|---|
| PP&E (Net) | $6.24B | $5.73B | $5.60B | $5.58B | $5.69B | $4.58B | $4.51B | $4.44B | $4.40B | $4.37B | · | $4.38B | $4.36B | $4.37B | · | $4.26B | |
| PP&E (Gross) | · | · | $12.20B | · | · | · | $10.11B | · | · | · | · | · | · | · | · | · | |
| Accum. Depreciation | · | · | $6.60B | · | · | · | $5.60B | · | · | · | · | · | · | · | · | · | |
| Goodwill | $31.87B | $28.50B | $28.51B | $28.86B | $28.34B | $15.07B | $15.06B | $15.08B | $15.06B | $15.06B | $15.06B | $15.05B | $15.06B | $14.78B | $14.78B | $14.77B | |
| Intangibles | $16.08B | $16.09B | $16.58B | $17.04B | $18.16B | $216M | $233M | $253M | $271M | $290M | · | $332M | $356M | $367M | · | $183M | |
| Total Assets | $673.84B | $682.90B | $669.01B | $661.88B | $658.97B | $493.60B | $490.14B | $486.43B | $480.02B | $481.72B | · | $471.44B | $467.80B | $471.66B | · | $444.23B | |
| Short-term Debt | $694M | $1.63B | $1.09B | $616M | $742M | $573M | $562M | $520M | $715M | $568M | · | $522M | $649M | $542M | · | $528M | |
| Total Liabilities | $560.04B | $570.64B | $555.39B | $548.06B | $548.01B | $430.06B | $429.36B | $423.51B | $422.04B | $423.92B | · | $417.77B | $413.24B | $417.01B | · | $393.37B | |
| Total Debt | $694M | $1.63B | · | $616M | $742M | $573M | · | $520M | $715M | $568M | · | $522M | $649M | $542M | · | $528M | |
| Common Stock | $7M | $7M | $7M | $7M | $7M | $7M | $7M | $7M | $7M | $7M | · | $7M | $7M | $7M | · | $7M | |
| Paid-in Capital | $65.11B | $64.28B | $64.03B | $63.73B | $63.47B | $36.69B | $36.43B | $36.22B | $36.01B | $35.81B | · | $35.33B | $35.16B | $34.95B | · | $34.58B | |
| Retained Earnings | $69.25B | $66.79B | $65.19B | $63.62B | $60.89B | $65.62B | $64.50B | $63.70B | $62.21B | $61.91B | · | $60.53B | $59.03B | $57.90B | · | $56.24B | |
| Treasury Stock | $14.27B | $12.94B | $10.15B | $7.63B | $6.59B | $31.25B | $30.87B | $30.71B | $30.55B | $30.39B | · | $29.98B | $29.82B | $29.66B | · | $29.26B | |
| AOCI | $-6.30B | $-5.88B | $-5.47B | $-5.92B | $-6.82B | $-7.53B | $-9.29B | $-6.29B | $-9.70B | $-9.53B | · | $-12.22B | $-9.82B | $-8.54B | · | $-10.70B | |
| Stockholders' Equity | $113.79B | $112.26B | $113.62B | $113.81B | $110.96B | $63.54B | $60.78B | $62.92B | $57.98B | $57.80B | $58.09B | $53.67B | $54.56B | $54.65B | $52.58B | $50.86B | |
| Liabilities + Equity | $673.84B | $682.90B | $669.01B | $661.88B | $658.97B | $493.60B | $490.14B | $486.43B | $480.02B | $481.72B | · | $471.44B | $467.80B | $471.66B | · | $444.23B | |
| Shares Outstanding | 613,484,836 | 615,856,605 | 625,102,271 | 635,733,605 | 639,517,306 | 382,959,187 | 381,230,343 | 381,510,336 | 381,856,146 | 382,063,343 | · | 380,991,150 | 381,441,449 | 382,030,281 | · | 381,976,333 |
Przepływy pieniężne 16
| Wskaźnik | Trend | Q2 2026 | Q1 2026 | Q4 2025 | Q3 2025 | Q2 2025 | Q1 2025 | Q4 2024 | Q3 2024 | Q2 2024 | Q1 2024 | Q4 2023 | Q3 2023 | Q2 2023 | Q1 2023 | Q4 2022 | Q3 2022 |
|---|---|---|---|---|---|---|---|---|---|---|---|---|---|---|---|---|---|
| D&A | $1.58B | $1.51B | $1.60B | $1.83B | $1.01B | $812M | $814M | $806M | $811M | $806M | $798M | $852M | $325M | $1.25B | $843M | $744M | |
| Stock-based Comp | $215M | $131M | $200M | $174M | $225M | $177M | $144M | $127M | $105M | $193M | $141M | $95M | $123M | $154M | $76M | $66M | |
| Deferred Tax | $67M | $244M | $-503M | $858M | $-2.52B | $262M | $-352M | $-148M | $-469M | $116M | $-210M | $-113M | $-231M | $-169M | $-401M | $-360M | |
| Amort. of Intangibles | $507M | $492M | $525M | $514M | $271M | · | · | · | · | $19M | $22M | $24M | $22M | $14M | $15M | $17M | |
| Operating Cash Flow | $8.44B | $6.02B | $7.83B | $9.15B | $6.07B | $4.67B | $2.45B | $6.46B | $6.24B | $3.01B | $7.10B | $7.13B | $3.35B | $2.99B | $8.16B | $2.78B | |
| CapEx | $367M | $553M | $444M | $387M | $399M | $348M | $356M | $312M | $289M | $247M | $261M | $259M | $206M | $235M | $290M | $221M | |
| Investing Cash Flow | $-16.49B | $26M | $-7.81B | $-9.95B | $16.47B | $845M | $-14.25B | $-6.30B | $-7.53B | $1.68B | $-9.69B | $-5.07B | $-4.17B | $-2.99B | $-11.45B | $-5.79B | |
| Stock Issued | $139M | $119M | $105M | $91M | $111M | $93M | $72M | $76M | $95M | $80M | $64M | $71M | $88M | $76M | $62M | $76M | |
| Stock Repurchased | $2.75B | $2.79B | $2.52B | $1.04B | $167M | $375M | $161M | $161M | $163M | $249M | $158M | $157M | $157M | $246M | $157M | $319M | |
| Net Stock Activity | · | $-2.67B | · | · | · | $-282M | · | · | · | $-169M | · | · | · | $-170M | · | · | |
| Dividends Paid | $500M | $502M | $508M | $386M | $388M | $234M | $232M | $233M | $232M | $235M | $233M | $232M | $232M | $234M | $231M | $232M | |
| Financing Cash Flow | $-15.33B | $11.11B | $3.54B | $-2.25B | $-9.92B | $-218M | $5.75B | $1.74B | $-2.38B | $3.06B | $1.04B | $1.20B | $-4.11B | $15.72B | $9.26B | $6.05B | |
| Net Change in Cash | $-23.38B | $17.16B | $3.57B | $-3.05B | $12.61B | $5.29B | $-6.05B | $1.89B | $-3.67B | $7.75B | $-1.55B | $3.26B | $-4.92B | $15.72B | $5.96B | $3.04B | |
| Taxes Paid | $558M | $184M | · | · | $218M | $3M | · | · | · | · | · | · | · | · | · | · | |
| Free Cash Flow | · | $5.47B | · | · | · | $4.32B | · | · | · | $2.76B | · | · | · | $2.76B | · | · | |
| Levered FCF | · | · | · | · | · | · | · | · | · | $-222M | · | · | · | $637M | · | · |
Rentowność 4
| Wskaźnik | Trend | Q2 2026 | Q1 2026 | Q4 2025 | Q3 2025 | Q2 2025 | Q1 2025 | Q4 2024 | Q3 2024 | Q2 2024 | Q1 2024 | Q4 2023 | Q3 2023 | Q2 2023 | Q1 2023 | Q4 2022 | Q3 2022 |
|---|---|---|---|---|---|---|---|---|---|---|---|---|---|---|---|---|---|
| Net Margin | 19.1% | 14.3% | · | 20.8% | -34.2% | 14.0% | · | 17.8% | 6.3% | 13.6% | · | 19.1% | 15.9% | 10.8% | · | 19.2% | |
| Pretax Margin | 24.1% | 17.7% | · | 28.5% | -47.5% | 17.3% | · | 22.1% | 6.9% | 16.8% | · | 23.7% | 19.2% | 13.1% | · | 24.8% | |
| ROA | 0.45% | 0.37% | · | 0.56% | -0.75% | 0.29% | · | 0.37% | 0.13% | 0.27% | · | 0.39% | 0.32% | 0.21% | · | 0.39% | |
| ROE | 2.7% | 2.5% | · | 3.6% | -5.1% | 2.3% | · | 3.0% | 1.1% | 2.3% | · | 3.4% | 2.6% | 1.7% | · | 3.0% |
Płynność i wypłacalność 1
| Wskaźnik | Trend | Q2 2026 | Q1 2026 | Q4 2025 | Q3 2025 | Q2 2025 | Q1 2025 | Q4 2024 | Q3 2024 | Q2 2024 | Q1 2024 | Q4 2023 | Q3 2023 | Q2 2023 | Q1 2023 | Q4 2022 | Q3 2022 |
|---|---|---|---|---|---|---|---|---|---|---|---|---|---|---|---|---|---|
| Debt / Equity | 0.0 | 0.0 | · | 0.0 | 0.0 | 0.0 | · | 0.0 | 0.0 | 0.0 | · | 0.0 | 0.0 | 0.0 | · | 0.0 |
Efektywność 1
| Wskaźnik | Trend | Q2 2026 | Q1 2026 | Q4 2025 | Q3 2025 | Q2 2025 | Q1 2025 | Q4 2024 | Q3 2024 | Q2 2024 | Q1 2024 | Q4 2023 | Q3 2023 | Q2 2023 | Q1 2023 | Q4 2022 | Q3 2022 |
|---|---|---|---|---|---|---|---|---|---|---|---|---|---|---|---|---|---|
| Asset Turnover | 0.0 | 0.0 | · | 0.0 | 0.0 | 0.0 | · | 0.0 | 0.0 | 0.0 | · | 0.0 | 0.0 | 0.0 | · | 0.0 |
Wycena (TTM) 11
| Wskaźnik | Trend | Q2 2026 | Q1 2026 | Q4 2025 | Q3 2025 | Q2 2025 | Q1 2025 | Q4 2024 | Q3 2024 | Q2 2024 | Q1 2024 | Q4 2023 | Q3 2023 | Q2 2023 | Q1 2023 | Q4 2022 | Q3 2022 |
|---|---|---|---|---|---|---|---|---|---|---|---|---|---|---|---|---|---|
| Revenue TTM | $58.93B | $53.08B | · | $47.87B | $42.01B | $38.92B | · | $38.29B | $37.29B | $36.68B | · | $36.09B | $34.95B | $34.11B | · | $33.04B | |
| Net Income TTM | $4.11B | $2.49B | · | $2.10B | $-499M | $5.06B | · | $5.44B | $5.10B | $5.46B | · | $5.88B | $6.12B | $7.09B | · | $9.23B | |
| Market Cap | $123.08B | $112.35B | · | $135.14B | $136.06B | $68.66B | · | $57.12B | $52.87B | $56.89B | · | $36.98B | $41.72B | $36.74B | · | $35.21B | |
| P/E | 46.4 | 60.0 | · | 51.7 | 322.4 | 14.5 | · | 11.2 | 11.1 | 11.1 | · | 6.7 | 7.3 | 5.6 | · | 4.3 | |
| P/S | 2.1 | 2.1 | · | 2.8 | 3.2 | 1.8 | · | 1.5 | 1.4 | 1.6 | · | 1.0 | 1.2 | 1.1 | · | 1.1 | |
| P/B | 1.1 | 1.0 | · | 1.2 | 1.2 | 1.1 | · | 0.9 | 0.9 | 1.0 | · | 0.7 | 0.8 | 0.7 | · | 0.7 | |
| P / Tangible Book | 1.9 | 1.7 | · | 2.0 | 2.1 | 1.4 | · | 1.2 | 1.2 | 1.3 | · | 1.0 | 1.1 | 0.9 | · | 1.0 | |
| P / Cash Flow | · | 18.7 | · | · | · | 14.7 | · | · | · | 18.9 | · | · | · | 12.3 | · | · | |
| P / FCF | · | 20.5 | · | · | · | 15.9 | · | · | · | 20.6 | · | · | · | 13.3 | · | · | |
| Earnings Yield | 2.1% | 1.7% | · | 1.9% | 0.31% | 6.9% | · | 8.9% | 9.0% | 9.0% | · | 14.9% | 13.7% | 17.8% | · | 23.4% | |
| Payout Ratio | · | 23.1% | · | · | · | 16.7% | · | · | · | 18.4% | · | · | · | 24.4% | · | · |
Sprawozdania finansowe Rachunek zysków i strat, bilans, przepływy pieniężne — roczne, ostatnie 5 lat
Rachunek zysków i strat
| 2025-12-31 | 2024-12-31 | 2023-12-31 | 2022-12-31 | 2021-12-31 | |
|---|---|---|---|---|---|
| Przychody | $53.43B | $39.11B | $36.79B | $34.25B | $30.43B |
| Zysk netto | $2.45B | $4.75B | $4.89B | $7.36B | $12.39B |
| Rozwodniony EPS | $4.03 | $11.59 | $11.95 | $17.91 | $26.94 |
Bilans
| 2025-12-31 | 2024-12-31 | 2023-12-31 | 2022-12-31 | 2021-12-31 | |
|---|---|---|---|---|---|
| Dług / Kapitał Własny | 0.0 | 0.0 | 0.0 | 0.0 | 0.0 |
Przepływy pieniężne
| 2025-12-31 | 2024-12-31 | 2023-12-31 | 2022-12-31 | 2021-12-31 | |
|---|---|---|---|---|---|
| Wolny przepływ pieniężny | $26.14B | $16.95B | $19.61B | $12.88B | $11.61B |
Najnowsze wiadomości Najnowsze nagłówki wspominające o tej firmie
- Capital One przenosi miliony kart Discover na własną platformę 27 lipca. Czy uda się zwiększyć sprzedaż bez utraty klientów?
- July 31st Options Now Available For Capital One Financial (COF)
- Discover Credit Cards Stają się Kartami Capital One. Dlaczego Może To Być Większy Problem Niż Myślą Inwestorzy.
- Capital One Financial Corporation (COF) Rada zatwierdza kwartalną dywidendę w związku ze wzrostem przychodów
- Główny Bank Staje w Obliczu Prawnych Problemów z Powodu Oskarżeń o Debanking Konserwatystów
- Capital One wnosi pozew przeciwko operatorom rzekomej „kampanii oszustw” – za naruszenie znaku towarowego
- Wyniki Capital One poniżej oczekiwań rodzą większe pytanie: czy konsument w końcu się załamuje?
- Bank of America Securities podtrzymuje rekomendację Kupuj dla akcji Capital One Financial (COF)
- Capital One zapłaci 425 milionów dolarów w ramach ugody. Kto się kwalifikuje i jak odebrać swoje pieniądze.
Moje wskaźniki Twoja osobista lista obserwowanych — wybrane wiersze z Pełnych Fundamentów
Wybierz metryki, które są dla Ciebie ważne — kliknij ➕ obok dowolnego wiersza w Pełnych Fundamentach powyżej.
Twój wybór został zapisany i będzie Ci towarzyszył we wszystkich tickerach.
Właściciele instytucjonalni (13F) 2 313 emitentów · $65.3B łącznie · Na dzień 30 czerwca 2026
Instytucje, które zgłaszają posiadanie tych akcji w swoich kwartalnych zgłoszeniach SEC Form 13F. Tylko pozycje długie; pojedynczy zgłaszający może pojawić się dwukrotnie dla oddzielnych transz opcji. Duże przeciwstawne pozycje put/call zazwyczaj odzwierciedlają działalność market-makingową lub zabezpieczone zapasy, a nie przekonanie kierunkowe.
| Nowe pozycje | Zamknięte pozycje | Zwiększone | Zmniejszony | Zmiana liczby akcji netto |
|---|---|---|---|---|
| 212 (-22 vs poprzedni kw.) | 142 (-139 vs poprzedni kw.) | 823 (+27 vs poprzedni kw.) | 757 (-43 vs poprzedni kw.) | +3.3M |
Porównano z Q1 2026. Zgłoszenia SEC Form 13F są wymagane w ciągu 45 dni od końca kwartału plus krótki bufor dla spóźnionych zgłoszeń — kwartały mieszczące się jeszcze w tym terminie są pomijane na rzecz ostatniej w pełni zgłoszonej pary.
| Instytucja | Wartość | Akcje | % z śledzonych 13F | Typ |
|---|---|---|---|---|
| VANGUARD CAPITAL MANAGEMENT LLC | $8 154 410 953 | 40 646 052 | 12,50% | Akcje |
| STATE STREET CORP | $5 576 693 925 | 27 797 298 | 8,55% | Akcje |
| VANGUARD PORTFOLIO MANAGEMENT LLC | $2 568 075 832 | 12 800 697 | 3,94% | Akcje |
| GEODE CAPITAL MANAGEMENT, LLC | $2 474 160 031 | 12 320 683 | 3,79% | Akcje |
| NORGES BANK | $2 001 816 052 | 9 978 148 | 3,07% | Akcje |
| Dodge & Cox | $1 829 238 314 | 9 117 926 | 2,80% | Akcje |
| Davis Selected Advisers | $1 659 420 488 | 8 270 946 | 2,54% | Akcje |
| Capital World Investors | $1 479 070 870 | 7 371 325 | 2,27% | Akcje |
| WELLINGTON MANAGEMENT GROUP LLP | $1 391 614 673 | 6 936 570 | 2,13% | Akcje |
| Aristotle Capital Management, LLC | $1 284 008 521 | 6 400 144 | 1,97% | Akcje |
| EAGLE CAPITAL MANAGEMENT LLC | $1 283 400 197 | 6 397 170 | 1,97% | Akcje |
| FMR LLC | $1 131 260 360 | 5 638 821 | 1,73% | Akcje |
| Fisher Asset Management, LLC | $905 940 691 | 4 515 704 | 1,39% | Akcje |
| CHARLES SCHWAB INVESTMENT MANAGEMENT INC | $865 142 653 | 4 312 345 | 1,33% | Akcje |
| VANGUARD FIDUCIARY TRUST CO | $701 049 337 | 3 494 414 | 1,07% | Akcje |
| DIMENSIONAL FUND ADVISORS LP | $633 126 126 | 3 155 846 | 0,97% | Akcje |
| Capital International Investors | $573 776 024 | 2 859 456 | 0,88% | Akcje |
| Newport Trust Company, LLC | $528 376 906 | 2 633 720 | 0,81% | Akcje |
| Point72 Asset Management, L.P. | $507 425 959 | 2 529 289 | 0,78% | Akcje |
| ALLIANCEBERNSTEIN L.P. | $486 486 263 | 2 666 701 | 0,75% | Akcje |
| CANADA PENSION PLAN INVESTMENT BOARD | $482 718 001 | 2 406 131 | 0,74% | Akcje |
| Clearbridge Investments, LLC | $472 240 900 | 2 353 907 | 0,72% | Akcje |
| Ruane, Cunniff & Goldfarb L.P. | $392 429 572 | 1 956 084 | 0,60% | Akcje |
| CITADEL ADVISORS LLC | $386 917 337 | 1 928 608 | 0,59% | Akcje |
| BARCLAYS PLC | $383 205 467 | 1 910 106 | 0,59% | Akcje |
| JANUS HENDERSON GROUP PLC | $380 796 980 | 2 087 407 | 0,58% | Akcje |
| W1M Asset Management Ltd | $368 652 319 | 1 838 344 | 0,56% | Akcje |
| AMERIPRISE FINANCIAL INC | $349 859 156 | 1 743 162 | 0,54% | Akcje |
| MILLENNIUM MANAGEMENT LLC | $345 157 281 | 1 720 453 | 0,53% | Akcje |
| Swiss National Bank | $338 509 336 | 1 687 316 | 0,52% | Akcje |
| GOLDMAN SACHS GROUP INC | $333 046 951 | 1 660 088 | 0,51% | Akcje |
| Qube Research & Technologies Ltd | $328 896 829 | 1 639 402 | 0,50% | Akcje |
| BANK OF AMERICA CORP /DE/ | $325 968 178 | 1 624 804 | 0,50% | Akcje |
| ENVESTNET ASSET MANAGEMENT INC | $321 772 704 | 1 603 895 | 0,49% | Akcje |
| Sessa Capital IM, L.P. | $312 612 704 | 1 558 233 | 0,48% | Akcje |
| BlackRock, Inc. | $311 637 089 | 1 553 370 | 0,48% | Akcje |
| Mitsubishi UFJ Asset Management Co., Ltd. | $299 817 361 | 1 494 454 | 0,46% | Akcje |
| National Pension Service | $295 407 533 | 1 472 473 | 0,45% | Akcje |
| Diamond Hill Capital Management, LLC (Investment Advisor) | $290 897 596 | 1 449 993 | 0,45% | Akcje |
| Holocene Advisors, LP | $281 554 923 | 1 403 424 | 0,43% | Akcje |
| MAVERICK CAPITAL LTD | $277 796 909 | 1 384 692 | 0,43% | Akcje |
| Sumitomo Mitsui Trust Group, Inc. | $276 600 211 | 1 378 727 | 0,42% | Akcje |
| Vanguard Global Advisers, LLC | $275 264 884 | 1 372 071 | 0,42% | Akcje |
| TWO SIGMA INVESTMENTS, LP | $269 391 533 | 1 342 795 | 0,41% | Akcje |
| Meritage Group LP | $265 104 885 | 1 321 428 | 0,41% | Akcje |
| NEUBERGER BERMAN GROUP LLC | $258 808 940 | 1 289 016 | 0,40% | Akcje |
| Legal & General Group Plc | $254 398 398 | 1 268 061 | 0,39% | Akcje |
| UBS AM, a distinct business unit of UBS ASSET MANAGEMENT AMERICAS LLC | $252 709 333 | 1 385 240 | 0,39% | Akcje |
| W1M Investment Management Ltd | $251 322 910 | 1 181 834 | 0,39% | Akcje |
| VANGUARD ASSET MANAGEMENT, Ltd | $241 179 747 | 1 202 172 | 0,37% | Akcje |
| California Public Employees Retirement System | $234 385 148 | 1 168 304 | 0,36% | Akcje |
| RAYMOND JAMES FINANCIAL INC | $234 261 055 | 1 167 685 | 0,36% | Akcje |
| Berkshire Hathaway Inc | $228 328 029 | 1 138 112 | 0,35% | Akcje |
| Artisan Partners Limited Partnership | $223 748 075 | 1 115 283 | 0,34% | Akcje |
| RHUMBLINE ADVISERS | $223 345 099 | 1 113 275 | 0,34% | Akcje |
| D1 Capital Partners L.P. | $219 365 532 | 1 093 438 | 0,34% | Akcje |
| JANE STREET GROUP, LLC | $216 490 045 | 1 079 105 | 0,33% | Opcja kupna |
| Ensign Peak Advisors, Inc | $201 090 253 | 1 002 344 | 0,31% | Akcje |
| CITADEL ADVISORS LLC | $199 140 628 | 992 626 | 0,31% | Opcja kupna |
| Brave Warrior Advisors, LLC | $198 407 763 | 988 973 | 0,30% | Akcje |
| ANTIPODES PARTNERS Ltd | $194 114 896 | 967 575 | 0,30% | Akcje |
| Rokos Capital Management LLP | $192 537 600 | 960 000 | 0,30% | Opcja kupna |
| UBS Group AG | $189 939 192 | 946 761 | 0,29% | Akcje |
| Eurizon Capital SGR S.p.A. | $187 228 662 | 931 293 | 0,29% | Akcje |
| BNP PARIBAS FINANCIAL MARKETS | $184 601 095 | 920 153 | 0,28% | Akcje |
| Khrom Capital Management LLC | $177 994 277 | 887 221 | 0,27% | Akcje |
| Avantyr Capital Partners, LP | $173 830 409 | 866 466 | 0,27% | Akcje |
| PointState Capital LP | $171 341 517 | 854 060 | 0,26% | Akcje |
| CALIFORNIA STATE TEACHERS RETIREMENT SYSTEM | $169 186 312 | 927 404 | 0,26% | Akcje |
| JANE STREET GROUP, LLC | $168 565 940 | 840 225 | 0,26% | Opcja sprzedaży |
| 59 North Capital Management, LP | $165 541 994 | 825 152 | 0,25% | Akcje |
| Third Point LLC | $165 511 500 | 825 000 | 0,25% | Akcje |
| Assenagon Asset Management S.A. | $159 903 770 | 797 048 | 0,25% | Akcje |
| Alyeska Investment Group, L.P. | $158 599 940 | 790 549 | 0,24% | Akcje |
| Squarepoint Ops LLC | $153 456 645 | 764 912 | 0,24% | Akcje |
| FIDUCIARY MANAGEMENT INC /WI/ | $151 207 896 | 753 703 | 0,23% | Akcje |
| Nuveen, LLC | $140 333 727 | 699 500 | 0,22% | Akcje |
| PRUDENTIAL FINANCIAL INC | $135 697 763 | 676 392 | 0,21% | Akcje |
| NEW YORK STATE COMMON RETIREMENT FUND | $133 114 179 | 663 514 | 0,20% | Akcje |
| Balyasny Asset Management L.P. | $125 367 237 | 624 899 | 0,19% | Akcje |
| LPL Financial LLC | $122 633 602 | 611 273 | 0,19% | Akcje |
| RENAISSANCE TECHNOLOGIES LLC | $118 667 532 | 591 504 | 0,18% | Akcje |
| VICTORY CAPITAL MANAGEMENT INC | $115 109 737 | 573 770 | 0,18% | Akcje |
| ADAGE CAPITAL PARTNERS GP, L.L.C. | $110 246 307 | 549 528 | 0,17% | Akcje |
| AustralianSuper Pty Ltd | $108 967 355 | 543 153 | 0,17% | Akcje |
| FIRST MANHATTAN CO. LLC. | $107 663 072 | 536 652 | 0,16% | Akcje |
| STATE BOARD OF ADMINISTRATION OF FLORIDA RETIREMENT SYSTEM | $107 474 541 | 535 712 | 0,16% | Akcje |
| PANAGORA ASSET MANAGEMENT INC | $106 230 296 | 529 510 | 0,16% | Akcje |
| HEALTHCARE OF ONTARIO PENSION PLAN TRUST FUND | $105 708 885 | 526 911 | 0,16% | Akcje |
| AVIVA PLC | $105 140 127 | 524 076 | 0,16% | Akcje |
| Corient Private Wealth LP | $98 018 053 | 488 576 | 0,15% | Akcje |
| Quantinno Capital Management LP | $97 559 284 | 486 288 | 0,15% | Akcje |
| BANK OF MONTREAL /CAN/ | $91 441 192 | 455 793 | 0,14% | Akcje |
| COOPERMAN LEON G | $91 282 100 | 455 000 | 0,14% | Akcje |
| Zurcher Kantonalbank (Zurich Cantonalbank) | $90 614 035 | 451 670 | 0,14% | Akcje |
| APG Asset Management N.V. | $89 261 072 | 508 684 | 0,14% | Akcje |
| Teewinot Capital Advisers, L.L.C. | $89 113 398 | 444 190 | 0,14% | Akcje |
| NORTHWESTERN MUTUAL WEALTH MANAGEMENT CO | $88 499 898 | 441 132 | 0,14% | Akcje |
| PFA Pension, Forsikringsaktieselskab | $87 771 608 | 437 502 | 0,13% | Akcje |
| CITADEL ADVISORS LLC | $86 674 260 | 432 032 | 0,13% | Opcja sprzedaży |
Insiderzy spółki 66 insiderów · 30 dyrektorzy generalni · 27 dyrektorzy
| Insider | Rola | Ostatnia aktywność | Posiadane akcje | Kupna 12m | Sprzedaże 12m | Netto 12m |
|---|---|---|---|---|---|---|
| Kevin S. Borgmann | Senior Advisor to the CEO | 6 sierpnia 2024 M | 40 934 | 0 | 0 | $0 |
| Sheldon Hall | Senior Advisor to CEO | 11 marca 2024 F | 98 614 | 0 | 0 | $0 |
| David R Lawson | President and CEO COAF | 2 marca 2007 A | 62 150 | 0 | 0 | $0 |
| Herbert J Boydstun | Prsdt-CEO Banking Segment | 31 maja 2006 A | 26 103 | 0 | 0 | $0 |
| Andrew M Young | Chief Financial Officer | 3 czerwca 2025 A | 51 273 | 0 | 0 | $0 |
| Gary L Perlin | Chief Financial Officer | 22 maja 2013 M | 96 528 | 0 | 0 | $0 |
| Yajnik Sanjiv | President, Financial Services | 9 marca 2026 F | 149 383 | 0 | 0 | $0 |
| Neal Blinde | President, Commercial Banking | 3 czerwca 2025 A | 116 220 | 0 | 0 | $0 |
| Michael J Wassmer | President, Card | 11 marca 2022 F | 89 785 | 0 | 0 | $0 |
| Michael Slocum | President, Commercial Banking | 15 lutego 2022 F | 60 314 | 0 | 0 | $0 |
| Jonathan W. Witter | President, Retail Banking | 8 marca 2017 F | 105 415 | 0 | 0 | $0 |
| Ryan M. Schneider | President, Card | 8 marca 2016 F | 182 790 | 0 | 0 | $0 |
| Lynn Ann Pike | President, Banking | 15 grudnia 2011 M | 117 744 | 0 | 0 | $0 |
| KANAS JOHN ADAM | President, Banking Segment | 7 sierpnia 2007 G | 261 940 | 0 | 0 | $0 |
| Celia Karam | Pres, Retail Bank | 17 sierpnia 2026 S | 59 708 | 0 | 2 | $-425 782 |
| Lia Dean | Pres, Banking & Prem. Products | 17 sierpnia 2026 S | 63 261 | 0 | 2 | $-494 566 |
| Timothy P Golden | SVP, Chief Accounting Officer | 29 lipca 2026 S | 7 429 | 0 | 1 | $-735 757 |
| Frank G. Laprade,Iii | Chief Enterprise Srvcs Officer | 7 kwietnia 2026 A | 69 283 | 0 | 2 | $-3 961 081 |
| Robert M. Alexander | Chief Information Officer | 9 marca 2026 F | 77 292 | 0 | 0 | $0 |
| Kara West | Chief Enterprise Risk Officer | 3 czerwca 2025 A | 39 724 | 0 | 0 | $0 |
| Kaitlin Haggerty | Chief Human Resources Officer | 3 czerwca 2025 A | 44 403 | 0 | 0 | $0 |
| Richard Scott Blackley | Senior Advisor | 11 marca 2021 F | 57 541 | 0 | 0 | $0 |
| Kleber Santos | Pres., Retail & Direct Banking | 19 marca 2020 S | 22 304 | 0 | 0 | $0 |
| Christopher T Newkirk | Pres,Small Bus, Intl & Walmart | 5 marca 2020 F | 36 056 | 0 | 0 | $0 |
| Noelle K Eder | Chief Card Cust. Exp. Officer | 8 marca 2018 F | 41 876 | 0 | 0 | $0 |
| Stephen S Crawford | Head of Finance and Corp Dev | 8 marca 2017 F | 177 684 | 0 | 0 | $0 |
| SCHNALL PETER A | Chief Risk Officer | 31 stycznia 2013 A | 207 085 | 0 | 0 | $0 |
| Matthew W Schuyler | Chief Human Resources Officer | 3 marca 2009 F | 145 167 | 0 | 0 | $0 |
| Larry A Klane | Pdt, Global Financial Services | 13 listopada 2007 M | 3 809 | 0 | 0 | $0 |
| Gregor Bailar | Chief Information Officer | 24 października 2007 M | 29 891 | 0 | 0 | $0 |
| Peter E Raskind | Dyrektor | 8 maja 2026 A | 34 396 | 0 | 0 | $0 |
| Mayo A Shattuck III | Dyrektor | 8 maja 2026 A | 67 911 | 0 | 0 | $0 |
| Craig A. Williams | Dyrektor | 18 maja 2025 A | 8 905 | 0 | 0 | $0 |
| Michael Shepherd | Dyrektor | 18 maja 2025 A | 26 693 | 0 | 0 | $0 |
| Jennifer L. Wong | Dyrektor | 18 maja 2025 A | 13 932 | 0 | 0 | $0 |
| Thomas G Maheras | Dyrektor | 18 maja 2025 A | 66 431 | 0 | 0 | $0 |
| Ann F Hackett | Dyrektor | 12 maja 2025 S | 56 244 | 0 | 0 | $0 |
| Eileen Serra | Dyrektor | 8 maja 2025 A | 11 531 | 0 | 0 | $0 |
| Peter Thomas Killalea | Dyrektor | 8 maja 2025 A | 20 042 | 0 | 0 | $0 |
| Christine Rose Detrick | Dyrektor | 8 maja 2025 A | 7 610 | 0 | 0 | $0 |
| Francois Locoh-Donou | Dyrektor | 8 maja 2025 A | 13 489 | 0 | 0 | $0 |
| Suni P Harford | Dyrektor | 2 maja 2024 A | 1 779 | 0 | 0 | $0 |
| Ime Archibong | Dyrektor | 2 maja 2024 A | 7 377 | 0 | 0 | $0 |
| Cornelis Paj Leenaars | Dyrektor | 2 maja 2024 A | 12 657 | 0 | 0 | $0 |
| Bradford H Warner | Dyrektor | 4 maja 2023 A | 47 554 | 0 | 0 | $0 |
| Catherine West | Dyrektor | 5 maja 2022 A | 22 124 | 0 | 0 | $0 |
| Aparna Chennapragada | Dyrektor | 30 kwietnia 2020 A | 7 066 | 0 | 0 | $0 |
| LEROY PIERRE E | Dyrektor | 30 kwietnia 2020 A | 47 986 | 0 | 0 | $0 |
| Lewis Hay III | Dyrektor | 24 lipca 2018 M | 45 190 | 0 | 0 | $0 |
| Benjamin P Jenkins III | Dyrektor | 2 maja 2018 A | 16 707 | 0 | 0 | $0 |
Insiderzy z zgłoszeń SEC Form 3/4/5; netto = tylko otwarty rynek P/S
Aktywiści i właściciele 5%+ 2 akcje
Inwestorzy, którzy złożyli SEC Schedule 13D — posiadanie beneficjentów powyżej 5% z zamiarem wpływania na emitenta (udziały aktywistów, kampanie zarządu, M&A). Każdy wiersz pokazuje najnowszy znany stan pozycji tego zgłaszającego.
| Zgłaszający | Złożono | Udział | Status | Cel | Zgłoszenie |
|---|---|---|---|---|---|
| ING Groep N.V., ING Bank N.V. ×2 zgłoszenia | 10 września 2012 | — | Pierwotne zgłoszenie | — | SEC |
| Capital One Financial Corporation, Capital One Bank (USA), National Association, Capital One NA LIHTC, Inc. | 14 marca 2011 | — | Pierwotne zgłoszenie | — | SEC |
Purpose is an automated classification of the filer's own stated purpose (SEC Item 4) — not investment advice. "—" means no clear purpose was stated or the text could not be classified.
Posiadanie ETF-ów Posiadane przez 236 funduszy ETF
Waga odzwierciedla wyłącznie bezpośrednie udziały kapitałowe (N-PORT); fundusze oparte na dźwigni lub instrumentach pochodnych mogą posiadać dodatkowe ekspozycje na swapy, które nie są pokazane.
| Fundusz | Waga | Jednostki | Na dzień | Źródło |
|---|---|---|---|---|
| DFNL · Davis Fundamental ETF Trust | 9,37% | 229 889 NS | 30 kwietnia 2026 | N-PORT |
| DUSA · Davis Fundamental ETF Trust | 6,70% | 405 995 NS | 30 kwietnia 2026 | N-PORT |
| FDFF · Fidelity Covington Trust | 5,36% | 11 966 NS | 31 maja 2026 | N-PORT |
| PGF · Invesco Exchange-Traded Fund Trust | 4,51% | 1 754 490 | 21 sierpnia 2026 | Dziennie |
| KBWB · Invesco Exchange-Traded Fund Trust … | 4,17% | 1 301 925 SH | 21 sierpnia 2026 | Dziennie |
| MBCC · Northern Lights Fund Trust IV | 3,67% | 35 986 NS | 31 maja 2026 | N-PORT |
| ASLV · ALLSPRING EXCHANGE-TRADED FUNDS TRU… | 3,19% | 37 216 NS | 30 kwietnia 2026 | N-PORT |
| DWLD · Davis Fundamental ETF Trust | 3,10% | 91 965 NS | 30 kwietnia 2026 | N-PORT |
| FFF · Founder Funds Trust | 2,89% | 727 NS | 30 czerwca 2026 | N-PORT |
| PGX · Invesco Exchange-Traded Fund Trust … | 2,63% | 5 773 681 | 21 sierpnia 2026 | Dziennie |
| GEND · Spinnaker ETF Series | 2,55% | 597 NS | 30 kwietnia 2026 | N-PORT |
| FLAG · Global X Funds | 2,17% | 187 NS | 30 kwietnia 2026 | N-PORT |
| GVIP · Goldman Sachs ETF Trust | 1,92% | 58 057 NS | 31 maja 2026 | N-PORT |
| WLTG · ETF Opportunities Trust | 1,89% | 7 490 NS | 30 kwietnia 2026 | N-PORT |
| IYG · iShares Trust | 1,83% | 187 909 SH | 21 sierpnia 2026 | Dziennie |
| OMAH · Tidal Trust III | 1,80% | 70 308 NS | 30 kwietnia 2026 | N-PORT |
| TGLB · T. Rowe Price Exchange-Traded Funds… | 1,68% | 1 941 NS | 30 kwietnia 2026 | N-PORT |
| IYJ · iShares Trust | 1,58% | 142 408 SH | 21 sierpnia 2026 | Dziennie |
| WBIF · Absolute Shares Trust | 1,53% | 1 788 NS | 30 czerwca 2026 | N-PORT |
| PWV · Invesco Exchange-Traded Fund Trust | 1,49% | 129 419 SH | 21 sierpnia 2026 | Dziennie |
| FNCL · FIDELITY COVINGTON TRUST | 1,44% | 166 948 NS | 30 kwietnia 2026 | N-PORT |
| RSPF · Invesco Exchange-Traded Fund Trust | 1,43% | 20 887 SH | 21 sierpnia 2026 | Dziennie |
| VFH · VANGUARD WORLD FUND | 1,40% | 974 499 SH | 19 sierpnia 2026 | Dziennie |
| PFF · iShares Trust | 1,26% | 9 832 552 SH | 21 sierpnia 2026 | Dziennie |
| PY · Principal Exchange-Traded Funds | 1,24% | 13 639 NS | 30 czerwca 2026 | N-PORT |
| ITAN · EA Series Trust | 1,23% | 5 830 NS | 29 maja 2026 | N-PORT |
| LCOW · Pacer Funds Trust | 1,22% | 1 466 NS | 30 kwietnia 2026 | N-PORT |
| FTLS · First Trust Exchange-Traded Fund III | 1,18% | 141 986 NS | 30 kwietnia 2026 | N-PORT |
| FAS · Direxion Shares ETF Trust | 1,16% | 119 595 NS | 30 kwietnia 2026 | N-PORT |
| EQWL · Invesco Exchange-Traded Fund Trust | 1,13% | 149 009 SH | 21 sierpnia 2026 | Dziennie |
| CVY · Invesco Exchange-Traded Fund Trust | 1,09% | 6 381 SH | 21 sierpnia 2026 | Dziennie |
| FFLV · FIDELITY COVINGTON TRUST | 1,08% | 983 NS | 30 kwietnia 2026 | N-PORT |
| WBIG · Absolute Shares Trust | 1,08% | 1 474 NS | 30 czerwca 2026 | N-PORT |
| GMOV · GMO ETF Trust | 1,06% | 5 115 NS | 31 maja 2026 | N-PORT |
| UYG · ProShares Trust | 1,05% | 38 536 NS | 31 maja 2026 | N-PORT |
| FBCV · FIDELITY COVINGTON TRUST | 0,99% | 8 264 NS | 30 kwietnia 2026 | N-PORT |
| FDIV · EA Series Trust | 0,98% | 3 733 NS | 30 kwietnia 2026 | N-PORT |
| CGMM · Capital Group Equity ETF Trust I | 0,97% | 144 810 NS | 31 maja 2026 | N-PORT |
| SPHB · Invesco Exchange-Traded Fund Trust … | 0,93% | 46 006 SH | 21 sierpnia 2026 | Dziennie |
| FCFY · First Trust Exchange-Traded Fund | 0,92% | 62 NS | 30 czerwca 2026 | N-PORT |
| LRGC · AB Active ETFs, Inc. | 0,90% | 59 732 NS | 31 maja 2026 | N-PORT |
| VAMO · Cambria ETF Trust | 0,87% | 3 764 NS | 30 kwietnia 2026 | N-PORT |
| FLRG · FIDELITY COVINGTON TRUST | 0,86% | 12 663 NS | 30 kwietnia 2026 | N-PORT |
| VLUE · iShares Trust | 0,84% | 386 975 SH | 21 sierpnia 2026 | Dziennie |
| IXG · iShares Trust | 0,83% | 26 967 SH | 21 sierpnia 2026 | Dziennie |
| ROPE · EA Series Trust | 0,82% | 369 NS | 29 maja 2026 | N-PORT |
| SNPV · DBX ETF Trust | 0,80% | 9 792 NS | 29 maja 2026 | N-PORT |
| BKDV · BNY Mellon ETF Trust II | 0,79% | 57 258 NS | 30 kwietnia 2026 | N-PORT |
| JOET · Virtus ETF Trust II | 0,78% | 9 635 NS | 30 kwietnia 2026 | N-PORT |
| BSCR · Invesco Exchange-Traded Self-Indexe… | 0,76% | 34 601 000 | 21 sierpnia 2026 | Dziennie |