
J Jacobs Solutions Inc. Common Stock
NYSE · Professional Services · 在 SEC EDGAR 上查看 ↗ 10-K/10-Q 八月 4, 2026J 股票快照 价格、市值、P/E、EPS、ROE、负债/权益、52周范围
J 股价图表 包含技术指标的日 OHLCV — 平移、缩放和自定义您的视图
柱状图粒度会根据所选周期进行调整 — 将鼠标悬停在图表上可查看柱状图的开盘价/最高价/最低价/收盘价。
| 除息日 | 拆股 | 类型 |
|---|---|---|
| 2025年5月16日 | 101-for-100 | 正向 |
| 2024年9月30日 | 1197-for-1000 | 正向 |
| 2007年3月16日 | 2-for-1 | 正向 |
| 2002年4月2日 | 2-for-1 | 正向 |
| 1991年5月29日 | 2-for-1 | 正向 |
| 1990年4月3日 | 2-for-1 | 正向 |
| 1981年3月17日 | 3-for-2 | 正向 |
关于 Jacobs Solutions Inc. Common Stock 公司概况(来自维基百科)
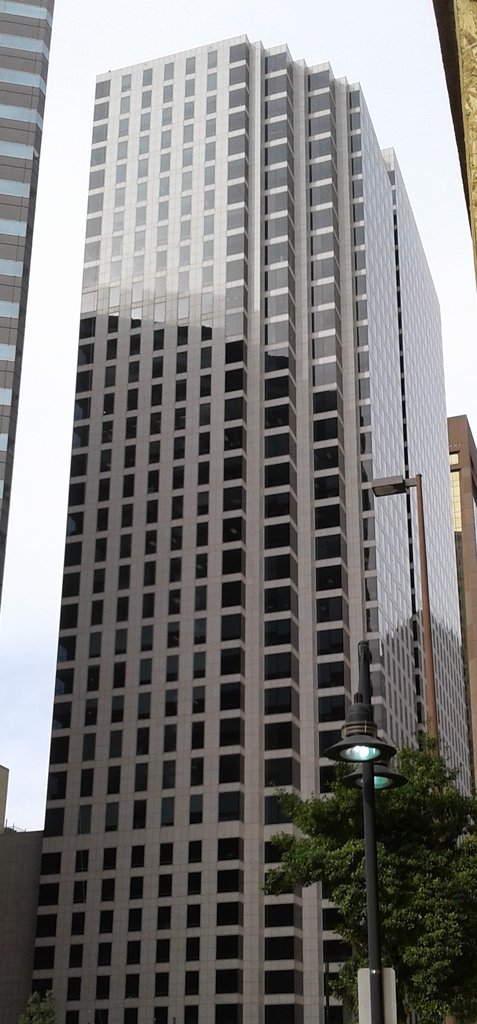
Jacobs Solutions Inc. is an American international technical professional services firm based in Dallas. The company provides engineering, technical, professional, and construction services as well as scientific and specialty consulting for a broad range of clients globally, including companies, organizations, and government agencies. Jacobs has consistently ranked No. 1 on both Engineering News-Record (ENR)'s 2018, 2019, 2020, 2021, 2022, and 2023 Top 500 Design Firms and Trenchless Technology's 2018, 2019, 2020, and 2021 Top 50 Trenchless Engineering Firms. Its worldwide annual revenue were over $12 billion in the 2025 fiscal year, and earnings dropped to $289 million.
Overview
Jacobs Engineering was founded in 1947, by Joseph J. Jacobs. The company's chief executive officer is Bob Pragada. He has been the CEO since January 2023. Steve Demetriou, the CEO from 2015 to 2023, now serves as the executive chair. The previous president and CEO was Craig L. Martin from 2006 until 2014.
The company is publicly traded as a Fortune 500 company. As of September 2018, Jacobs had more than 80,800 employees globally, and more than 400 offices in North America, South America, Europe, the Middle East, Australia, Africa, and Asia. In October 2016, the company moved its headquarters from Pasadena, California, to Dallas.
On August 9, 2017, the Pentagon awarded a $4.6 billion Integrated Research & Development for Enterprise Solutions (IRES) follow-on contract to Jacobs Technology Inc, a unit of Jacobs Engineering Group Inc. to provide products and services for the Missile Defense Agency and its Missile Defense Integration and Operations Center. In October 2018, Jacobs agreed to sell its Energy, Chemicals and Resources (ECR) segment to WorleyParsons. In April 2021, the Institute on Taxation and Economic Policy listed the top 55 corporations which paid $0 in taxes for the year 2020. Jacobs' federal income taxes for that year were negative $37 million for an effective tax rate of −17.4%.
As of 2023, the company forms part of the Dow Jones Sustainability Indices. In 2024, Jacobs spun-off its Critical Mission Solutions and Cyber and Intelligence Government Services businesses which merged with privately held Amentum Government Services Holding LLC to create a new, publicly traded company, Amentum.
Acquisitions
On December 10, 1998, it was announced that Jacobs would acquire closely held engineering firm, Sverdrup Corporation for $200 million. In 2001, Jacobs acquired the international operations, including the international consultancy Sir Alexander Gibb & Partners (Gibb Ltd) based in the UK, from Law Engineering and Environmental Services in Atlanta.
In FY 2007, Jacobs acquired the privately held planning, engineering and design firm, Edwards and Kelcey of Morristown, New Jersey, for an undisclosed amount. In FY 2008, Jacobs spent $264 million to acquire Carter and Burgess, Lindsey Engineering and a 60% stake in Zamel and Turbag Consulting Engineers. In FY 2010, Jacobs acquired TechTeam, Tybrin, and Jordan, Jones and Goulding. They paid $259.5 million for the three companies.
In FY 2014, Jacobs announced it completed a merger transaction with Sinclair Knight Merz (SKM), a 6,900-person professional services firm headquartered in Sydney. The purchase price was an enterprise value of AUS$1.2 billion (US$1.1 billion) plus adjustments for cash, debt and other items. On August 2, 2017, Jacobs acquired CH2M based in Englewood, Colorado– an engineering firm in infrastructure and government service sectors, including water, transportation, environmental and nuclear, in a $3.27 billion cash-and-stock deal.
In March 2020, Jacobs acquired Wood Nuclear, the nuclear services arm of John Wood Group of the UK, for £250 million, adding 2000 staff. Jacobs' total UK workforce was now almost 11,000. In December 2020, Jacobs announced it would be investing in PA Consulting based in London, in a deal valued at £1.825 billion. Completion of the deal was expected to take place by the end of Q1 2021. On February 7, 2022, Jacobs announced that it would enter into a joint venture with the Qatar based entity Locus Engineering Management and Services Co. W.L.L, an Asset Management company with interests in building maintenance, infrastructure, oil and gas support services, and engineering. The terms of the venture were not disclosed.
Controversies
Kingston coal ash cleanup
The Kingston Fossil Plant coal fly ash slurry spill was an environmental and industrial disaster which occurred on Monday December 22, 2008, when a dike ruptured at a coal ash pond at the Tennessee Valley Authority's Kingston Fossil Plant in Harriman, Tennessee releasing 1.1 billion U.S. gallons (4.2 million cubic meters) of coal fly ash slurry. The Tennessee Valley Authority hired Jacobs Engineering to clean up the spill. In the years after the spill at the cleanup site, a number of workers suffered health effects.
As early as 2012, workers began to report illnesses which they believed were caused by the cleanup, and by the ten year anniversary of the event, hundreds of workers had been sickened and more than 30 had died. In May 2023, it was reported that more than 50 workers had died and 150 were sick. In 2013, 50 workers and their families filed a lawsuit against contractor Jacobs Engineering. They were represented by Knoxville lawyer James K. Scott and the lawsuit was dismissed by judge Thomas A. Varlan, chief justice for the U.S. District Court for the Eastern District of Tennessee in 2014. This ruling was reversed by the U.S. Court of Appeals for the Sixth Circuit after evidence was discovered that Jacobs Engineering had misled the workers about the dangers of coal ash.
A federal jury ruled in favor of the workers seeking compensation in November 2018. The ruling held that Jacobs Engineering had failed to keep the workers safe from environmental hazards, and had misled them about the dangers of coal ash, mainly by claiming that extra protective equipment, such as masks and protective clothing, was unnecessary. In a phase two of the trial, the Kingston cleanup workers will be able to seek damages. In April 2020, 52 workers rejected a $10 million settlement offered by Jacobs Engineering.
Hinkley Point
Jacobs Engineering is building the Hinkley Point C nuclear reactor, controversial for the reason of its excessive delays and cost overruns. “It’s three times over cost and three times over time where it’s been built in Finland and France,” said Paul Dorfman of UCL (University College London) Energy Institute. The companies involved have been accused of a conflict of interest as the company advising the UK about cost management was owned by Jacobs Engineering, while Jacobs was working for the company managing an Électricité de France project. Thus, a subsidiary of a company hired by EDF was advising the UK how much money to grant EDF.
Woonsocket Regional Wastewater Treatment Facility
The Rhode Island Department of Environmental Management is investigating the WRWTF plant, which is run by Jacobs, for spillage of an estimated 10 million gallons of wastewater with incomplete treatment into the Blackstone River in June 2022. Previous investigations resulted in letters of noncompliance given to Jacobs in 2021 and 2020.
来源:维基百科 (英语), CC BY-SA 4.0 · 在维基百科上查看 ↗
10年表现 收入、净利润、利润率和每股收益趋势
估值 P/E、P/S、P/B、EV/EBITDA 比率 — 该股票是昂贵还是便宜?
| 指标 | 5年趋势 | J | 5年均值 | 同行中位数 | 结论 |
|---|---|---|---|---|---|
| P/E (TTM) | 52.25年均值 ≈31.3 | ≈31.3 | 22.2 | 估值过高 | |
| P/S (TTM) | 1.25年均值 ≈1.3 | ≈1.3 | 1.4 | 低估 | |
| 市净率 (MRQ) | 5.35年均值 ≈3.0 | ≈3.0 | 3.5 | 估值过高 | |
| EV / EBITDA (企业价值 / EBITDA) | 21.45年均值 ≈19.9 | ≈19.9 | 15.0 | 估值过高 | |
| 股价/自由现金流 (TTM) | 26.75年均值 ≈23.7 | ≈23.7 | · | · | |
| 市现率 (TTM) | 23.45年均值 ≈19.8 | ≈19.8 | 16.2 | 估值过高 | |
| EV / Revenue (市值/营收) | 1.55年均值 ≈1.4 | ≈1.4 | · | · | |
| EV / FCF (市值/自由现金流) | 30.45年均值 ≈26.7 | ≈26.7 | · | · | |
| 市净率(有形资产) (MRQ) | 6.5 | · | · | · |
同行中位数按每项指标的标准化基础计算,可能与本股票显示的TTM/MRQ基础不完全匹配。
盈利能力 毛利率、营业利润率和净利率;股本回报率 (ROE)、资产回报率 (ROA)、投入资本回报率 (ROIC)
| 指标 | 5年趋势 | J | 5年均值 | 同行中位数 | 结论 |
|---|---|---|---|---|---|
| 毛利率 (TTM) | 22.1%5年均值 ≈22.9% | ≈22.9% | · | · | |
| 营业利润率 (TTM) | 4.6%5年均值 ≈6.2% | ≈6.2% | 10.6% | 弱 | |
| EBITDA Margin (息税折旧摊销前利润率) | 7.2%5年均值 ≈6.2% | ≈6.2% | 10.6% | 弱 | |
| 税前利润率 (TTM) | 3.6%5年均值 ≈5.5% | ≈5.5% | 8.5% | 弱 | |
| 净利润率 (TTM) | 2.4%5年均值 ≈4.2% | ≈4.2% | 7.1% | 弱 | |
| ROA (TTM) | 2.9%5年均值 ≈4.2% | ≈4.2% | 6.2% | 弱 | |
| ROE (TTM) | 9.6%5年均值 ≈10.2% | ≈10.2% | 18.7% | 弱 | |
| ROIC | 8.9%5年均值 ≈7.8% | ≈7.8% | 17.2% | 弱 |
财务健康 债务、流动性、偿付能力 — 资产负债表强度
| 指标 | 5年趋势 | J | 5年均值 | 同行中位数 | 结论 |
|---|---|---|---|---|---|
| 负债/股东权益比率 (MRQ) | 1.15年均值 ≈0.5 | ≈0.5 | 1.1 | 持平 | |
| 流动比率 (MRQ) | 1.35年均值 ≈1.3 | ≈1.3 | 1.4 | 低流动性 | |
| Quick Ratio (速动比率) | 1.35年均值 ≈1.2 | ≈1.2 | 1.2 | 持平 | |
| 长期负债/股东权益 (MRQ) | 1.15年均值 ≈0.5 | ≈0.5 | 1.1 | 持平 |
成长 营收、每股收益 (EPS) 和净利润增长:同比、3年复合年增长率 (CAGR)、5年复合年增长率 (CAGR)
| 指标 | 5年趋势 | J | 5年均值 | 同行中位数 | 结论 |
|---|---|---|---|---|---|
| Revenue YoY (营收同比增长) | 4.6%5年均值 ≈-1.0% | ≈-1.0% | · | · | |
| Revenue CAGR 3Y (营收3年复合年增长率) | 7.1%5年均值 ≈-2.2% | ≈-2.2% | · | · | |
| Revenue CAGR 5Y (营收5年复合年增长率) | -2.4% | · | · | · | |
| EPS YoY | -62.3%5年均值 ≈1.0% | ≈1.0% | · | · | |
| Net Income YoY (净利润同比增长) | -64.1%5年均值 ≈-1.5% | ≈-1.5% | · | · | |
| EPS CAGR 3Y (每股收益年复合增长率(3年)) | -21.8%5年均值 ≈5.4% | ≈5.4% | · | · | |
| EPS CAGR 5Y (每股收益年复合增长率(5年)) | -8.5% | · | · | · | |
| Net Income CAGR 3Y (净利润年复合增长率(3年)) | -23.4%5年均值 ≈2.1% | ≈2.1% | · | · | |
| Net Income CAGR 5Y (净利润年复合增长率(5年)) | -10.1% | · | · | · |
资本效率 资产周转率、库存周转率、应收账款周转率
| 指标 | 5年趋势 | J | 5年均值 | 同行中位数 | 结论 |
|---|---|---|---|---|---|
| Asset Turnover (资产周转率) | 1.05年均值 ≈1.0 | ≈1.0 | 1.1 | 持平 | |
| Receivables Turnover (应收账款周转率) | 4.15年均值 ≈4.5 | ≈4.5 | 6.3 | 弱 | |
| Revenue / Employee (年营业收入 ÷ 员工人数(报告的 headcount,yfinance)。衍生数据 — 非存储的 SEC-XBRL 概念。) | ≈$256.0K | · | · | · |
价值 · ≈ 5年均值 · 行业中值 · 相对于中值的评判
股息 收益率、派息率、股息历史、5年CAGR
| 除息日 | 金额 | 货币 | 收益率 |
|---|---|---|---|
| 八月 21, 2026 | $0.36 | USD | ≈0.93% |
| 五月 22, 2026 | $0.36 | USD | ≈1.2% |
| 二月 20, 2026 | $0.36 | USD | ≈0.96% |
| 十二月 2, 2025 | $0.32 | USD | ≈0.95% |
| 八月 22, 2025 | $0.32 | USD | ≈0.84% |
| 五月 23, 2025 | $0.32 | USD | ≈0.92% |
| 二月 21, 2025 | $0.32 | USD | ≈0.85% |
| 十月 25, 2024 | $0.29 | USD | ≈0.72% |
| 七月 26, 2024 | $0.24 | USD | ≈0.77% |
| 五月 23, 2024 | $0.24 | USD | ≈0.79% |
| 二月 22, 2024 | $0.24 | USD | ≈0.73% |
| 十月 26, 2023 | $0.22 | USD | ≈0.78% |
| 七月 27, 2023 | $0.22 | USD | ≈0.98% |
| 五月 25, 2023 | $0.22 | USD | ≈1.1% |
| 二月 23, 2023 | $0.22 | USD | ≈0.98% |
| 九月 29, 2022 | $0.19 | USD | ≈1.0% |
| 七月 28, 2022 | $0.19 | USD | ≈0.66% |
| 五月 26, 2022 | $0.19 | USD | ≈0.64% |
| 二月 24, 2022 | $0.19 | USD | ≈0.72% |
| 十月 14, 2021 | $0.17 | USD | ≈0.62% |
收益历史 每股收益实际值 vs 预估值,惊喜%,达标率,下次财报日期
| 期间 | 报告 | EPS Actual | EPS 预期 | 惊喜 |
|---|---|---|---|---|
| 2026年6月30日 | 八月 11, 2026 | $1.84 | $1.87 | -1.5% |
| 2026年3月31日 | $1.75 | $1.67 | 5.0% | |
| 2025年12月31日 | $1.53 | $1.55 | -1.0% | |
| 2025年9月30日 | $1.75 | $1.71 | 2.1% | |
| 2025年6月30日 | $1.62 | $1.58 | 2.8% | |
| 2025年3月31日 | $1.43 | $1.42 | 0.96% |
完整基本面 所有年度指标 — 损益表、资产负债表、现金流量表
损益表
| 指标 | 趋势 | 2025 | 2024 | 2023 | 2022 | 2021 | 2020 | 2019 | 2018 | 2017 | 2016 | 2015 | 2014 |
|---|---|---|---|---|---|---|---|---|---|---|---|---|---|
| Revenue | $12.03B | $11.50B | $10.85B | $9.78B | $14.09B | $13.57B | $12.74B | $10.58B | $6.33B | $10.96B | $12.11B | $12.70B | |
| Cost of Revenue | $9.04B | $8.67B | $8.14B | $7.20B | $11.05B | $10.98B | $10.26B | $8.42B | $5.07B | $9.20B | · | · | |
| Gross Profit | $2.98B | $2.83B | $2.71B | $2.58B | $3.04B | $2.59B | $2.48B | $2.16B | $1.26B | $1.77B | · | · | |
| SG&A Expense | $2.12B | $2.14B | $2.03B | $2.04B | $2.36B | $2.05B | $2.07B | $1.77B | $1.02B | $1.43B | $1.52B | $1.55B | |
| Operating Income | $864M | $692M | $676M | $540M | $688M | $536M | $405M | $387M | $244M | $339M | $446M | $528M | |
| Interest Expense | · | · | $168M | $100M | $73M | $62M | $84M | $77M | $12M | $15M | $20M | $11M | |
| Interest Income | $36M | $34M | $25M | $4M | $4M | $5M | $9M | $9M | $9M | $8M | $7M | $10M | |
| Other Non-op | $-190M | $219M | $-12M | $33M | $77M | $-37M | $20M | $11M | $2M | $-3M | $-240.0K | $4M | |
| Pretax Income | $543M | $777M | $521M | $477M | $696M | $441M | $351M | $331M | $243M | $287M | $430M | $542M | |
| Income Tax | $216M | $131M | $101M | $66M | $275M | $55M | $37M | $326M | $73M | $72M | $101M | $190M | |
| Net Income | $289M | $806M | $666M | $644M | $477M | $492M | $848M | $163M | $294M | $210M | $303M | $328M | |
| EPS (Basic) | $2.39 | $6.35 | $5.32 | $5.01 | $3.22 | $3.74 | $6.14 | $1.18 | $2.43 | $1.75 | $2.42 | $2.51 | |
| EPS (Diluted) | $2.38 | $6.32 | $5.30 | $4.98 | $3.20 | $3.71 | $6.08 | $1.18 | $2.42 | $1.73 | $2.40 | $2.48 | |
| Shares (Basic) | 121,468,000 | 125,324,000 | 126,607,000 | 128,665,000 | 130,194,000 | 131,514,000 | 137,907,000 | 137,536,000 | 119,370,000 | 120,133,000 | 125,007,000 | 130,483,000 | |
| Shares (Diluted) | 121,932,000 | 125,881,000 | 127,214,000 | 129,445,000 | 131,274,000 | 132,721,000 | 139,206,000 | 137,536,000 | 120,147,000 | 121,483,000 | 126,110,000 | 132,371,000 | |
| EBITDA | $864M | $692M | $1.08B | $918M | $688M | $536M | $405M | $648M | $392M | $339M | $446M | $528M |
资产负债表
| 指标 | 趋势 | 2025 | 2024 | 2023 | 2022 | 2021 | 2020 | 2019 | 2018 | 2017 | 2016 | 2015 | 2014 |
|---|---|---|---|---|---|---|---|---|---|---|---|---|---|
| Cash & Equivalents | $1.24B | $1.14B | $771M | $1.14B | $1.01B | $862M | $631M | $635M | $608M | $656M | $461M | $733M | |
| Receivables | $2.99B | $2.85B | $2.43B | $3.41B | $3.10B | $3.17B | $2.84B | $2.51B | $2.10B | $2.12B | $2.55B | $2.87B | |
| Prepaid Expense | $135M | $156M | $141M | $176M | $176M | $162M | $189M | $171M | $119M | $93M | $113M | $122M | |
| Current Assets | $4.36B | $4.90B | $4.69B | $4.72B | $4.29B | $4.54B | $4.11B | $4.56B | $3.00B | $2.86B | $3.12B | $3.89B | |
| PP&E (Net) | $312M | $316M | $280M | $347M | $353M | $319M | $308M | $258M | $350M | $320M | $381M | $457M | |
| PP&E (Gross) | $969M | $921M | $800M | $905M | $863M | $787M | $805M | $713M | $980M | $898M | $991M | $1.09B | |
| Accum. Depreciation | $657M | $605M | $520M | $558M | $510M | $468M | $497M | $455M | $630M | $578M | $609M | $636M | |
| Goodwill | $4.78B | $4.79B | $4.64B | $7.18B | $7.20B | $5.64B | $5.43B | $4.80B | $3.01B | $3.08B | $3.05B | $3.03B | |
| Intangibles | $718M | $875M | $951M | $1.39B | $1.57B | $658M | $665M | $573M | $333M | $337M | $353M | $440M | |
| Other Non-current Assets | $6.58B | $6.55B | $9.65B | $9.59B | $9.99B | $7.50B | $7.04B | $7.83B | $4.03B | $4.18B | $4.28B | $638M | |
| Total Assets | $11.25B | $11.76B | $14.62B | $14.66B | $14.63B | $12.35B | $11.46B | $12.65B | $7.38B | $7.36B | $7.79B | $8.45B | |
| Accounts Payable | $1.26B | $1.03B | $922M | $967M | $908M | $1.06B | $1.07B | $776M | $684M | $522M | $567M | $623M | |
| Accrued Liabilities | $1.04B | $1.09B | $975M | $1.44B | $1.53B | $1.25B | $1.39B | $1.17B | $940M | $938M | $1.09B | $1.28B | |
| Short-term Debt | · | · | · | · | $53M | $0 | · | · | · | · | · | · | |
| Current Liabilities | $3.35B | $4.08B | $3.42B | $3.25B | $3.21B | $2.94B | $3.07B | $3.15B | $1.93B | $1.78B | $1.98B | $2.35B | |
| Capital Leases | $362M | $408M | $466M | $607M | $758M | $735M | $0 | · | · | · | · | · | |
| Deferred Tax | $152M | $117M | $121M | $269M | $214M | $3M | $233M | · | · | · | · | · | |
| Long-term Debt | $2.24B | $2.22B | $2.87B | $3.41B | $2.89B | $1.68B | · | · | · | · | · | · | |
| Total Debt | $2.24B | $2.22B | $2.87B | $3.41B | $2.89B | $1.68B | $1.20B | $2.15B | $235M | $385M | $584M | $764M | |
| Common Stock | $119M | $124M | $126M | $127M | $129M | $130M | $133M | $142M | $120M | $121M | $123M | $132M | |
| Paid-in Capital | · | · | · | · | · | · | · | · | · | · | $1.14B | $1.17B | |
| Retained Earnings | $1.53B | $2.37B | $4.54B | $4.23B | $4.02B | $4.02B | $3.94B | $3.81B | $3.72B | $3.59B | $3.50B | $3.53B | |
| AOCI | $-710M | $-699M | $-858M | $-975M | $-794M | $-933M | $-917M | $-807M | $-654M | $-611M | $-465M | $-364M | |
| Stockholders' Equity | $3.64B | $4.55B | $6.55B | $6.06B | $5.94B | $5.82B | $5.71B | $5.85B | $4.43B | $4.27B | $4.29B | $4.47B | |
| Liabilities + Equity | $11.25B | $11.76B | $14.62B | $14.66B | $14.63B | $12.35B | $11.46B | $12.65B | $7.38B | $7.36B | $7.79B | $8.45B | |
| Shares Outstanding | 119,081,294 | 124,084,028 | 125,976,998 | 127,393,378 | 128,892,540 | 129,747,783 | 132,879,395 | 142,217,933 | 120,385,544 | 120,950,899 | 123,152,966 | 131,752,768 |
现金流
| 指标 | 趋势 | 2025 | 2024 | 2023 | 2022 | 2021 | 2020 | 2019 | 2018 | 2017 | 2016 | 2015 | 2014 |
|---|---|---|---|---|---|---|---|---|---|---|---|---|---|
| D&A | $82M | $99M | $103M | $102M | $101M | $91M | $90M | $118M | $76M | $82M | $100M | $99M | |
| Stock-based Comp | $61M | $74M | $74M | $53M | $56M | $48M | $69M | $79M | $39M | $32M | $41M | $43M | |
| Deferred Tax | $-99M | $-119M | $-72M | $106M | $114M | $56M | $-52M | $256M | $34M | $-27M | $-31M | $31M | |
| Amort. of Intangibles | $156M | $153M | $147M | $199M | $150M | $91M | $79M | $81M | $46M | $48M | $49M | $47M | |
| Restructuring | $61M | $135M | $86M | $26M | $100M | $324M | $311M | $191M | $99M | $188M | $157M | $93M | |
| Operating Cash Flow | $687M | $1.05B | $975M | $475M | $726M | $807M | $-366M | $481M | $575M | $680M | $485M | $722M | |
| CapEx | $79M | $121M | $137M | $128M | $93M | $118M | $136M | $95M | $118M | $68M | $88M | $132M | |
| Investing Cash Flow | $-75M | $-127M | $-146M | $-538M | $-1.38B | $-429M | $2.15B | $-1.58B | $-236M | $-140M | $-96M | $-1.52B | |
| Debt Issued | $2.46B | $4.61B | $3.86B | $3.15B | $4.45B | $2.99B | $2.78B | $5.78B | $1.69B | $1.65B | $1.77B | $820M | |
| Net Debt Issued | $986M | $1.24B | $-626M | $725M | $1.23B | $465M | $-1.21B | $1.21B | $-153M | $-191M | $-138M | $364M | |
| Stock Issued | $35M | $48M | $48M | $51M | $38M | $37M | $65M | $54M | $63M | $43M | $33M | $45M | |
| Stock Repurchased | $754M | $403M | $266M | $282M | $275M | $337M | $854M | $3M | $97M | $153M | $422M | $78M | |
| Net Stock Activity | $-719M | $-355M | $-218M | $-231M | $-237M | $-300M | $-789M | $51M | $-35M | $-109M | $-389M | $-34M | |
| Dividends Paid | $153M | $143M | $128M | $116M | $107M | $98M | $106M | $87M | $59M | $6M | · | · | |
| Financing Cash Flow | $-525M | $-752M | $-1.09B | $320M | $799M | $-208M | $-1.97B | $1.14B | $-243M | $-317M | $-553M | $305M | |
| Net Change in Cash | $90M | $217M | $-225M | $128M | $164M | $231M | $-162M | $19M | $118M | $195M | $-272M | $-524M | |
| Free Cash Flow | $607M | $934M | $837M | $347M | $633M | $689M | $-502M | $386M | $457M | $612M | · | · | |
| Levered FCF | · | · | $705M | $265M | $589M | $634M | $-577M | $362M | $448M | $601M | · | · |
盈利能力
| 指标 | 趋势 | 2025 | 2024 | 2023 | 2022 | 2021 | 2020 | 2019 | 2018 | 2017 | 2016 | 2015 | 2014 |
|---|---|---|---|---|---|---|---|---|---|---|---|---|---|
| Gross Margin | 24.8% | 24.6% | 21.2% | 22.3% | 21.6% | 19.1% | 19.4% | 18.9% | · | · | · | · | |
| Operating Margin | 7.2% | 6.0% | 6.6% | 6.2% | 4.9% | 4.0% | 3.2% | 4.3% | 3.9% | 3.1% | 3.7% | 4.2% | |
| Net Margin | 2.4% | 7.0% | 4.1% | 4.3% | 3.4% | 3.6% | 6.7% | 1.1% | 2.9% | 1.9% | 2.5% | 2.6% | |
| Pretax Margin | 4.5% | 6.8% | 5.6% | 5.9% | 4.9% | 3.2% | 2.8% | 3.7% | 3.9% | 2.6% | 3.5% | 4.3% | |
| EBITDA Margin | 7.2% | 6.0% | 6.6% | 6.2% | 4.9% | 4.0% | 3.2% | 4.3% | 3.9% | 3.1% | 3.7% | 4.2% | |
| ROA | 2.5% | 6.1% | 4.5% | 4.4% | 3.5% | 4.1% | 7.0% | 1.6% | 4.0% | 2.8% | 3.7% | 4.2% | |
| ROE | 7.1% | 14.5% | 10.6% | 10.7% | 8.1% | 8.5% | 14.7% | 3.2% | 6.8% | 4.9% | 6.9% | 7.6% | |
| ROIC | 8.9% | 8.5% | 9.0% | 7.9% | 4.7% | 6.3% | 5.2% | 2.5% | 6.2% | 5.5% | 7.0% | 6.6% |
流动性与偿付能力
| 指标 | 趋势 | 2025 | 2024 | 2023 | 2022 | 2021 | 2020 | 2019 | 2018 | 2017 | 2016 | 2015 | 2014 |
|---|---|---|---|---|---|---|---|---|---|---|---|---|---|
| Current Ratio | 1.3 | 1.2 | 1.4 | 1.5 | 1.3 | 1.5 | 1.3 | 1.4 | 1.6 | 1.6 | 1.7 | 1.7 | |
| Quick Ratio | 1.3 | 1.0 | 1.3 | 1.4 | 1.3 | 1.4 | 1.1 | 1.4 | 1.5 | 1.6 | 1.5 | 1.5 | |
| Debt / Equity | 0.6 | 0.5 | 0.4 | 0.6 | 0.5 | 0.3 | 0.2 | 0.4 | 0.1 | 0.1 | 0.1 | 0.2 | |
| LT Debt / Equity | 0.6 | 0.3 | 0.4 | 0.6 | 0.5 | 0.3 | 0.2 | 0.4 | 0.1 | 0.1 | 0.1 | 0.2 | |
| Interest Coverage | · | · | 6.4 | 9.2 | 9.5 | 8.6 | 4.8 | 8.4 | 32.6 | 22.2 | 22.8 | 46.2 |
效率
| 指标 | 趋势 | 2025 | 2024 | 2023 | 2022 | 2021 | 2020 | 2019 | 2018 | 2017 | 2016 | 2015 | 2014 |
|---|---|---|---|---|---|---|---|---|---|---|---|---|---|
| Asset Turnover | 1.0 | 0.9 | 1.1 | 1.0 | 1.0 | 1.1 | 1.1 | 1.5 | 1.4 | 1.4 | 1.5 | 1.6 | |
| Receivables Turnover | 4.1 | 4.4 | 4.7 | 4.6 | 4.5 | 4.5 | 4.8 | 5.3 | 4.8 | 4.7 | 4.5 | 4.7 |
每股
| 指标 | 趋势 | 2025 | 2024 | 2023 | 2022 | 2021 | 2020 | 2019 | 2018 | 2017 | 2016 | 2015 | 2014 |
|---|---|---|---|---|---|---|---|---|---|---|---|---|---|
| Book Value / Share | $30.57 | $36.61 | $51.96 | $47.57 | $46.09 | $44.82 | $43.01 | $41.16 | $36.78 | $35.26 | $34.85 | $33.92 | |
| Revenue / Share | $98.66 | $91.36 | $128.54 | $115.28 | $107.35 | $102.22 | $91.50 | $108.03 | $83.42 | $90.25 | $96.07 | $95.91 | |
| Cash Flow / Share | $5.63 | $8.38 | $7.66 | $3.67 | $5.53 | $6.08 | $-2.63 | $3.47 | $4.78 | $5.60 | $3.84 | $5.45 | |
| Cash / Share | $10.37 | $9.21 | $7.36 | $8.95 | $7.87 | $6.65 | $4.75 | $5.58 | $6.43 | $5.42 | $3.74 | $5.56 | |
| Dividend / Share | · | · | $0.26 | · | · | $0.19 | · | · | · | · | · | · | |
| Dividend Paid / Share | · | · | · | · | · | · | $0.19 | $0.19 | · | · | · | · | |
| EPS (TTM) | $2.38 | $6.32 | $5.30 | $4.98 | $3.20 | $3.71 | $6.08 | $1.18 | $2.42 | $1.73 | $2.40 | $2.48 |
增长率
| 指标 | 趋势 | 2025 | 2024 | 2023 | 2022 | 2021 | 2020 | 2019 | 2018 | 2017 | 2016 | 2015 | 2014 |
|---|---|---|---|---|---|---|---|---|---|---|---|---|---|
| Revenue YoY | 4.6% | 6.0% | 10.9% | -30.6% | 3.9% | · | · | · | · | · | · | · | |
| Revenue CAGR 3Y | 7.1% | -6.6% | -7.2% | · | · | · | · | · | · | · | · | · | |
| Revenue CAGR 5Y | -2.4% | · | · | · | · | · | · | · | · | · | · | · | |
| EPS YoY | -62.3% | 19.2% | 6.4% | 55.6% | -13.8% | · | · | · | · | · | · | · | |
| EPS CAGR 3Y | -21.8% | 25.5% | 12.6% | · | · | · | · | · | · | · | · | · | |
| EPS CAGR 5Y | -8.5% | · | · | · | · | · | · | · | · | · | · | · | |
| Net Income YoY | -64.1% | 21.1% | 3.4% | 35.0% | -3.0% | · | · | · | · | · | · | · | |
| Net Income CAGR 3Y | -23.4% | 19.1% | 10.6% | · | · | · | · | · | · | · | · | · | |
| Net Income CAGR 5Y | -10.1% | · | · | · | · | · | · | · | · | · | · | · | |
| Dividends Paid CAGR 5Y | 9.3% | · | · | · | · | · | · | · | · | · | · | · |
估值 (TTM)
| 指标 | 趋势 | 2025 | 2024 | 2023 | 2022 | 2021 | 2020 | 2019 | 2018 | 2017 | 2016 | 2015 | 2014 |
|---|---|---|---|---|---|---|---|---|---|---|---|---|---|
| Revenue TTM | $12.03B | $11.50B | $10.85B | $9.78B | $14.09B | $13.57B | $12.74B | $10.58B | $6.33B | $10.96B | $12.11B | $12.70B | |
| Net Income TTM | $289M | $806M | $666M | $644M | $477M | $492M | $848M | $163M | $294M | $210M | $303M | $328M | |
| Market Cap | $17.61B | $15.98B | $14.22B | $11.43B | $14.36B | $10.11B | $9.97B | $9.00B | $5.80B | $5.17B | $3.81B | $5.41B | |
| Enterprise Value | $18.61B | $17.06B | $16.16B | $13.70B | $16.24B | $10.93B | $10.54B | $10.35B | $5.26B | $4.90B | $3.93B | $5.45B | |
| P/E | 62.1 | 20.4 | 21.3 | 18.0 | 34.8 | 21.0 | 12.3 | 53.6 | 19.9 | 24.7 | 12.9 | 16.6 | |
| P/S | 1.5 | 1.4 | 1.3 | 1.2 | 1.0 | 0.7 | 0.8 | 0.9 | 0.9 | 0.5 | 0.3 | 0.4 | |
| P/B | 4.8 | 3.5 | 2.2 | 1.9 | 2.4 | 1.7 | 1.7 | 1.5 | 1.3 | 1.2 | 0.9 | 1.2 | |
| P / Tangible Book | · | · | 15.0 | · | · | · | · | · | · | · | · | · | |
| P / Cash Flow | 25.6 | 15.2 | 14.6 | 24.1 | 19.8 | 12.5 | -27.2 | 18.7 | 10.1 | 7.6 | 7.9 | 7.5 | |
| P / FCF | 29.0 | 17.1 | 17.0 | 32.9 | 22.7 | 14.7 | -19.8 | 23.3 | 12.7 | 8.4 | · | · | |
| EV / EBITDA | 21.5 | 24.6 | 15.0 | 14.9 | 23.6 | 20.4 | 26.0 | 16.0 | 13.4 | 14.5 | 8.8 | 10.3 | |
| EV / FCF | 30.6 | 18.3 | 19.3 | 39.5 | 25.6 | 15.9 | -21.0 | 26.8 | 11.5 | 8.0 | · | · | |
| EV / Revenue | 1.5 | 1.5 | 1.5 | 1.4 | 1.2 | 0.8 | 0.8 | 1.0 | 0.8 | 0.4 | 0.3 | 0.4 | |
| Dividend Yield | 0.87% | 0.89% | 0.90% | 1.0% | 0.75% | 0.97% | 1.1% | 0.96% | 1.0% | 0.11% | · | · | |
| Earnings Yield | 1.6% | 4.9% | 4.7% | 5.5% | 2.9% | 4.8% | 8.1% | 1.9% | 5.0% | 4.0% | 7.8% | 6.0% | |
| Payout Ratio | 52.9% | 17.7% | 19.3% | 18.0% | 32.7% | 29.3% | 12.6% | 53.0% | 18.5% | · | · | · | |
| Annual Payout | $153M | $143M | $128M | $116M | $107M | $98M | $106M | $87M | $59M | $6M | · | · |
损益表
| 指标 | 趋势 | Q3 2026 | Q2 2026 | Q1 2026 | Q4 2025 | Q3 2025 | Q2 2025 | Q1 2025 | Q4 2024 | Q3 2024 | Q2 2024 | Q1 2024 | Q4 2023 | Q3 2023 | Q2 2023 | Q1 2023 | Q4 2022 |
|---|---|---|---|---|---|---|---|---|---|---|---|---|---|---|---|---|---|
| Revenue | $4.08B | $3.69B | $3.29B | $3.15B | $3.03B | $2.91B | $2.93B | $2.96B | $2.88B | $2.85B | $2.81B | $-1.21B | $2.79B | $2.68B | $2.55B | $-1.26B | |
| Cost of Revenue | $3.27B | $2.90B | $2.53B | $2.39B | $2.27B | $2.17B | $2.21B | $2.23B | $2.16B | $2.14B | $2.15B | $-1.36B | $3.33B | $3.19B | $2.98B | $-1.35B | |
| Gross Profit | $811M | $795M | $765M | $767M | $758M | $738M | $721M | $735M | $721M | $712M | $665M | $149M | $857M | $890M | $815M | $89M | |
| SG&A Expense | $524M | $876M | $533M | $555M | $523M | $530M | $513M | $539M | $550M | $529M | $523M | $270M | $587M | $600M | $577M | $158M | |
| Operating Income | $287M | $-81M | $233M | $212M | $235M | $209M | $208M | $196M | $171M | $183M | $142M | $-121M | $168M | $186M | $155M | $-69M | |
| Interest Expense | · | · | · | · | · | · | · | · | · | $44M | $43M | · | $44M | $41M | $40M | · | |
| Interest Income | $8M | $9M | $8M | $8M | $8M | $10M | $10M | $9M | $10M | $9M | $8M | $7M | $8M | $8M | $3M | $1M | |
| Other Non-op | $890.0K | $-18M | $287.0K | $5M | $39M | $-103M | $-130M | $225M | $2M | $-4M | $-3M | $3M | $-7M | $-5M | $-3M | $-18M | |
| Pretax Income | $241M | $-131M | $206M | $189M | $245M | $56M | $53M | $394M | $136M | $144M | $103M | $-156M | $125M | $149M | $115M | $-119M | |
| Income Tax | $105M | $-45M | $73M | $54M | $54M | $51M | $57M | $74M | $45M | $43M | $-32M | $-22M | $54M | $19M | $50M | $-55M | |
| Net Income | $137M | $-46M | $126M | $122M | $180M | $6M | $-18M | $325M | $147M | $162M | $172M | $149M | $164M | $217M | $136M | $225M | |
| EPS (Basic) | $1.16 | $-0.34 | $1.12 | $0.89 | $1.55 | $0.06 | $-0.11 | $2.52 | $1.17 | $1.29 | $1.37 | $1.24 | $1.29 | $1.71 | $1.07 | $1.76 | |
| EPS (Diluted) | $1.15 | $-0.34 | $1.12 | $0.88 | $1.55 | $0.06 | $-0.11 | $2.50 | $1.17 | $1.28 | $1.37 | $1.25 | $1.29 | $1.70 | $1.06 | $1.75 | |
| Shares (Basic) | 117,745,000 | 117,261,000 | 118,594,000 | · | 120,084,000 | 122,257,000 | 124,055,000 | · | 125,163,000 | 125,712,000 | 126,105,000 | · | 126,646,000 | 126,886,000 | 126,824,000 | · | |
| Shares (Diluted) | 118,898,000 | 117,261,000 | 119,006,000 | · | 120,491,000 | 122,624,000 | 124,055,000 | · | 125,616,000 | 126,211,000 | 126,813,000 | · | 127,138,000 | 127,359,000 | 127,496,000 | · | |
| EBITDA | $287M | $-81M | $233M | · | $235M | $209M | $208M | · | $260M | $281M | $204M | · | $270M | $290M | $238M | · |
资产负债表
| 指标 | 趋势 | Q3 2026 | Q2 2026 | Q1 2026 | Q4 2025 | Q3 2025 | Q2 2025 | Q1 2025 | Q4 2024 | Q3 2024 | Q2 2024 | Q1 2024 | Q4 2023 | Q3 2023 | Q2 2023 | Q1 2023 | Q4 2022 |
|---|---|---|---|---|---|---|---|---|---|---|---|---|---|---|---|---|---|
| Cash & Equivalents | $1.17B | $1.37B | $1.55B | $1.24B | $1.29B | $1.20B | $1.30B | $1.14B | $1.21B | $1.03B | $1.14B | · | $1.09B | $1.22B | $1.21B | · | |
| Receivables | $3.76B | $3.56B | $3.06B | $2.99B | $3.05B | $2.90B | $2.91B | $2.85B | $3.77B | $3.77B | $3.68B | · | $3.56B | $3.52B | $3.44B | · | |
| Prepaid Expense | $150M | $287M | $144M | $135M | $130M | $168M | $137M | $156M | $155M | $189M | $157M | · | $173M | $166M | $157M | · | |
| Current Assets | $5.09B | $5.21B | $4.76B | $4.36B | $4.47B | $4.44B | $4.95B | $4.90B | $5.14B | $5.00B | $4.98B | · | $4.82B | $4.91B | $4.81B | · | |
| PP&E (Net) | $312M | $303M | $307M | $312M | $303M | $294M | $293M | $316M | $366M | $341M | $353M | · | $378M | $367M | $357M | · | |
| PP&E (Gross) | · | · | · | $969M | · | · | · | $921M | · | · | · | · | · | · | · | · | |
| Accum. Depreciation | · | · | · | $657M | · | · | · | $605M | · | · | · | · | · | · | · | · | |
| Goodwill | $4.76B | $4.76B | $4.79B | $4.78B | $4.82B | $4.73B | $4.68B | $4.79B | $7.40B | $7.40B | $7.42B | · | $7.41B | $7.37B | $7.34B | · | |
| Intangibles | $604M | $640M | $684M | $718M | $771M | $775M | $795M | $875M | $1.16B | $1.21B | $1.27B | · | $1.35B | $1.38B | $1.41B | · | |
| Other Non-current Assets | $6.34B | $6.42B | $6.55B | $6.58B | $6.64B | $6.47B | $6.37B | $6.55B | $9.54B | $9.56B | $9.62B | · | $9.73B | $9.73B | $9.75B | · | |
| Total Assets | $11.74B | $11.94B | $11.61B | $11.25B | $11.41B | $11.21B | $11.61B | $11.76B | $15.05B | $14.90B | $14.95B | · | $14.94B | $15.00B | $14.92B | · | |
| Accounts Payable | $1.78B | $1.48B | $1.26B | $1.26B | $1.13B | $992M | $985M | $1.03B | $1.26B | $1.16B | $1.11B | · | $1.09B | $968M | $930M | · | |
| Accrued Liabilities | $1.04B | $1.11B | $1.04B | $1.04B | $978M | $911M | $1.01B | $1.09B | $1.30B | $1.20B | $1.38B | · | $1.24B | $1.32B | $1.37B | · | |
| Current Liabilities | $3.95B | $3.64B | $3.58B | $3.35B | $3.21B | $2.96B | $3.94B | $4.08B | $4.50B | $4.27B | $3.64B | · | $3.30B | $3.21B | $3.24B | · | |
| Capital Leases | $361M | $353M | $362M | $362M | $386M | $372M | $384M | $408M | $482M | $501M | $523M | · | $570M | $587M | $608M | · | |
| Deferred Tax | $142M | $140M | $148M | $152M | $151M | $144M | $143M | $117M | $147M | $150M | $154M | · | $289M | $302M | $298M | · | |
| Long-term Debt | · | · | · | $2.24B | $2.51B | $2.63B | $2.54B | $2.22B | $2.92B | $3.00B | $2.89B | · | $3.20B | $3.45B | $3.49B | · | |
| Total Debt | $3.58B | $4.08B | $2.49B | · | $2.51B | $2.63B | $2.54B | · | $2.92B | $3.00B | $2.89B | · | $3.20B | $3.45B | $3.49B | · | |
| Common Stock | $117M | $118M | $118M | $119M | $120M | $120M | $123M | $124M | $124M | $125M | $126M | · | $126M | $127M | $127M | · | |
| Retained Earnings | $946M | $963M | $1.33B | $1.53B | $1.66B | $1.82B | $2.18B | $2.37B | $4.56B | $4.58B | $4.60B | · | $4.46B | $4.39B | $4.23B | · | |
| AOCI | $-733M | $-716M | $-686M | $-710M | $-658M | $-780M | $-832M | $-699M | $-806M | $-811M | $-782M | · | $-772M | $-838M | $-846M | · | |
| Stockholders' Equity | $3.26B | $3.29B | $3.44B | $3.64B | $3.82B | $3.86B | $4.21B | $4.55B | $6.62B | $6.62B | $6.68B | · | $6.52B | $6.38B | $6.18B | · | |
| Liabilities + Equity | $11.74B | $11.94B | $11.61B | $11.25B | $11.41B | $11.21B | $11.61B | $11.76B | $15.05B | $14.90B | $14.95B | · | $14.94B | $15.00B | $14.92B | · | |
| Shares Outstanding | 117,132,889 | 118,190,953 | 117,586,748 | 119,081,294 | 119,704,769 | 120,379,245 | 122,912,389 | 124,084,028 | 124,253,511 | 125,216,293 | 125,599,058 | · | 125,880,738 | 126,805,092 | 126,668,513 | · |
现金流
| 指标 | 趋势 | Q3 2026 | Q2 2026 | Q1 2026 | Q4 2025 | Q3 2025 | Q2 2025 | Q1 2025 | Q4 2024 | Q3 2024 | Q2 2024 | Q1 2024 | Q4 2023 | Q3 2023 | Q2 2023 | Q1 2023 | Q4 2022 |
|---|---|---|---|---|---|---|---|---|---|---|---|---|---|---|---|---|---|
| D&A | $24M | $22M | $22M | $20M | $21M | $20M | $21M | $25M | $24M | $25M | $25M | $26M | $21M | $28M | $28M | $25M | |
| Stock-based Comp | $19M | $21M | $17M | $14M | $13M | $21M | $13M | $20M | $19M | $16M | $19M | $18M | $21M | $15M | $20M | $12M | |
| Amort. of Intangibles | $33M | $34M | $38M | $40M | $39M | $38M | $39M | $25M | $38M | $38M | $51M | $-5M | $52M | $50M | $50M | · | |
| Restructuring | $21M | $14M | $4M | $14M | $22M | $11M | $15M | · | $58M | $42M | $41M | · | $31M | $2M | $7M | · | |
| Operating Cash Flow | $456M | $-484M | $381M | $383M | $293M | $-96M | $107M | $197M | $483M | $-43M | $418M | $219M | $321M | $132M | $302M | $278M | |
| CapEx | $25M | $21M | $16M | $30M | $22M | $17M | $10M | $38M | $38M | $28M | $17M | $39M | $31M | $35M | $32M | $48M | |
| Investing Cash Flow | $-25M | $-16M | $-15M | $-29M | $-22M | $-16M | $-8M | $-32M | $-38M | $-41M | $-16M | $-39M | $-30M | $-28M | $-49M | $-47M | |
| Debt Issued | $205M | $3.13B | $719M | $285M | $325M | $1.26B | $589M | $2.38B | $508M | $1.18B | $540M | $1.53B | $254M | $793M | $1.28B | $632M | |
| Net Debt Issued | · | · | $245M | · | · | · | $368M | · | · | · | $-27M | · | · | · | $-7M | · | |
| Stock Issued | $9M | $9M | $8M | $9M | $8M | $9M | $8M | $12M | $13M | $11M | $11M | $10M | $13M | $11M | $15M | $10M | |
| Stock Repurchased | $142M | $220M | $252M | $101M | $101M | $351M | $202M | $56M | $151M | $95M | $100M | $145.0K | $125M | $0 | $141M | $31M | |
| Net Stock Activity | · | · | $-244M | · | · | · | $-194M | · | · | · | $-89M | · | · | · | $-126M | · | |
| Dividends Paid | $42M | $43M | $39M | $38M | $39M | $39M | $36M | $36M | $36M | $37M | $33M | $33M | $33M | $33M | $30M | $29M | |
| Financing Cash Flow | $-727M | $452M | $-60M | $-399M | $-233M | $-6M | $112M | $-259M | $-262M | $-22M | $-209M | $-316M | $-434M | $-90M | $-246M | $-142M | |
| Net Change in Cash | $-299M | $-65M | $317M | $-59M | $91M | $-95M | $154M | $-65M | $178M | $-123M | $228M | $-165M | $-131M | $12M | $59M | $40M | |
| Free Cash Flow | · | · | $365M | · | · | · | $97M | · | · | · | $401M | · | · | · | $270M | · | |
| Levered FCF | · | · | · | · | · | · | · | · | · | · | $353M | · | · | · | $240M | · |
盈利能力
| 指标 | 趋势 | Q3 2026 | Q2 2026 | Q1 2026 | Q4 2025 | Q3 2025 | Q2 2025 | Q1 2025 | Q4 2024 | Q3 2024 | Q2 2024 | Q1 2024 | Q4 2023 | Q3 2023 | Q2 2023 | Q1 2023 | Q4 2022 |
|---|---|---|---|---|---|---|---|---|---|---|---|---|---|---|---|---|---|
| Gross Margin | 19.9% | 21.5% | 23.2% | · | 25.0% | 25.4% | 24.6% | · | 21.7% | 21.2% | 20.4% | · | 20.5% | 21.8% | 21.4% | · | |
| Operating Margin | 7.0% | -2.2% | 7.1% | · | 7.8% | 7.2% | 7.1% | · | 6.2% | 6.6% | 4.9% | · | 6.4% | 7.1% | 6.3% | · | |
| Net Margin | 3.4% | -1.2% | 3.8% | · | 5.9% | 0.19% | -0.62% | · | 3.5% | 3.8% | 4.1% | · | 3.9% | 5.3% | 3.6% | · | |
| Pretax Margin | 5.9% | -3.5% | 6.3% | · | 8.1% | 1.9% | 1.8% | · | 5.3% | 5.7% | 4.0% | · | 5.4% | 6.2% | 5.2% | · | |
| EBITDA Margin | 7.0% | -2.2% | 7.1% | · | 7.8% | 7.2% | 7.1% | · | 6.2% | 6.6% | 4.9% | · | 6.4% | 7.1% | 6.3% | · | |
| ROA | 1.2% | -0.40% | 1.1% | · | 1.4% | 0.04% | -0.14% | · | 0.98% | 1.1% | 1.1% | · | 1.1% | 1.4% | 0.91% | · | |
| ROE | 3.9% | -1.3% | 3.3% | · | 3.4% | 0.11% | -0.33% | · | 2.2% | 2.5% | 2.7% | · | 2.6% | 3.5% | 2.2% | · | |
| ROIC | 2.4% | -0.72% | 2.5% | · | 2.9% | 0.30% | -0.23% | · | 1.9% | 2.1% | 2.3% | · | 2.1% | 2.7% | 1.8% | · |
流动性与偿付能力
| 指标 | 趋势 | Q3 2026 | Q2 2026 | Q1 2026 | Q4 2025 | Q3 2025 | Q2 2025 | Q1 2025 | Q4 2024 | Q3 2024 | Q2 2024 | Q1 2024 | Q4 2023 | Q3 2023 | Q2 2023 | Q1 2023 | Q4 2022 |
|---|---|---|---|---|---|---|---|---|---|---|---|---|---|---|---|---|---|
| Current Ratio | 1.3 | 1.4 | 1.3 | · | 1.4 | 1.5 | 1.3 | · | 1.1 | 1.2 | 1.4 | · | 1.5 | 1.5 | 1.5 | · | |
| Quick Ratio | 1.2 | 1.4 | 1.3 | · | 1.4 | 1.4 | 1.1 | · | 1.1 | 1.1 | 1.3 | · | 1.4 | 1.5 | 1.4 | · | |
| Debt / Equity | 1.1 | 1.2 | 0.7 | · | 0.7 | 0.7 | 0.6 | · | 0.4 | 0.5 | 0.4 | · | 0.5 | 0.5 | 0.6 | · | |
| LT Debt / Equity | 1.1 | 1.2 | 0.7 | · | 0.7 | 0.7 | 0.4 | · | 0.3 | 0.3 | 0.4 | · | 0.5 | 0.5 | 0.6 | · | |
| Interest Coverage | · | · | · | · | · | · | · | · | · | 6.4 | 4.7 | · | 6.2 | 7.1 | 5.9 | · |
效率
| 指标 | 趋势 | Q3 2026 | Q2 2026 | Q1 2026 | Q4 2025 | Q3 2025 | Q2 2025 | Q1 2025 | Q4 2024 | Q3 2024 | Q2 2024 | Q1 2024 | Q4 2023 | Q3 2023 | Q2 2023 | Q1 2023 | Q4 2022 |
|---|---|---|---|---|---|---|---|---|---|---|---|---|---|---|---|---|---|
| Asset Turnover | 0.4 | 0.3 | 0.3 | · | 0.2 | 0.2 | 0.2 | · | 0.3 | 0.3 | 0.3 | · | 0.3 | 0.3 | 0.3 | · | |
| Receivables Turnover | 1.2 | 1.1 | 1.1 | · | 0.9 | 0.9 | 0.9 | · | 1.2 | 1.2 | 1.2 | · | 1.2 | 1.2 | 1.2 | · |
每股
| 指标 | 趋势 | Q3 2026 | Q2 2026 | Q1 2026 | Q4 2025 | Q3 2025 | Q2 2025 | Q1 2025 | Q4 2024 | Q3 2024 | Q2 2024 | Q1 2024 | Q4 2023 | Q3 2023 | Q2 2023 | Q1 2023 | Q4 2022 |
|---|---|---|---|---|---|---|---|---|---|---|---|---|---|---|---|---|---|
| Book Value / Share | $27.87 | $27.86 | $29.29 | · | $31.93 | $32.10 | $34.21 | · | $53.25 | $52.90 | $53.17 | · | $51.81 | $50.31 | $48.82 | · | |
| Revenue / Share | $34.28 | $31.51 | $27.67 | · | $25.16 | $23.73 | $23.64 | · | $33.69 | $33.83 | $32.80 | · | $32.93 | $32.02 | $29.79 | · | |
| Cash Flow / Share | · | · | $3.20 | · | · | · | $0.87 | · | · | · | $3.30 | · | · | · | $2.37 | · | |
| Cash / Share | $10.01 | $11.61 | $13.21 | · | $10.80 | $10.01 | $10.57 | · | $9.73 | $8.25 | $9.09 | · | $8.68 | $9.65 | $9.56 | · | |
| Dividend / Share | $0.36 | $0.36 | $0.32 | $0.32 | $0.32 | $0.32 | $0.29 | $0.29 | $0.29 | $0.29 | · | $0.26 | $0.26 | $0.26 | · | · | |
| EPS (TTM) | $2.81 | $3.21 | $3.61 | · | $4.00 | $3.62 | $4.84 | · | $5.07 | $5.19 | $5.61 | · | $5.80 | $6.03 | $5.01 | · |
估值 (TTM)
| 指标 | 趋势 | Q3 2026 | Q2 2026 | Q1 2026 | Q4 2025 | Q3 2025 | Q2 2025 | Q1 2025 | Q4 2024 | Q3 2024 | Q2 2024 | Q1 2024 | Q4 2023 | Q3 2023 | Q2 2023 | Q1 2023 | Q4 2022 |
|---|---|---|---|---|---|---|---|---|---|---|---|---|---|---|---|---|---|
| Revenue TTM | $14.22B | $13.17B | $12.39B | · | $11.84B | $11.69B | $11.62B | · | $7.33B | $7.24B | $7.07B | · | $6.76B | $7.79B | $8.95B | · | |
| Net Income TTM | $338M | $381M | $433M | · | $493M | $460M | $616M | · | $630M | $647M | $702M | · | $742M | $773M | $646M | · | |
| Market Cap | $14.72B | $14.88B | $15.91B | · | $15.57B | $14.45B | $16.44B | · | $14.36B | $15.92B | $13.48B | · | $12.38B | $12.33B | $12.58B | · | |
| Enterprise Value | $17.13B | $17.59B | $16.84B | · | $16.78B | $15.88B | $17.67B | · | $16.07B | $17.89B | $15.23B | · | $14.49B | $14.56B | $14.86B | · | |
| P/E | 44.7 | 39.2 | 37.5 | · | 32.5 | 33.2 | 27.6 | · | 22.8 | 24.5 | 19.1 | · | 17.0 | 16.1 | 19.8 | · | |
| P/S | 1.0 | 1.1 | 1.3 | · | 1.3 | 1.2 | 1.4 | · | 2.0 | 2.2 | 1.9 | · | 1.8 | 1.6 | 1.4 | · | |
| P/B | 4.5 | 4.5 | 4.6 | · | 4.1 | 3.7 | 3.9 | · | 2.2 | 2.4 | 2.0 | · | 1.9 | 1.9 | 2.0 | · | |
| P / Cash Flow | · | · | 41.8 | · | · | · | 153.0 | · | · | · | 32.2 | · | · | · | 41.6 | · | |
| EV / Revenue | 1.2 | 1.3 | 1.4 | · | 1.4 | 1.4 | 1.5 | · | 2.2 | 2.5 | 2.2 | · | 2.1 | 1.9 | 1.7 | · | |
| Dividend Yield | 1.1% | 1.1% | 0.98% | · | 0.97% | 1.0% | 0.89% | · | 0.97% | 0.85% | 0.98% | · | 1.0% | 0.99% | 0.83% | · | |
| Earnings Yield | 2.2% | 2.5% | 2.7% | · | 3.1% | 3.0% | 3.6% | · | 4.4% | 4.1% | 5.2% | · | 5.9% | 6.2% | 5.0% | · | |
| Payout Ratio | · | · | 30.7% | · | · | · | -201.2% | · | · | · | 19.4% | · | · | · | 22.0% | · | |
| Annual Payout | $162M | $158M | $155M | · | $151M | $149M | $146M | · | $139M | $136M | $132M | · | $125M | $121M | $104M | · |
最近期在左侧 · 空值显示为 ·
财务报表 损益表、资产负债表、现金流量表 — 年度,近5年
| 指标 | 2025-09-26 | 2024-09-27 | 2023-09-29 | 2022-09-30 | 2021-10-01 |
|---|---|---|---|---|---|
| 收入 | $12.03B | $11.50B | $10.85B | $9.78B | $14.09B |
| 毛利率 % | 24.8% | 24.6% | 21.2% | 22.3% | 21.6% |
| 营业利润率 % | 7.2% | 6.0% | 6.6% | 6.2% | 4.9% |
| 净收入 | $289M | $806M | $666M | $644M | $477M |
| 稀释后每股收益 (EPS) | $2.38 | $6.32 | $5.30 | $4.98 | $3.20 |
| 指标 | 2025-09-26 | 2024-09-27 | 2023-09-29 | 2022-09-30 | 2021-10-01 |
|---|---|---|---|---|---|
| 负债/股东权益比率 | 0.6 | 0.5 | 0.4 | 0.6 | 0.5 |
| 流动比率 | 1.3 | 1.2 | 1.4 | 1.5 | 1.3 |
| 速动比率 | 1.3 | 1.0 | 1.3 | 1.4 | 1.3 |
| 指标 | 2025-09-26 | 2024-09-27 | 2023-09-29 | 2022-09-30 | 2021-10-01 |
|---|---|---|---|---|---|
| 自由现金流 | $607M | $934M | $837M | $347M | $633M |
机构持有人 (13F) 933 家申报者 · $15.1B 总计 · 截至 2026年9月30日
在其季度SEC表格13F中报告持有此股票的机构。仅限多头头寸;单个申报人可能因单独的期权腿而出现两次。 大的抵消性看跌/看涨腿通常反映做市或对冲库存,而非方向性判断。
| 新仓位 | 已退出持仓 | 增加 | 减少 | 净股数变动 |
|---|---|---|---|---|
| 85 (-23 与上一季度对比) | 112 (+22 与上一季度对比) | 282 (-20 与上一季度对比) | 363 (+19 与上一季度对比) | +5.9M |
与Q1 2026对比。 SEC 13F表格的提交截止日期是季度末后45天,外加少量延迟提交的缓冲期——在此窗口期内的季度将被跳过,优先显示最近一个已完整报告的季度对。
| 机构 | 价值 | 股份 | % 已追踪的13F | 类型 |
|---|---|---|---|---|
| VANGUARD GROUP INC | $1809694085 | 13662193 | 11.98% | 股份 |
| BlackRock, Inc. | $1372609688 | 10893728 | 9.08% | 股份 |
| VANGUARD CAPITAL MANAGEMENT LLC | $972005454 | 7714329 | 6.43% | 股份 |
| STATE STREET CORP | $931258566 | 7390941 | 6.16% | 股份 |
| VANGUARD PORTFOLIO MANAGEMENT LLC | $598385214 | 4749089 | 3.96% | 股份 |
| PRIMECAP MANAGEMENT CO/CA/ | $575290674 | 4565799 | 3.81% | 股份 |
| Invesco Ltd. | $425230722 | 3374847 | 2.81% | 股份 |
| GEODE CAPITAL MANAGEMENT, LLC | $418454701 | 3333601 | 2.77% | 股份 |
| MORGAN STANLEY | $400287269 | 3176879 | 2.65% | 股份 |
| Boston Partners | $339820104 | 2693079 | 2.25% | 股份 |
| MASSACHUSETTS FINANCIAL SERVICES CO /MA/ | $218864268 | 1737018 | 1.45% | 股份 |
| Ninety One UK Ltd | $210017502 | 1552580 | 1.39% | 股份 |
| BANK OF AMERICA CORP /DE/ | $208318365 | 1653320 | 1.38% | 股份 |
| Allspring Global Investments Holdings, LLC | $205224863 | 1646673 | 1.36% | 股份 |
| Pictet Asset Management Holding SA | $198245926 | 1573481 | 1.31% | 股份 |
| Focus Partners Wealth | $171943002 | 1364659 | 1.14% | 股份 |
| AMERIPRISE FINANCIAL INC | $170509279 | 1353298 | 1.13% | 股份 |
| AQR CAPITAL MANAGEMENT LLC | $162497814 | 1314495 | 1.08% | 股份 |
| NORTHERN TRUST CORP | $159444936 | 1265436 | 1.06% | 股份 |
| BARCLAYS PLC | $156419928 | 1241428 | 1.04% | 股份 |
| DIMENSIONAL FUND ADVISORS LP | $145938463 | 1158427 | 0.97% | 股份 |
| UBS AM, a distinct business unit of UBS ASSET MANAGEMENT AMERICAS LLC | $140520812 | 1104029 | 0.93% | 股份 |
| LAZARD ASSET MANAGEMENT LLC | $140386472 | 1114178 | 0.93% | 股份 |
| MIRAE ASSET GLOBAL ETFS HOLDINGS Ltd. | $120360577 | 955266 | 0.80% | 股份 |
| Caisse de depot et placement du Quebec | $118783224 | 942724 | 0.79% | 股份 |
| FIRST TRUST ADVISORS LP | $115302327 | 915098 | 0.76% | 股份 |
| CI INVESTMENTS INC. | $114816240 | 911240 | 0.76% | 股份 |
| GOLDMAN SACHS GROUP INC | $111647006 | 886087 | 0.74% | 股份 |
| Amundi | $111328051 | 883673 | 0.74% | 股份 |
| CHARLES SCHWAB INVESTMENT MANAGEMENT INC | $103583718 | 822093 | 0.69% | 股份 |
| UBS Group AG | $102333924 | 812174 | 0.68% | 股份 |
| ROYAL BANK OF CANADA | $88223000 | 700173 | 0.58% | 股份 |
| L1 Capital International Pty Ltd | $87243282 | 692407 | 0.58% | 股份 |
| VANGUARD FIDUCIARY TRUST CO | $83532834 | 662959 | 0.55% | 股份 |
| DEUTSCHE BANK AG\ | $83489742 | 662617 | 0.55% | 股份 |
| EARNEST PARTNERS LLC | $80132850 | 635975 | 0.53% | 股份 |
| Legal & General Group Plc | $78073509 | 619631 | 0.52% | 股份 |
| Bank of New York Mellon Corp | $76688417 | 608639 | 0.51% | 股份 |
| JONES FINANCIAL COMPANIES LLLP | $73877990 | 587760 | 0.49% | 股份 |
| JANUS HENDERSON GROUP PLC | $72493028 | 569689 | 0.48% | 股份 |
| NOMURA ASSET MANAGEMENT INTERNATIONAL INC. | $63023000 | 500181 | 0.42% | 股份 |
| CITIGROUP INC | $59190516 | 469766 | 0.39% | 股份 |
| Energy Income Partners, LLC | $58335984 | 462984 | 0.39% | 股份 |
| Vontobel Holding Ltd. | $51641486 | 381766 | 0.34% | 股份 |
| Nuveen, LLC | $50368817 | 399753 | 0.33% | 股份 |
| Balyasny Asset Management L.P. | $50338764 | 399514 | 0.33% | 股份 |
| NEUBERGER BERMAN GROUP LLC | $49959578 | 396505 | 0.33% | 股份 |
| Schonfeld Strategic Advisors LLC | $49541688 | 393188 | 0.33% | 股份 |
| ARROWSTREET CAPITAL, LIMITED PARTNERSHIP | $46224234 | 366859 | 0.31% | 股份 |
| MILLENNIUM MANAGEMENT LLC | $43545222 | 345597 | 0.29% | 股份 |
公司内部人士 92 位内幕人士 · 60 位高管 · 33 位董事
| 内部人士 | 角色 | 上次活动 | 持股数量 | 买入 12个月 | 卖出 12个月 | 净额 12个月 |
|---|---|---|---|---|---|---|
| Robert V Pragada | Chair & CEO | 2026年5月15日 P | 333755 | 1 | 0 | $400035 |
| Craig L Martin | President & CEO | 2014年12月26日 M | 607111 | 0 | 0 | $0 |
| Venkatesh Nathamuni | Chief Financial Officer | 2026年6月3日 F | 19791 | 1 | 0 | $101332 |
| Kevin C Berryman | CHIEF FINANCIAL OFFICER | 2024年4月30日 S | 231604 | 0 | 0 | $0 |
| Claudia Jaramillo | CFO and EVP | 2023年12月1日 F | 27796 | 0 | 0 | $0 |
| Hill Patrick | PRESIDENT | 2026年8月7日 S | 67356 | 0 | 2 | $-2478583 |
| Shannon Miller | President | 2026年7月8日 F | 25292 | 0 | 1 | $-193147 |
| Jiten Kachhela | President | 2026年6月8日 A | 16970 | 0 | 0 | $0 |
| Vinayak Ratnakar Pai | President, ECR | 2019年4月26日 J | 9363 | 0 | 0 | $0 |
| Lori S Sundberg | SENIOR VICE-PRESIDENT | 2017年6月6日 M | 19683 | 0 | 0 | $0 |
| Philip J Stassi | PRESIDENT, B&I | 2016年5月25日 M | 65743 | 0 | 0 | $0 |
| Andrew F Kremer | President, Industrial | 2015年11月19日 A | 32882 | 0 | 0 | $0 |
| Micheal T Autrey | Group Vice-President | 2010年10月29日 J | 11976 | 0 | 0 | $0 |
| Dante V Caravaggio | Senior Vice-President | 2010年8月31日 J | 7105 | 0 | 0 | $0 |
| Terence D Hagen | COO | 2019年3月29日 M | 62775 | 0 | 0 | $0 |
| Cheryl H.J. Lim | Chief Human Resources Officer | 2026年5月18日 A | 1585 | 0 | 0 | $0 |
| Joanne Caruso Zaccaro | Chief Legal & Admin Officer | 2025年12月1日 F | 79870 | 0 | 0 | $0 |
| Stephen A Arnette | EXECUTIVE VICE PRESIDENT | 2024年9月18日 M | 27084 | 0 | 0 | $0 |
| Steven J. Demetriou | EXECUTIVE CHAIR | 2024年9月18日 M | 527826 | 0 | 0 | $0 |
| Shelette M Gustafson | EXEC VICE PRESIDENT | 2024年8月29日 G | 24091 | 0 | 0 | $0 |
| Dawne S Hickton | Executive Vice President | 2021年11月18日 F | 36501 | 0 | 0 | $0 |
| Michael R Tyler | SVP & GENERAL COUNSEL | 2021年5月14日 M | 16879 | 0 | 0 | $0 |
| Joseph G. Mandel | Executive Vice President, IMO | 2018年6月8日 M | 77885 | 0 | 0 | $0 |
| Geoffrey P. Sanders | SENIOR VICE PRESIDENT | 2016年5月26日 F | 14935 | 0 | 0 | $0 |
| Santo Rizzuto | Executive Vice President | 2015年10月30日 J | 434 | 0 | 0 | $0 |
| Cora L Carmody | Senior Vice President | 2015年6月8日 M | 11782 | 0 | 0 | $0 |
| George A Kunberger JR | Executive Vice President | 2015年6月8日 M | 69970 | 0 | 0 | $0 |
| Nazim G Thawerbhoy | Senior Vice President | 2014年5月29日 M | 11224 | 0 | 0 | $0 |
| John W Prosser JR | Executive Vice President | 2014年5月29日 M | 354202 | 0 | 0 | $0 |
| Thomas R Hammond | Executive Vice President | 2014年5月29日 M | 288239 | 0 | 0 | $0 |
| Gregory J Landry | Executive Vice President | 2013年6月3日 M | 237582 | 0 | 0 | $0 |
| Patricia H Summers | Senior Vice President | 2012年5月24日 A | 26206 | 0 | 0 | $0 |
| William C Markley III | SVP & General Counsel | 2012年5月24日 A | 41158 | 0 | 0 | $0 |
| Thomas H Mcduffie JR | Group Vice President | 2011年5月25日 M | 17174 | 0 | 0 | $0 |
| Christopher E Nagel | Group Vice President | 2011年5月13日 M | 21661 | 0 | 0 | $0 |
| Earl J Mitchell JR | Group Vice President | 2011年5月10日 M | 17435 | 0 | 0 | $0 |
| Colin M Edwards | Senior Vice President | 2011年3月10日 M | 9848 | 0 | 0 | $0 |
| Robert Matha | Group Vice President | 2011年3月2日 M | 16748 | 0 | 0 | $0 |
| Robert G Norfleet | Group Vice President | 2011年2月7日 M | 19807 | 0 | 0 | $0 |
| Jay Michael Coyle | Gruop Vice President | 2011年2月4日 M | 25158 | 0 | 0 | $0 |
| Allyn B Taylor | Group Vice President | 2011年2月3日 M | 39590 | 0 | 0 | $0 |
| William J Birkhofer | Senior Vice President | 2010年6月23日 F | 16071 | 0 | 0 | $0 |
| Robert S Duff | Group Vice President | 2010年5月27日 A | 17761 | 0 | 0 | $0 |
| Kevin J Mcmahon | Group Vice President | 2010年5月27日 A | 35710 | 0 | 0 | $0 |
| Robert M Clement | Group Vice President | 2010年5月27日 A | 66373 | 0 | 0 | $0 |
| Rogers F Starr | Group Vice President | 2010年5月27日 A | 88137 | 0 | 0 | $0 |
| John Mclachlan | Group Vice President | 2010年5月27日 A | 206000 | 0 | 0 | $0 |
| James E Dixon | Group Vice President | 2010年3月31日 J | 30702 | 0 | 0 | $0 |
| Mark S Williams | Group Vice President | 2009年9月30日 J | 14947 | 0 | 0 | $0 |
| James T Stewart | Group Vice President | 2009年5月28日 A | 1600 | 0 | 0 | $0 |
| Michael J Higgins | Group Vice President | 2009年5月28日 A | 97636 | 0 | 0 | $0 |
| Arlan C Emmert | Group Vice President | 2008年11月13日 P | 50884 | 0 | 0 | $0 |
| Walter C Barber | Group Vice President | 2008年11月7日 P | 23622 | 0 | 0 | $0 |
| Warren M Dean | Group Vice President | 2008年5月28日 S | 60941 | 0 | 0 | $0 |
| Laurence R Sadoff | Group Vice President | 2008年5月22日 A | 46890 | 0 | 0 | $0 |
| Martin G Duvivier | Senior Vice President | 2007年12月21日 S | 2334 | 0 | 0 | $0 |
| Peter M Evans | Group Vice President | 2007年11月9日 S | 0 | 0 | 0 | $0 |
| James W Thiesing | Group Vice President | 2007年6月28日 A | 32885 | 0 | 0 | $0 |
| William G Mitchell | Group Vice President | 2006年6月22日 A | · | 0 | 0 | $0 |
| MILLER MICHAEL P | Senior Vice President | 2005年6月23日 A | 12000 | 0 | 0 | $0 |
| Manuel J Fernandez | 董事 | 2026年5月13日 P | 12504 | 3 | 0 | $177401 |
| Priya Abani | 董事 | 2026年1月29日 A | 7728 | 0 | 0 | $0 |
| Mary M. Jackson | 董事 | 2026年1月29日 A | 3185 | 0 | 0 | $0 |
| Georgette D. Kiser | 董事 | 2026年1月29日 A | 12958 | 0 | 0 | $0 |
| Diane M Bryant | 董事 | 2026年1月29日 A | 1636 | 0 | 0 | $0 |
| Julia A Sloat | 董事 | 2026年1月29日 A | 4620 | 0 | 0 | $0 |
| Michael Collins | 董事 | 2026年1月29日 A | 3200 | 0 | 0 | $0 |
| Louis V. Pinkham | 董事 | 2026年1月29日 A | 4620 | 0 | 0 | $0 |
| Robert A Mcnamara | 董事 | 2026年1月29日 A | 18603 | 0 | 0 | $0 |
| Peter J Robertson | 董事 | 2025年11月24日 P | 1000 | 1 | 0 | $134760 |
| Christopher M.T. Thompson | 董事 | 2024年8月29日 M | 44685 | 0 | 0 | $0 |
| Ralph E Eberhart | 董事 | 2024年8月29日 M | 33248 | 0 | 0 | $0 |
| Vincent K Brooks | 董事 | 2024年1月25日 A | 6961 | 0 | 0 | $0 |
| Barbara Loughran | 董事 | 2024年1月25日 A | 9409 | 0 | 0 | $0 |
| Robert C Davidson JR | 董事 | 2021年2月12日 M | 34911 | 0 | 0 | $0 |
| Linda Fayne Levinson | 董事 | 2021年1月27日 A | 62486 | 0 | 0 | $0 |
| Joseph R Bronson | 董事 | 2020年8月6日 S | 28103 | 0 | 0 | $0 |
| Coppel Juan Jose Suarez | 董事 | 2019年4月30日 F | 6871 | 0 | 0 | $0 |
| Barry L Williams | 董事 | 2019年1月17日 A | 26640 | 0 | 0 | $0 |
| Noel G Watson | 董事 | 2016年12月22日 G | 734329 | 0 | 0 | $0 |
| John F Coyne | 董事 | 2016年3月24日 A | 11809 | 0 | 0 | $0 |
| Edward V Fritzky | 董事 | 2015年3月1日 A | 18500 | 0 | 0 | $0 |
| MONTOYA BENJAMIN F | 董事 | 2012年3月1日 A | 19000 | 0 | 0 | $0 |
| Thomas M T Niles | 董事 | 2011年5月17日 P | 50 | 0 | 0 | $0 |
| John P Jumper | 董事 | 2011年3月2日 A | 5000 | 0 | 0 | $0 |
| Robert B Gwyn | 董事 | 2009年3月2日 A | 33040 | 0 | 0 | $0 |
| Dale R Laurance | 董事 | 2008年1月24日 X | 58500 | 0 | 0 | $0 |
| David Petrone | 董事 | 2007年2月21日 X | 47500 | 0 | 0 | $0 |
| JACOBS JOSEPH J | 董事 | 2004年3月10日 S | 1005376 | 0 | 0 | $0 |
| Peter H Dailey | 董事 | 2003年7月31日 A | 10600 | 0 | 0 | $0 |
| William B Allen JR | · | 2025年12月1日 F | 32768 | 0 | 0 | $0 |
| Linda K Jacobs | · | 2006年11月17日 G | 159831 | 0 | 0 | $0 |
来自SEC表格3/4/5申报的内部人士;净额=仅公开市场买卖
ETF持仓 由 123 只交易所交易基金持有
权重仅反映直接股权持仓(N-PORT);杠杆基金或基于衍生品的基金可能持有未显示的额外掉期敞口。
| 基金 | 权重 | 单位 | 截至 | 来源 |
|---|---|---|---|---|
| EQTY · Valued Advisers Trust | 3.05% | 322043 NS | 2026年7月31日 | N-PORT |
| PHO · Invesco Exchange-Traded Fund Trust | 3.01% | 412757 SH | 2026年10月23日 | 每日 |
| RUNN · Strategic Trust | 1.98% | 55152 NS | 2026年8月31日 | N-PORT |
| EPSV · Harbor ETF Trust | 1.89% | 854 NS | 2026年7月31日 | N-PORT |
| SMCO · Tidal Trust II | 1.54% | 16238 NS | 2026年7月31日 | N-PORT |
| EPMV · Harbor ETF Trust | 1.34% | 464 NS | 2026年7月31日 | N-PORT |
| RSPN · Invesco Exchange-Traded Fund Trust | 1.24% | 61786 SH | 2026年10月23日 | 每日 |
| EMLP · First Trust Exchange-Traded Fund IV | 1.06% | 324704 NS | 2026年7月31日 | N-PORT |
| NUMV · Nushares ETF Trust | 1.00% | 32969 NS | 2026年7月31日 | N-PORT |
| FPWR · First Trust Exchange-Traded Fund IV | 0.81% | 1779 NS | 2026年7月31日 | N-PORT |
| EIPX · First Trust Exchange-Traded Fund IV | 0.47% | 19711 NS | 2026年7月31日 | N-PORT |
| NULV · Nushares ETF Trust | 0.45% | 72887 NS | 2026年7月31日 | N-PORT |
| VBR · VANGUARD INDEX FUNDS | 0.32% | 1719454 SH | 2026年8月19日 | 每日 |
| SUSA · iShares Trust | 0.28% | 80820 SH | 2026年9月11日 | 每日 |
| TEXN · iShares Trust | 0.27% | 363 SH | 2026年9月11日 | 每日 |
| SIZE · iShares Trust | 0.25% | 7490 SH | 2026年9月11日 | 每日 |
| SPXD · DBX ETF Trust | 0.24% | 115 NS | 2026年8月31日 | N-PORT |
| FIDU · FIDELITY COVINGTON TRUST | 0.23% | 38543 NS | 2026年7月31日 | N-PORT |
| EVUS · iShares Trust | 0.21% | 5705 SH | 2026年9月11日 | 每日 |
| DUSL · Direxion Shares ETF Trust | 0.21% | 872 NS | 2026年7月31日 | N-PORT |
| IYJ · iShares Trust | 0.21% | 27746 SH | 2026年9月11日 | 每日 |
| RSP · Invesco Exchange-Traded Fund Trust | 0.20% | 1385089 SH | 2026年10月23日 | 每日 |
| VIS · VANGUARD WORLD FUND | 0.20% | 142670 SH | 2026年8月19日 | 每日 |
| EUSA · iShares, Inc. | 0.19% | 26479 SH | 2026年9月11日 | 每日 |
| VB · VANGUARD INDEX FUNDS | 0.18% | 2708775 SH | 2026年8月19日 | 每日 |
| SDVD · First Trust Exchange-Traded Fund IV | 0.18% | 11998 NS | 2026年7月31日 | N-PORT |
| EXI · iShares Trust | 0.17% | 16884 SH | 2026年9月11日 | 每日 |
| GARP · iShares Trust | 0.16% | 35537 SH | 2026年9月11日 | 每日 |
| IWS · iShares Trust | 0.16% | 174672 SH | 2026年9月11日 | 每日 |
| SPHQ · Invesco Exchange-Traded Fund Trust | 0.16% | 200901 SH | 2026年10月23日 | 每日 |
| DEUS · DBX ETF Trust | 0.14% | 2860 NS | 2026年8月31日 | N-PORT |
| BSCS · Invesco Exchange-Traded Self-Inde... | 0.14% | 4877000 | 2026年10月23日 | 每日 |
| ESGU · iShares Trust | 0.14% | 178875 SH | 2026年9月11日 | 每日 |
| PFIG · Invesco Exchange-Traded Fund Trus... | 0.13% | 175000 | 2026年10月23日 | 每日 |
| IMCV · iShares Trust | 0.13% | 10448 SH | 2026年9月11日 | 每日 |
| IWR · iShares Trust | 0.12% | 478647 SH | 2026年9月11日 | 每日 |
| IMCB · iShares Trust | 0.12% | 13742 SH | 2026年9月11日 | 每日 |
| HAPI · Harbor ETF Trust | 0.11% | 4132 NS | 2026年7月31日 | N-PORT |
| IMCG · iShares Trust | 0.10% | 29447 SH | 2026年9月11日 | 每日 |
| XOEF · iShares Trust | 0.09% | 150 SH | 2026年9月11日 | 每日 |
| DFSU · Dimensional ETF Trust | 0.09% | 15870 NS | 2026年7月31日 | N-PORT |
| DFUV · Dimensional ETF Trust | 0.08% | 95819 NS | 2026年7月31日 | N-PORT |
| RWL · Invesco Exchange-Traded Fund Trus... | 0.07% | 50690 SH | 2026年10月23日 | 每日 |
| PALC · Pacer Funds Trust | 0.07% | 1108 NS | 2026年7月31日 | N-PORT |
| USXF · iShares Trust | 0.07% | 6986 SH | 2026年9月11日 | 每日 |
| QARP · DBX ETF Trust | 0.07% | 345 NS | 2026年8月31日 | N-PORT |
| IUS · Invesco Exchange-Traded Self-Inde... | 0.06% | 4341 SH | 2026年10月23日 | 每日 |
| DFLV · Dimensional ETF Trust | 0.06% | 28672 NS | 2026年7月31日 | N-PORT |
| PWS · Pacer Funds Trust | 0.06% | 102 NS | 2026年7月31日 | N-PORT |
| IVE · iShares Trust | 0.06% | 196652 SH | 2026年9月11日 | 每日 |
| IUSV · iShares Trust | 0.05% | 103508 SH | 2026年9月11日 | 每日 |
| DCOR · Dimensional ETF Trust | 0.05% | 13069 NS | 2026年7月31日 | N-PORT |
| VOOV · VANGUARD ADMIRAL FUNDS | 0.05% | 27300 SH | 2026年8月19日 | 每日 |
| TOV · EA Series Trust | 0.05% | 945 NS | 2026年7月31日 | N-PORT |
| MNZL · EA Series Trust | 0.05% | 88 NS | 2026年7月31日 | N-PORT |
| SUSL · iShares Trust | 0.05% | 4185 SH | 2026年9月11日 | 每日 |
| HLAL · Listed Funds Trust | 0.05% | 3056 NS | 2026年8月31日 | N-PORT |
| DFVX · Dimensional ETF Trust | 0.05% | 1847 NS | 2026年7月31日 | N-PORT |
| USSG · DBX ETF Trust | 0.05% | 1861 NS | 2026年8月31日 | N-PORT |
| DSI · iShares Trust | 0.05% | 17840 SH | 2026年9月10日 | 每日 |
| PRF · Invesco Exchange-Traded Fund Trust | 0.05% | 31968 SH | 2026年10月23日 | 每日 |
| DFAC · Dimensional ETF Trust | 0.05% | 162067 NS | 2026年7月31日 | N-PORT |
| OMFL · Invesco Exchange-Traded Self-Inde... | 0.05% | 14824 SH | 2026年10月23日 | 每日 |
| EQAL · Invesco Exchange-Traded Fund Trus... | 0.04% | 2491 SH | 2026年10月23日 | 每日 |
| IWD · iShares Trust | 0.04% | 259363 SH | 2026年9月11日 | 每日 |
| SNPE · DBX ETF Trust | 0.04% | 8631 NS | 2026年8月31日 | N-PORT |
| DGRO · iShares Trust | 0.04% | 131921 SH | 2026年9月11日 | 每日 |
| VONV · VANGUARD SCOTTSDALE FUNDS | 0.04% | 70529 SH | 2026年8月19日 | 每日 |
| DXUV · Dimensional ETF Trust | 0.04% | 1512 NS | 2026年7月31日 | N-PORT |
| EGLE · Global X Funds | 0.04% | 6 NS | 2026年7月31日 | N-PORT |
| CATH · Global X Funds | 0.03% | 3036 NS | 2026年7月31日 | N-PORT |
| USCL · iShares Trust | 0.03% | 6194 SH | 2026年9月11日 | 每日 |
| QVML · Invesco Exchange-Traded Fund Trus... | 0.03% | 3568 SH | 2026年10月23日 | 每日 |
| ACVF · ETF Opportunities Trust | 0.03% | 338 NS | 2026年7月31日 | N-PORT |
| TOPC · iShares Trust | 0.03% | 69 SH | 2026年9月10日 | 每日 |
| CHRI · Global X Funds | 0.03% | 17 NS | 2026年7月31日 | N-PORT |
| XTR · Global X Funds | 0.03% | 10 NS | 2026年7月31日 | N-PORT |
| XVV · iShares Trust | 0.03% | 1335 SH | 2026年9月11日 | 每日 |
| XYLD · Global X Funds | 0.03% | 6510 NS | 2026年7月31日 | N-PORT |
| DFAU · Dimensional ETF Trust | 0.03% | 24893 NS | 2026年7月31日 | N-PORT |
| PBUS · Invesco Exchange-Traded Fund Trus... | 0.03% | 19144 SH | 2026年10月23日 | 每日 |
| XCLR · Global X Funds | 0.03% | 7 NS | 2026年7月31日 | N-PORT |
| PBP · Invesco Exchange-Traded Fund Trust | 0.03% | 701 SH | 2026年10月23日 | 每日 |
| ILCV · iShares Trust | 0.03% | 2475 SH | 2026年9月11日 | 每日 |
| ILCB · iShares Trust | 0.03% | 2349 SH | 2026年9月11日 | 每日 |
| IVV · iShares Trust | 0.03% | 1486378 SH | 2026年9月11日 | 每日 |
| PTLC · Pacer Funds Trust | 0.02% | 5945 NS | 2026年7月31日 | N-PORT |
| BKLC · BNY Mellon ETF Trust | 0.02% | 9929 NS | 2026年7月31日 | N-PORT |
| BBUS · J.P. Morgan Exchange-Traded Fund ... | 0.02% | 16171 NS | 2026年7月31日 | N-PORT |
| VOTE · TCW ETF Trust | 0.02% | 1985 NS | 2026年7月31日 | N-PORT |
| XRMI · Global X Funds | 0.02% | 89 NS | 2026年7月31日 | N-PORT |
| IYY · iShares Trust | 0.02% | 5142 SH | 2026年9月11日 | 每日 |
| XYLG · Global X Funds | 0.02% | 113 NS | 2026年7月31日 | N-PORT |
| ILCG · iShares Trust | 0.02% | 5212 SH | 2026年9月11日 | 每日 |
| DFUS · Dimensional ETF Trust | 0.02% | 36276 NS | 2026年7月31日 | N-PORT |
| IWB · iShares Trust | 0.02% | 80425 SH | 2026年9月11日 | 每日 |
| IWV · iShares Trust | 0.02% | 33155 SH | 2026年9月10日 | 每日 |
| ITOT · iShares Trust | 0.02% | 154898 SH | 2026年9月11日 | 每日 |
| SPUU · Direxion Shares ETF Trust | 0.02% | 445 NS | 2026年7月31日 | N-PORT |
| QDPL · Pacer Funds Trust | 0.02% | 2836 NS | 2026年7月31日 | N-PORT |
| PHDG · Invesco Actively Managed Exchange... | 0.02% | 94 SH | 2026年10月23日 | 每日 |
| VOO · VANGUARD INDEX FUNDS | 0.02% | 3066824 SH | 2026年8月19日 | 每日 |
| VTI · VANGUARD INDEX FUNDS | 0.02% | 3748670 SH | 2026年8月19日 | 每日 |
| VONE · VANGUARD SCOTTSDALE FUNDS | 0.02% | 19198 SH | 2026年8月19日 | 每日 |
| VTHR · VANGUARD SCOTTSDALE FUNDS | 0.02% | 9862 SH | 2026年8月19日 | 每日 |
| HCMT · Direxion Shares ETF Trust | 0.02% | 827 NS | 2026年7月31日 | N-PORT |
| TOK · iShares Trust | 0.02% | 332 SH | 2026年9月10日 | 每日 |
| KOKU · DBX ETF Trust | 0.02% | 1070 NS | 2026年8月31日 | N-PORT |
| SPXL · Direxion Shares ETF Trust | 0.02% | 9233 NS | 2026年7月31日 | N-PORT |
| CRBN · iShares Trust | 0.02% | 1513 SH | 2026年9月11日 | 每日 |
| URTH · iShares, Inc. | 0.02% | 10319 SH | 2026年9月10日 | 每日 |
| TILT · FlexShares Trust | 0.02% | 2686 NS | 2026年7月31日 | N-PORT |
| ACWI · iShares Trust | 0.02% | 38965 SH | 2026年9月10日 | 每日 |
| VOXP · Advisors Series Trust | 0.01% | 6 NS | 2026年7月31日 | N-PORT |
| VT · VANGUARD INTERNATIONAL EQUITY IND... | 0.01% | 101911 SH | 2026年8月19日 | 每日 |
| BIV · VANGUARD BOND INDEX FUNDS | · | · | 2026年7月15日 | 每日 |
| BSV · VANGUARD BOND INDEX FUNDS | · | · | 2026年7月15日 | 每日 |
| BND · VANGUARD BOND INDEX FUNDS | · | · | 2026年7月15日 | 每日 |
| VCSH · VANGUARD SCOTTSDALE FUNDS | · | · | 2026年7月15日 | 每日 |
| VCIT · VANGUARD SCOTTSDALE FUNDS | · | · | 2026年7月15日 | 每日 |
| VTC · VANGUARD SCOTTSDALE FUNDS | · | · | 2026年7月30日 | 每日 |
| BNDW · VANGUARD SCOTTSDALE FUNDS | · | · | 2026年7月14日 | 每日 |
| IFRA · iShares Trust | · | 186404 SH | 2026年9月11日 | 每日 |
J 分析师共识 看涨和看跌分析师观点、12个月价格目标、上涨空间
12个月价格目标
15 位分析师 · 2026-10-25平均目标 $162.80 +10.9%
同行比较(GICS 子行业) 关键指标与行业同行对比
财年依据,价格截至各公司上一个财年末收盘价。
| 股票代码 | 市值 | P/E | 营收同比增长 | 净利润率 | ROE | 毛利率 |
|---|---|---|---|---|---|---|
| J | $17.61B | 62.1 | 4.6% | 2.4% | 7.1% | 24.8% |
| VRSK | $30.96B | 34.5 | 6.6% | 29.6% | 444.1% | · |
| EFX | $26.12B | 40.8 | 6.9% | 10.9% | 14.1% | · |
| LDOS | $23.19B | 16.5 | 3.1% | 8.4% | 31.1% | · |
| CACI | $10.24B | 19.2 | 10.9% | 5.6% | 12.5% | · |
| ULS | $15.85B | 49.3 | 6.4% | 10.7% | 30.0% | · |
| TRU | $16.50B | 37.0 | 9.4% | 10.0% | 10.5% | · |
| BAH | $9.39B | 11.3 | -6.4% | 7.6% | 81.0% | · |
| ANDG | · | · | 14.6% | -0.28% | 3.5% | · |
| SAIC | $4.48B | 13.2 | -2.9% | 4.9% | 23.3% | · |
最新新闻 提及该公司的近期头条新闻
交易信号 近期买入/卖出信号,包含入场价和风险/回报比
实时信号 — 屏幕上唯一已填写的卡片。
我的指标 您的个人关注列表 — 来自完整基本面的选定行
选择对您重要的指标 — 点击上方完整基本面中任意行的 + 号。
您的选择已保存,并会跟随您浏览所有股票。