
MTB M&T Bank Corporation Common Stock
NYSE · Banking · Voir sur SEC EDGAR ↗ 10-K/10-Q Aoû 4, 2026MTB Aperçu de l'action Prix, capitalisation boursière, P/E, EPS, ROE, dette/capitaux propres, fourchette sur 52 semaines
MTB Graphique du cours de l'action OHLCV quotidien avec indicateurs techniques — panoramique, zoom et personnalisez votre vue
La granularité des barres s'adapte à la période sélectionnée — survolez le graphique pour voir l'ouverture/le maximum/le minimum/la clôture d'une barre.
| Date ex-dividende | Division | Type |
|---|---|---|
| 6 octobre 2000 | 10-for-1 | Avant |
| 25 septembre 1987 | 2-for-1 | Avant |
À propos de M&T Bank Corporation Common Stock Présentation de l'entreprise depuis Wikipedia
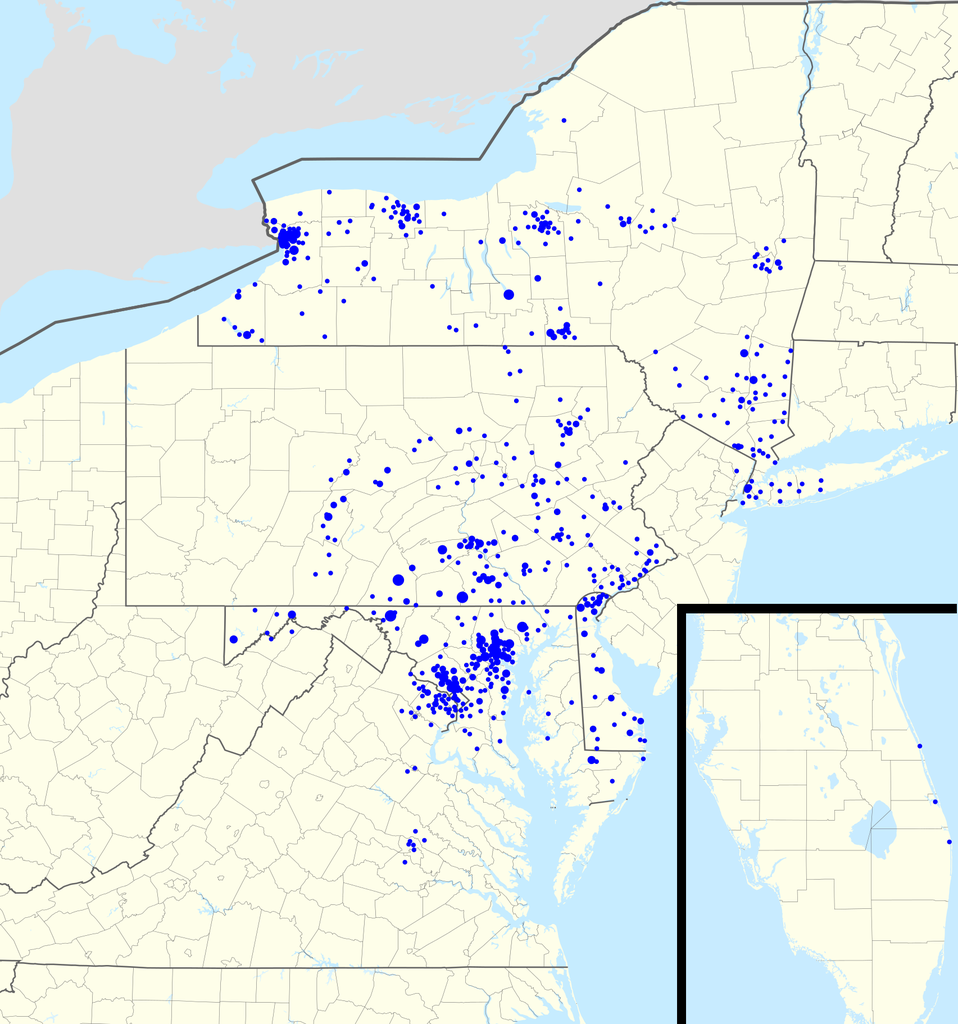
M&T Bank est une banque dont le siège social est situé à Buffalo dans l'État de New York aux États-Unis.
M&T Bank possède 78 milliards de dollars d'actif en septembre 2011, avec environ 13 000 employés et 750 agences situées dans l'État de New York, du Maryland, de Pennsylvanie, de Virginie, de Washington, de Virginie-Occidentale, du Delaware, du New Jersey et de Floride.
## Histoire
En septembre 2002, M&T Bank acquiert Allfirst Financial, filiale américaine d'Allied Irish Banks, pour 3,1 milliards de dollars, dont 886 millions en liquidités, une participation de 22,5 % dans le nouvel ensemble créé. Ce nouvel ensemble possède 710 agences, dont 450 proviennent de M&T Bank dans l'État de New York, en Pennsylvanie, au Maryland et en Virginie-Occidentale, contre 260 agences pour Allfirst dans le Maryland, le Delaware, la Pennsylvanie, Washington D. C. et la Virginie. Allfirst Financial avait été l'objet d'une perte de trading de 691,2 millions de dollars quelques mois plus tôt. Cette acquisition se fait en parallèle de près de 1 100 suppressions de postes chez Allfirst, principalement dans le Maryland, lieu de son siège social.
En décembre 2008, M&T acquiert Provident Bank pour 401 millions de dollars, augmentant sa présence en Virginie avec 60 agences de plus et surtout dans le Maryland avec 250 agences en plus de ses agences déjà présentes.
En août 2012, M&T Bank rachète Hudson City Bancorp pour 3,7 milliards de dollars. Hudson City Bancorp était une ancienne caisse d'épargne de nature mutuelle qui s'est démutualisée en 2005, et s'est introduit en bourse. Elle était principalement présente dans l'État du New Jersey, mais aussi dans l'État de New York et dans le Connecticut. Elle possédait 135 agences.
En février 2021, M&T Bank annonce l'acquisition de People’s United Financial, banque basée au Connecticut et présent en Nouvelle-Angleterre, pour 7,6 milliards de dollars.
== Références ==
Source : Wikipedia, CC BY-SA 4.0 · Voir sur Wikipedia ↗
Performance sur 10 ans Tendances du chiffre d'affaires, du bénéfice net, des marges et du BPA
Valorisation Ratios P/E, P/S, P/B, EV/EBITDA — l'action est-elle chère ou bon marché ?
| Métrique | Tendance sur 5 ans | MTB | moyenne 5 ans | Médiane des pairs | Verdict |
|---|---|---|---|---|---|
| P/E (TTM) | 11.7moyenne 5 ans ≈11.4 | ≈11.4 | 12.3 | Surévalué | |
| PEG Ratio (Ratio PEG) | ≈1.0 | · | · | · |
La médiane des pairs est calculée sur une base standardisée par métrique et peut ne pas toujours correspondre à la base TTM/MRQ indiquée pour cette action.
Rentabilité Marges brutes, d'exploitation et nettes ; ROE, ROA, ROIC
| Métrique | Tendance sur 5 ans | MTB | moyenne 5 ans | Médiane des pairs | Verdict |
|---|---|---|---|---|---|
| EBITDA Margin (Marge EBITDA) | 19.5% | · | 6.6% | Premier rang | |
| Marge avant impôts (TTM) | 230.3%moyenne 5 ans ≈109.6% | ≈109.6% | 41.4% | Premier rang | |
| Marge nette (TTM) | 178.1%moyenne 5 ans ≈84.8% | ≈84.8% | 32.3% | Premier rang | |
| ROA (TTM) | 1.4%moyenne 5 ans ≈1.3% | ≈1.3% | 1.2% | En ligne | |
| ROE (TTM) | 10.7%moyenne 5 ans ≈9.5% | ≈9.5% | 9.5% | En ligne |
Santé financière Dette, liquidité, solvabilité — solidité du bilan
| Métrique | Tendance sur 5 ans | MTB | moyenne 5 ans | Médiane des pairs | Verdict |
|---|---|---|---|---|---|
| Dette / Capitaux propres (MRQ) | 0.2moyenne 5 ans ≈0.1 | ≈0.1 | 0.2 | En ligne |
Croissance Croissance du chiffre d'affaires, du BPA et du bénéfice net : Année/Année, TCAC 3 ans, TCAC 5 ans
| Métrique | Tendance sur 5 ans | MTB | moyenne 5 ans | Médiane des pairs | Verdict |
|---|---|---|---|---|---|
| Revenue YoY (Chiffre d'affaires YoY) | 7.5%moyenne 5 ans ≈-13.0% | ≈-13.0% | · | · | |
| Revenue CAGR 3Y (CAGR du chiffre d'affaires 3 ans) | 2.8%moyenne 5 ans ≈-23.6% | ≈-23.6% | · | · | |
| Revenue CAGR 5Y (CAGR du chiffre d'affaires 5 ans) | -22.6% | · | · | · | |
| EPS YoY (BPA Année/Année) | 16.1%moyenne 5 ans ≈13.6% | ≈13.6% | · | · | |
| Net Income YoY (Bénéfice net YoY) | 10.2%moyenne 5 ans ≈17.3% | ≈17.3% | · | · | |
| EPS CAGR 3Y (TCAC BPA 3 ans) | 13.8%moyenne 5 ans ≈10.8% | ≈10.8% | · | · | |
| EPS CAGR 5Y (TCAC BPA 5 ans) | 11.3% | · | · | · | |
| Net Income CAGR 3Y (TCAC Bénéfice net 3 ans) | 12.7%moyenne 5 ans ≈17.0% | ≈17.0% | · | · | |
| Net Income CAGR 5Y (TCAC Bénéfice net 5 ans) | 16.1% | · | · | · |
Efficacité du capital Rotation des actifs, rotation des stocks, rotation des créances
| Métrique | Tendance sur 5 ans | MTB | moyenne 5 ans | Médiane des pairs | Verdict |
|---|---|---|---|---|---|
| Asset Turnover (Rotation des actifs) | 0.0moyenne 5 ans ≈0.0 | ≈0.0 | 0.0 | Faible | |
| Revenue / Employee (Chiffre d'affaires annuel ÷ employés (effectif déclaré, yfinance). Dérivé — pas un concept SEC-XBRL stocké.) | ≈$76.8K | · | · | · |
valeur · ≈ moyenne 5 ans · médiane du secteur · verdict par rapport à la médiane
Dividendes Rendement, ratio de distribution, historique des dividendes, CAGR à 5 ans
| Date ex-dividende | Montant | Devise | Rendement |
|---|---|---|---|
| Sep 1, 2026 | $1,50 | USD | ≈2.6% |
| Jui 1, 2026 | $1,50 | USD | ≈2.8% |
| Mar 2, 2026 | $1,50 | USD | ≈2.7% |
| Déc 1, 2025 | $1,50 | USD | ≈3.0% |
| Sep 2, 2025 | $1,50 | USD | ≈2.8% |
| Jui 2, 2025 | $1,35 | USD | ≈3.0% |
| Mar 3, 2025 | $1,35 | USD | ≈2.9% |
| Déc 2, 2024 | $1,35 | USD | ≈2.5% |
| Sep 3, 2024 | $1,35 | USD | ≈3.1% |
| Jui 3, 2024 | $1,35 | USD | ≈3.5% |
| Mar 1, 2024 | $1,30 | USD | ≈3.8% |
| Nov 30, 2023 | $1,30 | USD | ≈4.1% |
| Aoû 31, 2023 | $1,30 | USD | ≈4.1% |
| Mai 31, 2023 | $1,30 | USD | ≈4.2% |
| Mar 3, 2023 | $1,30 | USD | ≈3.2% |
| Nov 30, 2022 | $1,20 | USD | ≈2.8% |
| Aoû 31, 2022 | $1,20 | USD | ≈2.6% |
| Mai 31, 2022 | $1,20 | USD | ≈2.6% |
| Fév 25, 2022 | $1,20 | USD | ≈2.5% |
| Nov 29, 2021 | $1,20 | USD | ≈3.0% |
Historique des bénéfices BPA réel vs estimation, surprise %, taux de succès, prochaine date de publication des résultats
| Période | Rapport | EPS Actual | BPA est. | Surprise |
|---|---|---|---|---|
| 30 septembre 2026 | Oct 16, 2026 | $5.04 | $5.01 | 0.66% |
| 30 juin 2026 | Jul 15, 2026 | $5.32 | $4.71 | 13.0% |
| 31 mars 2026 | $4.13 | $4.05 | 2.0% | |
| 31 décembre 2025 | $4.67 | $4.52 | 3.4% | |
| 30 septembre 2025 | $4.82 | $4.47 | 7.8% | |
| 30 juin 2025 | $4.24 | $4.03 | 5.1% | |
| 31 mars 2025 | $3.32 | $3.43 | -3.3% |
Fondamentaux complets Tous les indicateurs par an — compte de résultat, bilan, flux de trésorerie
Compte de résultat
| Métrique | Tendance | 2025 | 2024 | 2023 | 2022 | 2021 | 2020 | 2019 | 2018 | 2017 | 2016 | 2015 | 2014 |
|---|---|---|---|---|---|---|---|---|---|---|---|---|---|
| Revenue | $1.66B | $1.54B | $1.48B | $1.52B | $5.99B | $5.95B | $6.19B | $5.93B | $5.63B | $5.30B | $4.67B | $4.46B | |
| Interest Expense | · | · | $3.11B | $425M | $114M | $326M | $749M | $526M | $387M | $426M | $328M | $280M | |
| Interest Income | $10.49B | $11.03B | $10.22B | $6.25B | $3.94B | $4.19B | $4.88B | $4.60B | $4.17B | $3.90B | $3.17B | $2.96B | |
| Pretax Income | $3.69B | $3.31B | $3.62B | $2.61B | $2.46B | $1.77B | $2.55B | $2.51B | $2.32B | $2.06B | $1.67B | $1.64B | |
| Income Tax | $841M | $722M | $878M | $620M | $596M | $416M | $618M | $590M | $916M | $743M | $595M | $576M | |
| Net Income | $2.85B | $2.59B | $2.74B | $1.99B | $1.86B | $1.35B | $1.93B | $1.92B | $1.41B | $1.32B | $1.08B | $1.07B | |
| EPS (Basic) | $17.10 | $14.71 | $15.85 | $11.59 | $13.81 | $9.94 | $13.76 | $12.75 | $8.72 | $7.80 | $7.22 | $7.47 | |
| EPS (Diluted) | $17.00 | $14.64 | $15.79 | $11.53 | $13.80 | $9.94 | $13.75 | $12.74 | $8.70 | $7.78 | $7.18 | $7.42 | |
| Shares (Basic) | 157,875,000 | 166,479,000 | 166,361,000 | 163,174,000 | 128,649,000 | 128,638,000 | 134,428,000 | 143,992,000 | 152,159,000 | 156,780,000 | 136,803,000 | 130,950,000 | |
| Shares (Diluted) | 158,791,000 | 167,319,000 | 167,002,000 | 164,030,000 | 128,812,000 | 128,704,000 | 134,462,000 | 144,151,000 | 152,551,000 | 157,304,000 | 137,533,000 | 131,844,000 | |
| EBITDA | $323M | $316M | · | · | · | · | · | · | · | · | · | · |
Bilan
| Métrique | Tendance | 2025 | 2024 | 2023 | 2022 | 2021 | 2020 | 2019 | 2018 | 2017 | 2016 | 2015 | 2014 |
|---|---|---|---|---|---|---|---|---|---|---|---|---|---|
| Cash & Equivalents | · | · | · | · | · | · | · | · | $1.42B | $1.32B | $1.37B | $1.37B | |
| PP&E (Net) | $1.63B | $1.71B | $1.74B | $1.65B | $1.14B | $1.16B | $1.14B | $647M | $646M | $675M | $667M | $613M | |
| PP&E (Gross) | $2.44B | $2.46B | $2.34B | $2.19B | $1.03B | $1.73B | $1.59B | $1.49B | $1.49B | $1.44B | $1.41B | $1.31B | |
| Accum. Depreciation | $1.36B | $1.33B | $1.22B | $1.16B | $1.79B | $978M | $891M | $844M | $841M | $762M | $740M | $701M | |
| Goodwill | $8.46B | $8.46B | $8.46B | $8.49B | $4.59B | $4.59B | $4.59B | $4.59B | $4.59B | $4.59B | $4.59B | $3.52B | |
| Intangibles | $64M | $94M | $147M | $209M | $4M | $14M | $29M | $47M | $72M | $98M | $140M | $35M | |
| Total Assets | $213.51B | $208.10B | $208.26B | $200.73B | $155.11B | $142.60B | $119.87B | $120.10B | $118.59B | $123.45B | $122.79B | $96.69B | |
| Short-term Debt | $2.15B | $1.06B | $5.32B | $3.56B | $47M | $59M | $62M | $4.40B | $175M | $163M | $2.13B | $193M | |
| Total Liabilities | $184.33B | $179.08B | $181.31B | $175.41B | $137.20B | $126.41B | $104.16B | $104.64B | $102.34B | $106.96B | $106.61B | $84.35B | |
| Long-term Debt | $10.91B | $12.61B | $8.20B | $3.96B | $3.49B | $4.38B | $6.99B | $8.44B | $8.14B | $9.49B | $10.65B | $9.01B | |
| Total Debt | $2.15B | $1.06B | $5.32B | $3.55B | $47M | $59M | $62M | $4.40B | $175M | $163M | $2.13B | $193M | |
| Common Stock | $90M | $90M | $90M | $90M | $80M | $80M | $80M | $80M | $80M | $80M | $80M | $66M | |
| Paid-in Capital | $10.01B | $10.00B | $10.02B | $10.00B | $6.63B | $6.62B | $6.59B | $6.58B | $6.59B | $6.68B | $6.68B | $3.41B | |
| Retained Earnings | $20.88B | $19.08B | $17.52B | $15.75B | $14.65B | $13.44B | $12.82B | $11.52B | $10.16B | $9.22B | $8.43B | $7.81B | |
| Treasury Stock | $4.92B | $2.37B | $2.23B | $1.75B | $5.08B | $5.14B | $4.82B | $3.53B | $1.45B | $432M | · | · | |
| AOCI | $277M | $-164M | $-459M | $-790M | $-127M | $-62M | $-207M | $-420M | $-364M | $-295M | $-252M | $-181M | |
| Stockholders' Equity | $29.18B | $29.03B | $26.96B | $25.32B | $17.90B | $16.19B | $15.72B | $15.46B | $16.25B | $16.49B | $16.17B | $12.34B | |
| Liabilities + Equity | $213.51B | $208.10B | $208.26B | $200.73B | $155.11B | $142.60B | $119.87B | $120.10B | $118.59B | $123.45B | $122.79B | $96.69B |
Flux de trésorerie
| Métrique | Tendance | 2025 | 2024 | 2023 | 2022 | 2021 | 2020 | 2019 | 2018 | 2017 | 2016 | 2015 | 2014 |
|---|---|---|---|---|---|---|---|---|---|---|---|---|---|
| D&A | $323M | $316M | $304M | $282M | · | · | · | $105M | $110M | $107M | $99M | $96M | |
| Deferred Tax | $-18M | $-27M | $-97M | $-30M | $87M | $-31M | $58M | $16M | $401M | $174M | $397M | $93M | |
| Amort. of Intangibles | $42M | $53M | $62M | $56M | $10M | $15M | $19M | $25M | $31M | $43M | $26M | $34M | |
| Other Non-cash | $-153M | $733M | · | · | · | · | · | · | · | · | · | · | |
| Operating Cash Flow | $3.00B | $3.61B | $3.90B | $4.57B | $2.71B | $789M | $2.36B | $2.09B | $2.78B | $1.18B | $1.74B | $1.10B | |
| CapEx | · | · | $256M | $214M | $149M | $172M | $178M | $98M | $79M | $108M | $82M | $73M | |
| Investing Cash Flow | $-6.82B | $-9.75B | $-4.76B | $16.59B | $-13.63B | $-22.02B | $727M | $-1.41B | $3.39B | $-721M | · | · | |
| Debt Issued | $3.53B | $5.50B | $5.04B | $999M | $10M | · | · | $1.77B | $2.15B | · | $1.50B | $4.35B | |
| Net Debt Issued | $-1.85B | $4.49B | $4.21B | $91M | $-844M | $-2.67B | $-1.55B | $314M | $-1.29B | $-1.12B | $-7.41B | $3.92B | |
| Stock Repurchased | $2.63B | $396M | $594M | $1.80B | · | $374M | $1.35B | $2.19B | $1.21B | $641M | · | · | |
| Net Stock Activity | $-2.63B | $-396M | $-594M | $-1.80B | · | $-374M | $-1.35B | $-2.19B | $-1.21B | $-641M | · | · | |
| Dividends Paid | $899M | $895M | $868M | $784M | $580M | $568M | $552M | $510M | $457M | $442M | $375M | $371M | |
| Financing Cash Flow | $1.80B | $-2.88B | $4.18B | $-20.98B | $10.70B | $21.35B | $-3.25B | $-495M | $-6.08B | $-510M | · | · | |
| Net Change in Cash | · | · | · | · | · | · | · | · | $100M | $-47M | $-5M | $-300M | |
| Taxes Paid | $529M | $236M | $452M | $488M | $314M | $276M | $321M | $375M | $494M | $277M | $379M | $412M | |
| Free Cash Flow | · | · | $3.65B | $4.36B | $2.57B | $617M | $2.18B | $1.99B | $2.70B | $1.08B | $1.66B | $1.03B | |
| Levered FCF | · | · | $1.29B | $4.04B | $2.48B | $368M | $1.61B | $1.59B | $2.47B | $803M | $1.45B | $838M |
Rentabilité
| Métrique | Tendance | 2025 | 2024 | 2023 | 2022 | 2021 | 2020 | 2019 | 2018 | 2017 | 2016 | 2015 | 2014 |
|---|---|---|---|---|---|---|---|---|---|---|---|---|---|
| Net Margin | 172.1% | 167.9% | 28.4% | 24.3% | 31.0% | 22.7% | 31.2% | 32.4% | 25.0% | 24.8% | 23.1% | 23.9% | |
| Pretax Margin | 222.8% | 214.8% | 37.5% | 31.9% | 41.0% | 29.7% | 41.1% | 42.3% | 41.3% | 38.9% | 35.9% | 35.7% | |
| EBITDA Margin | 19.5% | 20.5% | · | · | · | · | · | · | · | · | · | · | |
| ROA | 1.4% | 1.2% | 1.3% | 1.1% | 1.2% | 1.0% | 1.6% | 1.6% | 1.2% | 1.1% | 0.98% | 1.2% | |
| ROE | 9.9% | 8.9% | 10.3% | 7.9% | 10.5% | 8.4% | 12.2% | 12.4% | 8.6% | 8.0% | 7.4% | 8.6% |
Liquidité et Solvabilité
| Métrique | Tendance | 2025 | 2024 | 2023 | 2022 | 2021 | 2020 | 2019 | 2018 | 2017 | 2016 | 2015 | 2014 |
|---|---|---|---|---|---|---|---|---|---|---|---|---|---|
| Debt / Equity | 0.1 | 0.0 | 0.2 | 0.1 | 0.0 | 0.0 | 0.0 | 0.3 | 0.0 | 0.0 | 0.1 | 0.0 |
Efficacité
| Métrique | Tendance | 2025 | 2024 | 2023 | 2022 | 2021 | 2020 | 2019 | 2018 | 2017 | 2016 | 2015 | 2014 |
|---|---|---|---|---|---|---|---|---|---|---|---|---|---|
| Asset Turnover | 0.0 | 0.0 | 0.0 | 0.0 | 0.0 | 0.0 | 0.1 | 0.0 | 0.0 | 0.0 | 0.0 | 0.0 |
Par action
| Métrique | Tendance | 2025 | 2024 | 2023 | 2022 | 2021 | 2020 | 2019 | 2018 | 2017 | 2016 | 2015 | 2014 |
|---|---|---|---|---|---|---|---|---|---|---|---|---|---|
| Revenue / Share | $10.44 | $9.21 | $57.74 | $49.86 | $46.52 | $46.27 | $46.05 | $41.13 | $36.92 | $33.67 | $33.94 | $33.80 | |
| Cash Flow / Share | $18.91 | $21.58 | $23.38 | $27.88 | $21.08 | $6.13 | $17.53 | $14.50 | $18.24 | $7.52 | $12.67 | $8.34 | |
| Dividend / Share | $5.70 | $5.35 | $5.20 | $4.80 | · | · | · | · | · | · | · | · | |
| Dividend Paid / Share | · | · | · | · | · | · | · | · | · | · | $2.80 | $2.80 | |
| EPS (TTM) | $17.00 | $14.64 | $15.79 | $11.53 | $13.80 | $9.94 | $13.75 | $12.74 | $8.70 | $7.78 | $7.18 | $7.42 |
Taux de croissance
| Métrique | Tendance | 2025 | 2024 | 2023 | 2022 | 2021 | 2020 | 2019 | 2018 | 2017 | 2016 | 2015 | 2014 |
|---|---|---|---|---|---|---|---|---|---|---|---|---|---|
| Revenue YoY | 7.5% | 3.8% | -2.7% | -74.6% | 0.63% | · | · | · | · | · | · | · | |
| Revenue CAGR 3Y | 2.8% | -36.4% | -37.1% | · | · | · | · | · | · | · | · | · | |
| Revenue CAGR 5Y | -22.6% | · | · | · | · | · | · | · | · | · | · | · | |
| EPS YoY | 16.1% | -7.3% | 37.0% | -16.4% | 38.8% | · | · | · | · | · | · | · | |
| EPS CAGR 3Y | 13.8% | 2.0% | 16.7% | · | · | · | · | · | · | · | · | · | |
| EPS CAGR 5Y | 11.3% | · | · | · | · | · | · | · | · | · | · | · | |
| Net Income YoY | 10.2% | -5.6% | 37.6% | 7.1% | 37.4% | · | · | · | · | · | · | · | |
| Net Income CAGR 3Y | 12.7% | 11.7% | 26.5% | · | · | · | · | · | · | · | · | · | |
| Net Income CAGR 5Y | 16.1% | · | · | · | · | · | · | · | · | · | · | · | |
| Dividends Paid CAGR 5Y | 9.6% | · | · | · | · | · | · | · | · | · | · | · |
Valorisation (TTM)
| Métrique | Tendance | 2025 | 2024 | 2023 | 2022 | 2021 | 2020 | 2019 | 2018 | 2017 | 2016 | 2015 | 2014 |
|---|---|---|---|---|---|---|---|---|---|---|---|---|---|
| Revenue TTM | $1.66B | $1.54B | $1.48B | $1.52B | $5.99B | $5.95B | $6.19B | $5.93B | $5.63B | $5.30B | $4.67B | $4.46B | |
| Net Income TTM | $2.85B | $2.59B | $2.74B | $1.99B | $1.86B | $1.35B | $1.93B | $1.92B | $1.41B | $1.32B | $1.08B | $1.07B | |
| P/E | 11.9 | 12.8 | 8.7 | 12.6 | 11.1 | 12.8 | 12.3 | 11.2 | 19.7 | 20.1 | 16.9 | 16.9 | |
| Earnings Yield | 8.4% | 7.8% | 11.5% | 8.0% | 9.0% | 7.8% | 8.1% | 8.9% | 5.1% | 5.0% | 5.9% | 5.9% | |
| Payout Ratio | 31.5% | 34.6% | 31.7% | 39.4% | 31.2% | 42.0% | 28.6% | 26.6% | 32.5% | 33.6% | 34.7% | 34.8% | |
| Annual Payout | $899M | $895M | $868M | $784M | $580M | $568M | $552M | $510M | $457M | $442M | $375M | $371M |
Compte de résultat
| Métrique | Tendance | Q2 2026 | Q1 2026 | Q4 2025 | Q3 2025 | Q2 2025 | Q1 2025 | Q4 2024 | Q3 2024 | Q2 2024 | Q1 2024 | Q4 2023 | Q3 2023 | Q2 2023 | Q1 2023 | Q4 2022 | Q3 2022 |
|---|---|---|---|---|---|---|---|---|---|---|---|---|---|---|---|---|---|
| Revenue | $442M | $418M | $420M | $423M | $417M | $397M | $392M | $394M | $388M | $367M | $365M | $360M | $376M | · | · | · | |
| Interest Expense | · | · | · | · | · | · | · | · | $1.07B | $1.06B | · | $866M | $717M | $509M | · | $103M | |
| Interest Income | $2.62B | $2.54B | $2.64B | $2.68B | $2.61B | $2.56B | $2.71B | $2.79B | $2.79B | $2.75B | $2.74B | $2.64B | $2.52B | $2.33B | $2.07B | $1.78B | |
| Pretax Income | $1.06B | $863M | $971M | $1.02B | $935M | $761M | $882M | $909M | $855M | $664M | $627M | $907M | $1.16B | $926M | $1.01B | $848M | |
| Income Tax | $245M | $199M | $212M | $233M | $219M | $177M | $201M | $188M | $200M | $133M | $145M | $217M | $292M | $224M | $246M | $201M | |
| Net Income | $818M | $664M | $759M | $792M | $716M | $584M | $681M | $721M | $655M | $531M | $482M | $690M | $867M | $702M | $766M | $647M | |
| EPS (Basic) | $5.35 | $4.16 | $4.66 | $4.85 | $4.26 | $3.33 | $3.88 | $4.04 | $3.75 | $3.04 | $2.75 | $4.00 | $5.07 | $4.03 | $4.33 | $3.55 | |
| EPS (Diluted) | $5.32 | $4.13 | $4.62 | $4.82 | $4.24 | $3.32 | $3.87 | $4.02 | $3.73 | $3.02 | $2.75 | $3.98 | $5.05 | $4.01 | $4.30 | $3.53 | |
| Shares (Basic) | 145,891,000 | 149,225,000 | · | 155,558,000 | 159,221,000 | 164,209,000 | · | 166,671,000 | 166,951,000 | 166,460,000 | · | 165,909,000 | 165,842,000 | 167,732,000 | · | 174,609,000 | |
| Shares (Diluted) | 146,758,000 | 150,109,000 | · | 156,553,000 | 160,005,000 | 165,047,000 | · | 167,567,000 | 167,659,000 | 167,084,000 | · | 166,570,000 | 166,320,000 | 168,410,000 | · | 175,682,000 | |
| EBITDA | · | $79M | · | · | · | $83M | · | · | · | · | · | · | · | · | · | · |
Bilan
| Métrique | Tendance | Q2 2026 | Q1 2026 | Q4 2025 | Q3 2025 | Q2 2025 | Q1 2025 | Q4 2024 | Q3 2024 | Q2 2024 | Q1 2024 | Q4 2023 | Q3 2023 | Q2 2023 | Q1 2023 | Q4 2022 | Q3 2022 |
|---|---|---|---|---|---|---|---|---|---|---|---|---|---|---|---|---|---|
| PP&E (Net) | $1.73B | $1.72B | $1.63B | $1.62B | $1.65B | $1.66B | $1.71B | $1.69B | $1.72B | $1.71B | · | $1.68B | $1.67B | $1.66B | · | $1.62B | |
| PP&E (Gross) | · | · | $2.44B | · | · | · | $2.46B | · | · | · | · | · | · | · | · | · | |
| Accum. Depreciation | · | · | $1.36B | · | · | · | $1.33B | · | · | · | · | · | · | · | · | · | |
| Goodwill | $8.46B | $8.46B | $8.46B | $8.46B | $8.46B | $8.46B | $8.46B | $8.46B | $8.46B | $8.46B | · | $8.47B | $8.47B | $8.49B | · | $8.50B | |
| Intangibles | $48M | $55M | $64M | $74M | $84M | $93M | $94M | $107M | $119M | $132M | · | $162M | $177M | $192M | · | $227M | |
| Total Assets | $219.26B | $214.74B | $213.51B | $211.28B | $211.58B | $210.32B | $208.10B | $211.78B | $208.85B | $215.14B | · | $209.12B | $207.67B | $202.96B | · | $197.96B | |
| Short-term Debt | $4.61B | $7.85B | $2.15B | $2.06B | $2.07B | $1.57B | $1.06B | $2.60B | $4.76B | $4.79B | · | $6.73B | $7.91B | $7.00B | · | $918M | |
| Total Liabilities | $191.31B | $186.76B | $184.33B | $182.55B | $183.06B | $181.33B | $179.08B | $182.91B | $180.43B | $187.97B | · | $182.93B | $181.87B | $177.58B | · | $172.70B | |
| Long-term Debt | $13.57B | $11.18B | $10.91B | $12.93B | $12.38B | $10.50B | $12.61B | $11.58B | $11.32B | $11.45B | · | $7.12B | $7.42B | $7.46B | · | $3.46B | |
| Total Debt | $4.61B | $7.85B | · | $2.06B | $2.07B | $1.57B | · | $2.60B | $4.76B | $4.79B | · | $6.73B | $7.91B | $7.00B | · | $918M | |
| Common Stock | $90M | $90M | $90M | $90M | $90M | $90M | $90M | $90M | $90M | $90M | · | $90M | $90M | $90M | · | $90M | |
| Paid-in Capital | $9.97B | $9.96B | $10.01B | $9.99B | $9.98B | $9.97B | $10.00B | $9.99B | $9.98B | $9.98B | · | $10.01B | $10.00B | $9.99B | · | $9.99B | |
| Retained Earnings | $22.04B | $21.48B | $20.88B | $20.39B | $19.87B | $19.41B | $19.08B | $18.66B | $18.21B | $17.81B | · | $17.28B | $16.84B | $16.21B | · | $15.22B | |
| Treasury Stock | $6.49B | $6.05B | $4.92B | $4.42B | $4.03B | $2.96B | $2.37B | $2.23B | $2.05B | $2.13B | · | $2.26B | $2.27B | $2.28B | · | $1.16B | |
| AOCI | $-92M | $66M | $277M | $277M | $215M | $90M | $-164M | $-27M | $-551M | $-589M | · | $-942M | $-865M | $-645M | · | $-900M | |
| Stockholders' Equity | $27.95B | $27.97B | $29.18B | $28.73B | $28.52B | $28.99B | $29.03B | $28.88B | $28.42B | $27.17B | $26.96B | $26.20B | $25.80B | $25.38B | $25.32B | $25.26B | |
| Liabilities + Equity | $219.26B | $214.74B | $213.51B | $211.28B | $211.58B | $210.32B | $208.10B | $211.78B | $208.85B | $215.14B | · | $209.12B | $207.67B | $202.96B | · | $197.96B |
Flux de trésorerie
| Métrique | Tendance | Q2 2026 | Q1 2026 | Q4 2025 | Q3 2025 | Q2 2025 | Q1 2025 | Q4 2024 | Q3 2024 | Q2 2024 | Q1 2024 | Q4 2023 | Q3 2023 | Q2 2023 | Q1 2023 | Q4 2022 | Q3 2022 |
|---|---|---|---|---|---|---|---|---|---|---|---|---|---|---|---|---|---|
| D&A | $77M | $79M | $80M | $79M | $81M | $83M | $81M | $76M | $79M | $80M | $77M | $78M | · | · | · | · | |
| Deferred Tax | $16M | $14M | $20M | $-16M | $-16M | $-6M | $-14M | $1M | $-16M | $2M | $-57M | $-33M | $-18M | $11M | $59M | $-12M | |
| Amort. of Intangibles | $7M | $9M | $10M | $10M | $9M | $13M | $13M | $12M | $13M | $15M | $15M | $15M | $15M | $17M | $18M | $18M | |
| Other Non-cash | · | $255M | · | · | · | $-26M | · | · | · | · | · | · | · | · | · | · | |
| Operating Cash Flow | $1.27B | $1.01B | $523M | $1.00B | $844M | $635M | $1.68B | $-28M | $1.35B | $608M | $800M | $1.42B | $1.26B | $428M | $954M | $1.14B | |
| Investing Cash Flow | $-3.83B | $-4.32B | $-3.83B | $1M | $-853M | $-349M | $-6.90B | $-1.39B | $5.62B | $-7.08B | $3.79B | $-1.91B | $-4.90B | $-1.75B | $-3.67B | $6.22B | |
| Debt Issued | $2.69B | $508M | $0 | $747M | $2.04B | $743M | $1.49B | $646M | $0 | $3.36B | $1.00B | $546M | $325.0K | $3.49B | $500M | · | |
| Net Debt Issued | · | $296M | · | · | · | $-2.21B | · | · | · | $3.31B | · | · | · | $3.49B | · | · | |
| Stock Repurchased | $460M | $1.24B | $502M | $404M | $1.07B | $656M | $198M | $198M | $0 | $0 | $0 | $0 | $0 | $594M | $600M | $600M | |
| Net Stock Activity | · | $-1.24B | · | · | · | $-656M | · | · | · | · | · | · | · | $-594M | · | · | |
| Dividends Paid | $218M | $227M | $228M | $233M | $213M | $225M | $224M | $225M | $225M | $221M | $216M | $216M | $215M | $221M | $205M | $209M | |
| Financing Cash Flow | $3.65B | $891M | $1.25B | $-1.18B | $28M | $1.70B | $-4.28B | $1.85B | $-6.90B | $6.44B | $-1.52B | $408M | $3.68B | $1.62B | $1.98B | $-6.79B | |
| Taxes Paid | $222M | $34M | $215M | $164M | $80M | $70M | $-4M | $134M | $65M | $41M | $21M | $102M | $307M | $22M | $125M | $131M |
Rentabilité
| Métrique | Tendance | Q2 2026 | Q1 2026 | Q4 2025 | Q3 2025 | Q2 2025 | Q1 2025 | Q4 2024 | Q3 2024 | Q2 2024 | Q1 2024 | Q4 2023 | Q3 2023 | Q2 2023 | Q1 2023 | Q4 2022 | Q3 2022 |
|---|---|---|---|---|---|---|---|---|---|---|---|---|---|---|---|---|---|
| Net Margin | 185.1% | 158.8% | · | 187.2% | 171.7% | 147.1% | · | 183.0% | 168.8% | 23.5% | · | 29.5% | 33.3% | 29.2% | · | 28.8% | |
| Pretax Margin | 240.5% | 206.5% | · | 242.3% | 224.2% | 191.7% | · | 230.7% | 220.4% | 29.4% | · | 38.9% | 44.6% | 38.5% | · | 37.8% | |
| EBITDA Margin | · | 18.9% | · | · | · | 20.9% | · | · | · | · | · | · | · | · | · | · | |
| ROA | 0.38% | 0.31% | · | 0.37% | 0.34% | 0.27% | · | 0.34% | 0.31% | 0.25% | · | 0.34% | 0.42% | 0.40% | · | 0.37% | |
| ROE | 2.9% | 2.3% | · | 2.8% | 2.5% | 2.1% | · | 2.6% | 2.4% | 2.0% | · | 2.7% | 3.4% | 3.2% | · | 3.0% |
Liquidité et Solvabilité
| Métrique | Tendance | Q2 2026 | Q1 2026 | Q4 2025 | Q3 2025 | Q2 2025 | Q1 2025 | Q4 2024 | Q3 2024 | Q2 2024 | Q1 2024 | Q4 2023 | Q3 2023 | Q2 2023 | Q1 2023 | Q4 2022 | Q3 2022 |
|---|---|---|---|---|---|---|---|---|---|---|---|---|---|---|---|---|---|
| Debt / Equity | 0.2 | 0.3 | · | 0.1 | 0.1 | 0.1 | · | 0.1 | 0.2 | 0.2 | · | 0.3 | 0.3 | 0.3 | · | 0.0 |
Efficacité
| Métrique | Tendance | Q2 2026 | Q1 2026 | Q4 2025 | Q3 2025 | Q2 2025 | Q1 2025 | Q4 2024 | Q3 2024 | Q2 2024 | Q1 2024 | Q4 2023 | Q3 2023 | Q2 2023 | Q1 2023 | Q4 2022 | Q3 2022 |
|---|---|---|---|---|---|---|---|---|---|---|---|---|---|---|---|---|---|
| Asset Turnover | 0.0 | 0.0 | · | 0.0 | 0.0 | 0.0 | · | 0.0 | 0.0 | 0.0 | · | 0.0 | 0.0 | 0.0 | · | 0.0 |
Par action
| Métrique | Tendance | Q2 2026 | Q1 2026 | Q4 2025 | Q3 2025 | Q2 2025 | Q1 2025 | Q4 2024 | Q3 2024 | Q2 2024 | Q1 2024 | Q4 2023 | Q3 2023 | Q2 2023 | Q1 2023 | Q4 2022 | Q3 2022 |
|---|---|---|---|---|---|---|---|---|---|---|---|---|---|---|---|---|---|
| Revenue / Share | $3.01 | $2.78 | · | $2.70 | $2.61 | $2.41 | · | $2.35 | $2.31 | $13.53 | · | $14.02 | $15.65 | $14.28 | · | $12.76 | |
| Cash Flow / Share | · | $6.74 | · | · | · | $3.85 | · | · | · | $3.64 | · | · | · | $2.54 | · | · | |
| Dividend / Share | $1.50 | $1.50 | $1.50 | $1.50 | $1.35 | $1.35 | $1.35 | $1.35 | $1.35 | $1.30 | $1.30 | $1.30 | · | · | · | · | |
| EPS (TTM) | $18.89 | $17.81 | · | $16.25 | $15.45 | $14.94 | · | $13.52 | $13.48 | $14.80 | · | $17.34 | $16.89 | $12.92 | · | $10.60 |
Valorisation (TTM)
| Métrique | Tendance | Q2 2026 | Q1 2026 | Q4 2025 | Q3 2025 | Q2 2025 | Q1 2025 | Q4 2024 | Q3 2024 | Q2 2024 | Q1 2024 | Q4 2023 | Q3 2023 | Q2 2023 | Q1 2023 | Q4 2022 | Q3 2022 |
|---|---|---|---|---|---|---|---|---|---|---|---|---|---|---|---|---|---|
| Revenue TTM | $1.70B | $1.68B | · | $1.63B | $1.60B | $1.57B | · | $1.51B | $1.48B | $1.47B | · | · | · | · | · | · | |
| Net Income TTM | $3.03B | $2.93B | · | $2.77B | $2.70B | $2.64B | · | $2.39B | $2.36B | $2.57B | · | $3.02B | $2.98B | $2.33B | · | $1.68B | |
| P/E | 12.6 | 11.6 | · | 12.2 | 12.6 | 12.0 | · | 13.2 | 11.2 | 9.8 | · | 7.3 | 7.3 | 9.3 | · | 16.6 | |
| Earnings Yield | 7.9% | 8.6% | · | 8.2% | 8.0% | 8.4% | · | 7.6% | 8.9% | 10.2% | · | 13.7% | 13.7% | 10.8% | · | 6.0% | |
| Payout Ratio | · | 34.2% | · | · | · | 38.5% | · | · | · | 41.6% | · | · | · | 31.4% | · | · | |
| Annual Payout | $906M | $901M | · | $895M | $887M | $899M | · | $887M | $878M | $868M | · | $857M | $851M | $848M | · | $733M |
Période la plus récente à gauche · valeurs nulles affichées comme ·
États financiers Compte de résultat, bilan, flux de trésorerie — annuel, sur les 5 dernières années
| Métrique | 2025-12-31 | 2024-12-31 | 2023-12-31 | 2022-12-31 | 2021-12-31 |
|---|---|---|---|---|---|
| Revenu | $1.66B | $1.54B | $1.48B | $1.52B | $5.99B |
| Résultat net | $2.85B | $2.59B | $2.74B | $1.99B | $1.86B |
| BPA dilué | $17.00 | $14.64 | $15.79 | $11.53 | $13.80 |
| Métrique | 2025-12-31 | 2024-12-31 | 2023-12-31 | 2022-12-31 | 2021-12-31 |
|---|---|---|---|---|---|
| Dette / Capitaux propres | 0.1 | 0.0 | 0.2 | 0.1 | 0.0 |
| Métrique | 2025-12-31 | 2024-12-31 | 2023-12-31 | 2022-12-31 | 2021-12-31 |
|---|---|---|---|---|---|
| Flux de trésorerie libre | · | · | $3.65B | $4.36B | $2.57B |
Détenteurs institutionnels (13F) 1 228 déclarants · $35.0B total · Au 30 septembre 2026
Institutions qui déclarent détenir cette action dans leur Formulaire SEC 13F trimestriel. Uniquement les positions longues ; un même déclarant peut apparaître deux fois pour des jambes d'options distinctes. Les jambes put/call compensatoires importantes reflètent généralement la tenue de marché ou un inventaire couvert, pas une conviction directionnelle.
| Nouvelles positions | Positions clôturées | Augmenté | Diminué | Variation nette des actions |
|---|---|---|---|---|
| 126 (-2 vs T. préc.) | 69 (-15 vs T. préc.) | 391 (+2 vs T. préc.) | 407 (+29 vs T. préc.) | +2.0M |
Comparé à Q1 2026. Les dépôts de formulaire 13F de la SEC sont dus dans les 45 jours suivant la fin du trimestre, plus une courte période tampon pour les déposants tardifs — les trimestres encore dans cette fenêtre sont ignorés au profit de la paire la plus récente entièrement déclarée.
| Institution | Valeur | Actions | % de 13F suivies | Type |
|---|---|---|---|---|
| VANGUARD GROUP INC | $3 892 311 327 | 19 318 599 | 11,13% | Actions |
| BlackRock, Inc. | $3 057 477 122 | 12 846 003 | 8,74% | Actions |
| FMR LLC | $2 955 432 349 | 12 417 262 | 8,45% | Actions |
| WELLINGTON MANAGEMENT GROUP LLP | $2 332 945 697 | 9 801 881 | 6,67% | Actions |
| VANGUARD CAPITAL MANAGEMENT LLC | $2 276 983 119 | 9 566 754 | 6,51% | Actions |
| STATE STREET CORP | $1 692 880 398 | 7 112 644 | 4,84% | Actions |
| VANGUARD PORTFOLIO MANAGEMENT LLC | $1 685 238 611 | 7 080 537 | 4,82% | Actions |
| GEODE CAPITAL MANAGEMENT, LLC | $1 031 132 591 | 4 348 008 | 2,95% | Actions |
| STATE FARM MUTUAL AUTOMOBILE INSURANCE CO | $981 217 646 | 4 122 590 | 2,81% | Actions |
| JPMORGAN CHASE & CO | $967 801 286 | 4 045 990 | 2,77% | Actions |
| Invesco Ltd. | $957 998 942 | 4 025 037 | 2,74% | Actions |
| MORGAN STANLEY | $854 476 829 | 3 590 085 | 2,44% | Actions |
| NORGES BANK | $472 484 361 | 1 985 145 | 1,35% | Actions |
| DIMENSIONAL FUND ADVISORS LP | $378 358 333 | 1 589 579 | 1,08% | Actions |
| NORTHERN TRUST CORP | $355 089 500 | 1 491 910 | 1,02% | Actions |
| Bank of New York Mellon Corp | $330 977 679 | 1 390 604 | 0,95% | Actions |
| GOLDMAN SACHS GROUP INC | $325 336 994 | 1 366 905 | 0,93% | Actions |
| BANK OF AMERICA CORP /DE/ | $315 268 029 | 1 324 600 | 0,90% | Actions |
| MASSACHUSETTS FINANCIAL SERVICES CO /MA/ | $284 130 879 | 1 191 392 | 0,81% | Actions |
| Nuveen, LLC | $273 111 498 | 1 147 480 | 0,78% | Actions |
| M&T Bank Corp | $273 051 867 | 1 147 230 | 0,78% | Actions |
| Legal & General Group Plc | $254 657 128 | 1 069 943 | 0,73% | Actions |
| CHARLES SCHWAB INVESTMENT MANAGEMENT INC | $238 331 790 | 1 001 352 | 0,68% | Actions |
| JENNISON ASSOCIATES LLC | $231 986 442 | 974 692 | 0,66% | Actions |
| MENORA MIVTACHIM HOLDINGS LTD. | $229 112 948 | 962 619 | 0,65% | Actions |
| UBS AM, a distinct business unit of UBS ASSET MANAGEMENT AMERICAS LLC | $213 754 888 | 1 034 031 | 0,61% | Actions |
| UBS Group AG | $206 759 287 | 868 700 | 0,59% | Actions |
| LONDON CO OF VIRGINIA | $201 215 898 | 845 405 | 0,58% | Actions |
| VANGUARD FIDUCIARY TRUST CO | $195 664 213 | 822 084 | 0,56% | Actions |
| WELLS FARGO & COMPANY/MN | $166 202 355 | 698 300 | 0,48% | Actions |
| NEUBERGER BERMAN GROUP LLC | $156 154 526 | 656 084 | 0,45% | Actions |
| FRANKLIN RESOURCES INC | $135 911 300 | 571 032 | 0,39% | Actions |
| PANAGORA ASSET MANAGEMENT INC | $132 828 383 | 558 079 | 0,38% | Actions |
| FIRST TRUST ADVISORS LP | $132 340 037 | 556 027 | 0,38% | Actions |
| DEUTSCHE BANK AG\ | $123 657 382 | 519 547 | 0,35% | Actions |
| Brandywine Global Investment Management, LLC | $117 742 091 | 584 386 | 0,34% | Actions |
| Boston Partners | $112 912 217 | 474 401 | 0,32% | Actions |
| Canoe Financial LP | $108 597 623 | 499 644 | 0,31% | Actions |
| Korea Investment CORP | $107 696 669 | 452 488 | 0,31% | Actions |
| ALLIANCEBERNSTEIN L.P. | $97 994 996 | 474 047 | 0,28% | Actions |
| Davis Asset Management, L.P. | $97 584 100 | 410 000 | 0,28% | Actions |
| HSBC HOLDINGS PLC | $94 364 113 | 396 157 | 0,27% | Actions |
| Sumitomo Mitsui Trust Group, Inc. | $93 620 995 | 393 349 | 0,27% | Actions |
| Russell Investments Group, Ltd. | $92 581 982 | 388 827 | 0,26% | Actions |
| Amundi | $92 565 896 | 388 916 | 0,26% | Actions |
| STIFEL FINANCIAL CORP | $86 524 514 | 363 534 | 0,25% | Actions |
| Mitsubishi UFJ Asset Management Co., Ltd. | $85 454 396 | 359 037 | 0,24% | Actions |
| California Public Employees Retirement System | $85 323 015 | 358 485 | 0,24% | Actions |
| HUNTINGTON NATIONAL BANK | $85 311 259 | 358 437 | 0,24% | Actions |
| BNP PARIBAS FINANCIAL MARKETS | $82 513 069 | 346 679 | 0,24% | Actions |
Activistes et détenteurs de 5%+ 5 participations
Investisseurs ayant déposé un Schedule 13D auprès de la SEC — détention effective supérieure à 5% avec l'intention d'influencer l'émetteur (participations activistes, campagnes pour le conseil d'administration, fusions-acquisitions). Chaque ligne montre le dernier état connu de la position du déposant.
| Déclarant | Déposé | Participation | Statut | Objectif | Dépôt |
|---|---|---|---|---|---|
| The Estate of Robert G. Wilmers, Roche Foundation, Inc., Wilmers Company, L.L.C., Camden LLC, Voltaire Holdings LLC, Elisabeth Roche Wilmers, R.I. REM Investments S.A., Interlaken Foundation, Inc. | 13 février 2018 | · | Dépôt initial | · | SEC |
| Robert G. Wilmers, Roche Foundation, Inc., Wilmers Company, L.L.C., Robert G. Wilmers 1999 Family Trust, Robert G. Wilmers 2000 Family Trust, Elisabeth Roche Wilmers, R.I. REM Investments S.A., Mallarme Investments Limited, Interlaken Foundation, Inc. ×4 dépôts | 21 juillet 2016 | · | Dépôt initial | · | SEC |
| ALLIED IRISH BANKS, P.L.C. (IRS IDENTIFICATION NO ×3 dépôts | 5 novembre 2010 | · | Dépôt initial | · | SEC |
| Personne déclarante non divulguée | 11 avril 2003 | · | Dépôt initial | Investissement passif | SEC |
| Personne déclarante non divulguée, Personne déclarante non divulguée, Personne déclarante non divulguée, Personne déclarante non divulguée, Personne déclarante non divulguée, Personne déclarante non divulguée, Personne déclarante non divulguée, Personne déclarante non divulguée, Personne déclarante non divulguée, Personne déclarante non divulguée, Personne déclarante non divulguée, Personne déclarante non divulguée, Personne déclarante non divulguée, Personne déclarante non divulguée | 8 février 2002 | · | Dépôt initial | · | SEC |
Purpose is an automated classification of the filer's own stated purpose (SEC Item 4) — not investment advice. "—" means no clear purpose was stated or the text could not be classified.
Initiés de la société 86 initiés · 41 dirigeants · 41 administrateurs
| Dirigeant | Rôle | Dernière activité | Actions détenues | Achats 12m | Ventes 12m | Net 12m |
|---|---|---|---|---|---|---|
| Rene F Jones | Chairman of the Board and CEO | 14 septembre 2026 M | 103 831 | 0 | 1 | $-4 642 433 |
| WILMERS ROBERT G | Chairman of the Board and CEO | 4 mai 2017 D | 2 214 016 | 0 | 0 | $0 |
| Daryl N. Bible | Sr. EVP & CFO | 31 juillet 2026 F | 26 967 | 0 | 0 | $0 |
| Richard S Gold | President & COO | 10 février 2023 F | 59 123 | 0 | 0 | $0 |
| Mark J Czarnecki | President | 31 janvier 2017 F | 61 861 | 0 | 0 | $0 |
| Kevin J Pearson | Vice Chairman | 16 octobre 2026 S | 42 107 | 0 | 5 | $-6 632 675 |
| John R. Taylor | EVP and Controller | 17 août 2026 S | 3 062 | 0 | 3 | $-723 649 |
| Woodrow S. Tracy | Sr. Executive Vice President | 1 juillet 2026 M | 9 608 | 0 | 2 | $-459 825 |
| Christopher E Kay | Sr. Executive Vice President | 7 mai 2026 S | 6 753 | 0 | 2 | $-1 678 657 |
| Michael A. Wisler | Sr. Executive Vice President | 26 février 2026 M | 4 643 | 0 | 1 | $-1 840 805 |
| Peter D'Arcy | Sr. Executive Vice President | 13 février 2026 F | 12 737 | 0 | 0 | $0 |
| Laura P. O'Hara | Sr. EVP & Chief Legal Officer | 13 février 2026 F | 9 559 | 0 | 0 | $0 |
| Julianne Urban | Sr. EVP & Chief Auditor | 13 février 2026 F | 8 458 | 0 | 0 | $0 |
| Neeraj Singh | Sr. Executive Vice President | 30 janvier 2026 A | 2 632 | 0 | 0 | $0 |
| Michael J. Todaro | Sr. Executive Vice President | 31 janvier 2025 A | 4 375 | 0 | 0 | $0 |
| Robert J Bojdak | Sr. Executive Vice President | 30 mai 2024 G | 19 061 | 0 | 0 | $0 |
| Doris P. Meister | Sr. Executive Vice President | 3 mai 2024 S | 0 | 0 | 0 | $0 |
| Darren J King | Sr. Executive Vice President | 1 avril 2024 I | 58 332 | 0 | 0 | $0 |
| Edna Jennifer Warren | Sr. Executive Vice President | 31 janvier 2024 A | 307 | 0 | 0 | $0 |
| Scott D N Warman | Sr. Executive Vice President | 10 février 2023 F | 9 914 | 0 | 0 | $0 |
| Michele D Trolli | Sr. Executive Vice President | 10 février 2023 F | 11 859 | 0 | 0 | $0 |
| Michael R Spychala | EVP & Controller | 10 février 2023 F | 35 256 | 0 | 0 | $0 |
| Gino A. Martocci | Executive Vice President | 11 février 2022 F | 19 338 | 0 | 0 | $0 |
| John L Dangelo | Executive Vice President | 11 février 2022 F | 5 655 | 0 | 0 | $0 |
| William J Farrell II | Executive Vice President | 5 février 2021 F | 13 349 | 0 | 0 | $0 |
| Janet M. Coletti | Executive Vice President | 5 février 2020 A | 14 529 | 0 | 0 | $0 |
| Sabeth Siddique | Chief of Reg. Affairs | 17 avril 2019 S | 2 191 | 0 | 0 | $0 |
| Brian E Hickey | Executive Vice President | 17 avril 2019 S | 13 819 | 0 | 0 | $0 |
| Drew J Pfirrman | Sr. VP/General Counsel | 25 août 2016 S | 3 090 | 0 | 0 | $0 |
| Jorge G Pereira | Vice Chairman | 1 avril 2015 A | 5 300 | 0 | 0 | $0 |
| Stephen J Braunscheidel | Executive Vice President | 30 janvier 2015 F | 16 309 | 0 | 0 | $0 |
| Donald K Truslow | Executive VP and CRO | 28 février 2014 F | 943 | 0 | 0 | $0 |
| PINTO MICHAEL P | Vice Chairman | 21 novembre 2013 M | 112 132 | 0 | 0 | $0 |
| Atwood Collins III | Executive Vice President | 28 décembre 2012 F | 78 908 | 0 | 0 | $0 |
| James J Beardi | Executive Vice President | 25 mars 2011 F | 22 949 | 0 | 0 | $0 |
| Mark W Yonkman | Sr. VP/General Counsel | 30 janvier 2009 A | 5 269 | 0 | 0 | $0 |
| Adam C Kugler | Executive VP & Treasurer | 15 mai 2008 M | 36 475 | 0 | 0 | $0 |
| Gregory L Ford | Executive Vice President | 31 janvier 2007 A | · | 0 | 0 | $0 |
| Emerson L Brumback | Executive Vice President | 25 novembre 2005 S | 19 780 | 0 | 0 | $0 |
| Steven M Coen | Ex. VP & Chief Info. Officer | 27 octobre 2004 S | 109 | 0 | 0 | $0 |
| John L Pett | Executive Vice President | 28 janvier 2004 M | 166 221 | 0 | 0 | $0 |
| Rudina Seseri | Administrateur | 21 août 2026 S | 3 649 | 0 | 1 | $-150 168 |
| Kirk W Walters | Administrateur | 5 août 2026 S | 0 | 0 | 2 | $-208 963 |
| Richard H. Ledgett Jr. | Administrateur | 3 août 2026 S | 4 690 | 0 | 1 | $-212 177 |
| Jeremy M Jacobs Jr | Administrateur | 31 juillet 2026 A | 589 | 0 | 0 | $0 |
| Carlton J. Charles | Administrateur | 30 avril 2026 A | 3 408 | 0 | 0 | $0 |
| William Frank Cruger Jr. | Administrateur | 30 avril 2026 A | 9 878 | 0 | 0 | $0 |
| Jane Chwick | Administrateur | 30 avril 2026 A | 6 994 | 0 | 0 | $0 |
| Herbert L Washington | Administrateur | 30 avril 2026 A | 18 299 | 0 | 0 | $0 |
| Leslie V Godridge | Administrateur | 30 avril 2026 A | 5 121 | 0 | 0 | $0 |
| Denis J Salamone | Administrateur | 30 avril 2026 A | 45 189 | 0 | 0 | $0 |
| Melinda R Rich | Administrateur | 30 avril 2026 A | 24 109 | 0 | 0 | $0 |
| Gary N Geisel | Administrateur | 30 janvier 2026 A | 16 465 | 0 | 1 | $-191 406 |
| Jefferson T Cunningham III | Administrateur | 31 janvier 2025 A | 14 433 | 0 | 0 | $0 |
| BRADY ROBERT T | Administrateur | 30 avril 2024 A | 14 480 | 0 | 0 | $0 |
| John Scannell | Administrateur | 28 avril 2023 A | 4 393 | 0 | 0 | $0 |
| Calvin Butler JR | Administrateur | 29 avril 2022 A | 1 962 | 0 | 0 | $0 |
| Richard A. Grossi | Administrateur | 31 janvier 2022 A | 4 764 | 0 | 0 | $0 |
| David S Scharfstein | Administrateur | 30 avril 2021 A | 3 179 | 0 | 0 | $0 |
| Angela C Bontempo | Administrateur | 30 avril 2021 A | 15 363 | 0 | 0 | $0 |
| Newton P S Merrill | Administrateur | 30 avril 2021 A | 3 969 | 0 | 0 | $0 |
| John D. Hawke Jr. | Administrateur | 2 avril 2018 A | 5 998 | 0 | 0 | $0 |
| Edward G. Amoroso | Administrateur | 3 avril 2017 A | 324 | 0 | 0 | $0 |
| Patrick W E Hodgson | Administrateur | 3 octobre 2016 A | 1 869 | 0 | 0 | $0 |
| Richard G King | Administrateur | 1 juillet 2016 A | 20 198 | 0 | 0 | $0 |
| Michael D Buckley | Administrateur | 2 avril 2012 A | 4 122 | 0 | 0 | $0 |
| Robert J Bennett | Administrateur | 2 avril 2012 A | 19 636 | 0 | 0 | $0 |
| Stephen G Sheetz | Administrateur | 1 avril 2009 A | 34 167 | 0 | 0 | $0 |
| Daniel R Hawbaker | Administrateur | 1 avril 2009 A | 5 862 | 0 | 0 | $0 |
| Richard E Garman | Administrateur | 1 avril 2009 A | 258 914 | 0 | 0 | $0 |
| Reginald B Newman II | Administrateur | 1 avril 2009 A | 11 298 | 0 | 0 | $0 |
| Carlos R Carballada | Administrateur | 3 avril 2006 A | 10 566 | 0 | 0 | $0 |
| Patrick Callan | Administrateur | 3 avril 2006 A | 62 592 | 0 | 0 | $0 |
| William F Allyn | Administrateur | 3 avril 2006 A | 13 350 | 0 | 0 | $0 |
| Derek C Hathaway | Administrateur | 3 janvier 2006 A | 2 311 | 0 | 0 | $0 |
| Donald Devorris | Administrateur | 1 avril 2005 A | 32 117 | 0 | 0 | $0 |
| James V Glynn | Administrateur | 1 avril 2005 A | 13 261 | 0 | 0 | $0 |
| ALLIED IRISH BANKS PLC | Détenteur de 10% | 4 novembre 2010 S | 0 | 0 | 0 | $0 |
| John P Barnes | · | 30 avril 2026 A | 15 806 | 0 | 2 | $-8 943 360 |
| Robert E Sadler JR | · | 30 janvier 2026 A | 27 614 | 0 | 1 | $-1 140 360 |
| BAIRD BRENT D | · | 1 avril 2020 A | 34 897 | 0 | 0 | $0 |
| Heath B Mclendon | · | 1 avril 2009 A | 31 174 | 0 | 0 | $0 |
| Arthur Levitt JR | · | 1 avril 2009 A | 255 | 0 | 0 | $0 |
| Eugene J Sheehy | · | 25 avril 2005 M | 1 153 | 0 | 0 | $0 |
| John H Zachau JR | · | 18 janvier 2005 A | 28 606 | 0 | 0 | $0 |
| Michael S Piemonte | · | 18 janvier 2005 A | · | 0 | 0 | $0 |
Initiés issus des déclarations SEC Form 3/4/5 ; net = uniquement P/S de marché
Détention d'ETF Détenu par 167 ETFs
Le poids reflète uniquement les participations directes en actions (N-PORT) ; les fonds à effet de levier ou basés sur des dérivés peuvent détenir une exposition supplémentaire aux swaps non indiquée.
| Fonds | Poids | Unités | Au | Source |
|---|---|---|---|---|
| IAT · iShares Trust | 4,69% | 127 844 SH | 11 septembre 2026 | Quotidien |
| PGF · Invesco Exchange-Traded Fund Trust | 4,03% | 1 025 514 | 28 octobre 2026 | Quotidien |
| KBWB · Invesco Exchange-Traded Fund Trust … | 3,98% | 1 196 396 SH | 28 octobre 2026 | Quotidien |
| GEND · Spinnaker ETF Series | 3,92% | 773 NS | 31 juillet 2026 | N-PORT |
| DIVY · Tidal Trust I | 2,51% | 3 163 NS | 31 août 2026 | N-PORT |
| PGX · Invesco Exchange-Traded Fund Trust … | 1,74% | 2 699 394 | 28 octobre 2026 | Quotidien |
| DFNL · Davis Fundamental ETF Trust | 1,48% | 28 771 NS | 31 juillet 2026 | N-PORT |
| FBCV · FIDELITY COVINGTON TRUST | 1,37% | 9 862 NS | 31 juillet 2026 | N-PORT |
| MMID · MFS Active Exchange Traded Funds Tr… | 1,29% | 1 995 NS | 31 août 2026 | N-PORT |
| RSPF · Invesco Exchange-Traded Fund Trust | 1,25% | 18 054 SH | 28 octobre 2026 | Quotidien |
| SPVM · Invesco Exchange-Traded Fund Trust | 1,14% | 7 207 SH | 28 octobre 2026 | Quotidien |
| FFLV · FIDELITY COVINGTON TRUST | 1,04% | 692 NS | 31 juillet 2026 | N-PORT |
| SYLD · Cambria ETF Trust | 1,00% | 40 345 NS | 31 juillet 2026 | N-PORT |
| PFF · iShares Trust | 0,98% | 5 021 286 SH | 11 septembre 2026 | Quotidien |
| VMAX · Lattice Strategies Trust | 0,98% | 1 949 NS | 31 juillet 2026 | N-PORT |
| NUDV · Nushares ETF Trust | 0,94% | 1 916 NS | 31 juillet 2026 | N-PORT |
| FXO · First Trust Exchange-Traded AlphaDE… | 0,93% | 42 684 NS | 31 juillet 2026 | N-PORT |
| DPST · Direxion Shares ETF Trust | 0,93% | 16 136 NS | 31 juillet 2026 | N-PORT |
| PKW · Invesco Exchange-Traded Fund Trust | 0,89% | 69 262 SH | 28 octobre 2026 | Quotidien |
| INFO · Harbor ETF Trust | 0,82% | 28 034 NS | 31 juillet 2026 | N-PORT |
| SPLV · Invesco Exchange-Traded Fund Trust … | 0,80% | 266 958 SH | 28 octobre 2026 | Quotidien |
| SDVD · First Trust Exchange-Traded Fund IV | 0,72% | 26 705 NS | 31 juillet 2026 | N-PORT |
| RPV · Invesco Exchange-Traded Fund Trust | 0,63% | 49 206 SH | 28 octobre 2026 | Quotidien |
| ACVU · Hartford Funds Exchange-Traded Trust | 0,60% | 4 378 NS | 31 juillet 2026 | N-PORT |
| FFLC · FIDELITY COVINGTON TRUST | 0,59% | 28 558 NS | 31 juillet 2026 | N-PORT |
| LOWV · AB Active ETFs, Inc. | 0,55% | 4 815 NS | 31 août 2026 | N-PORT |
| IYF · iShares Trust | 0,53% | 97 834 SH | 11 septembre 2026 | Quotidien |
| JSTC · Tidal Trust I | 0,53% | 6 835 NS | 31 août 2026 | N-PORT |
| FTA · First Trust Exchange-Traded AlphaDE… | 0,52% | 29 509 NS | 31 juillet 2026 | N-PORT |
| VOE · VANGUARD INDEX FUNDS | 0,51% | 795 720 SH | 19 août 2026 | Quotidien |
| IMCV · iShares Trust | 0,49% | 23 776 SH | 11 septembre 2026 | Quotidien |
| GSY · Invesco Actively Managed Exchange-T… | 0,49% | 19 250 000 | 28 octobre 2026 | Quotidien |
| IYG · iShares Trust | 0,48% | 44 426 SH | 11 septembre 2026 | Quotidien |
| HDV · iShares Trust | 0,42% | 268 098 SH | 11 septembre 2026 | Quotidien |
| VFH · VANGUARD WORLD FUND | 0,41% | 242 698 SH | 19 août 2026 | Quotidien |
| FNCL · FIDELITY COVINGTON TRUST | 0,41% | 39 134 NS | 31 juillet 2026 | N-PORT |
| EQIN · Columbia ETF Trust I | 0,38% | 4 689 NS | 31 juillet 2026 | N-PORT |
| IWS · iShares Trust | 0,34% | 219 438 SH | 11 septembre 2026 | Quotidien |
| JPME · J.P. Morgan Exchange-Traded Fund Tr… | 0,34% | 6 492 NS | 31 juillet 2026 | N-PORT |
| VO · VANGUARD INDEX FUNDS | 0,34% | 3 173 919 SH | 19 août 2026 | Quotidien |
| FFSM · FIDELITY COVINGTON TRUST | 0,33% | 19 890 NS | 31 juillet 2026 | N-PORT |
| FAS · Direxion Shares ETF Trust | 0,30% | 28 854 NS | 31 juillet 2026 | N-PORT |
| ROUS · Lattice Strategies Trust | 0,30% | 8 617 NS | 31 juillet 2026 | N-PORT |
| FEX · First Trust Exchange-Traded AlphaDE… | 0,28% | 17 761 NS | 31 juillet 2026 | N-PORT |
| BSCS · Invesco Exchange-Traded Self-Indexe… | 0,28% | 9 685 000 | 28 octobre 2026 | Quotidien |
| JVAL · J.P. Morgan Exchange-Traded Fund Tr… | 0,27% | 9 029 NS | 31 juillet 2026 | N-PORT |
| VRP · Invesco Exchange-Traded Fund Trust … | 0,26% | 5 300 377 | 28 octobre 2026 | Quotidien |
| FAB · First Trust Exchange-Traded AlphaDE… | 0,26% | 1 783 NS | 31 juillet 2026 | N-PORT |
| IWR · iShares Trust | 0,26% | 601 592 SH | 11 septembre 2026 | Quotidien |
| DIVB · iShares Trust | 0,26% | 21 954 SH | 11 septembre 2026 | Quotidien |
| GTOS · Invesco Actively Managed Exchange-T… | 0,26% | 327 000 | 28 octobre 2026 | Quotidien |
| IMCB · iShares Trust | 0,24% | 17 132 SH | 11 septembre 2026 | Quotidien |
| VFMF · VANGUARD WELLINGTON FUND | 0,23% | 6 716 SH | 19 août 2026 | Quotidien |
| SIZE · iShares Trust | 0,22% | 3 936 SH | 11 septembre 2026 | Quotidien |
| IXG · iShares Trust | 0,22% | 6 328 SH | 11 septembre 2026 | Quotidien |
| VLUE · iShares Trust | 0,21% | 84 940 SH | 11 septembre 2026 | Quotidien |
| DGRO · iShares Trust | 0,20% | 366 612 SH | 11 septembre 2026 | Quotidien |
| EUSA · iShares, Inc. | 0,20% | 15 953 SH | 11 septembre 2026 | Quotidien |
| XOEF · iShares Trust | 0,20% | 182 SH | 11 septembre 2026 | Quotidien |
| GSEW · Goldman Sachs ETF Trust | 0,19% | 16 475 NS | 31 août 2026 | N-PORT |
| RSP · Invesco Exchange-Traded Fund Trust | 0,18% | 825 223 SH | 28 octobre 2026 | Quotidien |
| HDUS · Lattice Strategies Trust | 0,16% | 1 294 NS | 31 juillet 2026 | N-PORT |
| DFLV · Dimensional ETF Trust | 0,15% | 42 562 NS | 31 juillet 2026 | N-PORT |
| VFVA · VANGUARD WELLINGTON FUND | 0,15% | 5 260 SH | 19 août 2026 | Quotidien |
| VYM · VANGUARD WHITEHALL FUNDS | 0,14% | 585 959 SH | 19 août 2026 | Quotidien |
| USXF · iShares Trust | 0,14% | 8 613 SH | 11 septembre 2026 | Quotidien |
| DFUV · Dimensional ETF Trust | 0,13% | 81 728 NS | 31 juillet 2026 | N-PORT |
| VTV · VANGUARD INDEX FUNDS | 0,13% | 1 393 062 SH | 19 août 2026 | Quotidien |
| VEGN · ETF Series Solutions | 0,12% | 879 NS | 31 juillet 2026 | N-PORT |
| GSLC · Goldman Sachs ETF Trust | 0,12% | 78 465 NS | 31 août 2026 | N-PORT |
| VOOV · VANGUARD ADMIRAL FUNDS | 0,12% | 33 710 SH | 19 août 2026 | Quotidien |
| IVE · iShares Trust | 0,12% | 242 973 SH | 11 septembre 2026 | Quotidien |
| GTO · Invesco Actively Managed Exchange-T… | 0,11% | 1 375 792 | 28 octobre 2026 | Quotidien |
| BSCR · Invesco Exchange-Traded Self-Indexe… | 0,11% | 5 154 000 | 28 octobre 2026 | Quotidien |
| IUSV · iShares Trust | 0,11% | 127 797 SH | 11 septembre 2026 | Quotidien |
| IQSU · New York Life Investments ETF Trust | 0,11% | 1 473 NS | 31 juillet 2026 | N-PORT |
| SCHV · SCHWAB STRATEGIC TRUST | 0,11% | 72 347 NS | 31 août 2026 | N-PORT |
| NULV · Nushares ETF Trust | 0,10% | 9 133 NS | 31 juillet 2026 | N-PORT |
| ILCV · iShares Trust | 0,10% | 5 697 SH | 11 septembre 2026 | Quotidien |
| VONV · VANGUARD SCOTTSDALE FUNDS | 0,10% | 88 609 SH | 19 août 2026 | Quotidien |
| DSI · iShares Trust | 0,10% | 22 152 SH | 11 septembre 2026 | Quotidien |
| IWD · iShares Trust | 0,09% | 325 641 SH | 11 septembre 2026 | Quotidien |
| GVUS · Goldman Sachs ETF Trust | 0,09% | 1 643 NS | 31 août 2026 | N-PORT |
| DEUS · DBX ETF Trust | 0,09% | 1 149 NS | 31 août 2026 | N-PORT |
| PRF · Invesco Exchange-Traded Fund Trust | 0,09% | 39 118 SH | 28 octobre 2026 | Quotidien |
| SNPE · DBX ETF Trust | 0,08% | 10 444 NS | 31 août 2026 | N-PORT |
| LGDX · Tidal Trust III | 0,08% | 464 NS | 31 juillet 2026 | N-PORT |
| EGLE · Global X Funds | 0,08% | 7 NS | 31 juillet 2026 | N-PORT |
| XMAG · Tidal Trust II | 0,08% | 610 NS | 31 août 2026 | N-PORT |
| JUST · Goldman Sachs ETF Trust | 0,08% | 1 855 NS | 31 août 2026 | N-PORT |
| FNDX · SCHWAB STRATEGIC TRUST | 0,08% | 88 345 NS | 31 août 2026 | N-PORT |
| DFSU · Dimensional ETF Trust | 0,07% | 6 797 NS | 31 juillet 2026 | N-PORT |
| APUE · Trust for Professional Managers | 0,07% | 7 661 NS | 31 août 2026 | N-PORT |
| FNDB · SCHWAB STRATEGIC TRUST | 0,07% | 4 445 NS | 31 août 2026 | N-PORT |
| AFLG · First Trust Exchange-Traded Fund VI… | 0,07% | 2 271 NS | 31 août 2026 | N-PORT |
| TOPC · iShares Trust | 0,07% | 91 SH | 11 septembre 2026 | Quotidien |
| CATH · Global X Funds | 0,06% | 3 364 NS | 31 juillet 2026 | N-PORT |
| XCLR · Global X Funds | 0,06% | 9 NS | 31 juillet 2026 | N-PORT |
| XTR · Global X Funds | 0,06% | 12 NS | 31 juillet 2026 | N-PORT |
| RWL · Invesco Exchange-Traded Fund Trust … | 0,06% | 28 189 SH | 27 octobre 2026 | Quotidien |
| VV · VANGUARD INDEX FUNDS | 0,06% | 171 045 SH | 19 août 2026 | Quotidien |
| ESGV · VANGUARD WORLD FUND | 0,06% | 33 166 SH | 19 août 2026 | Quotidien |
| XYLD · Global X Funds | 0,06% | 7 868 NS | 31 juillet 2026 | N-PORT |
| XVV · iShares Trust | 0,06% | 1 679 SH | 11 septembre 2026 | Quotidien |
| EQAL · Invesco Exchange-Traded Fund Trust … | 0,06% | 2 205 SH | 28 octobre 2026 | Quotidien |
| XYLG · Global X Funds | 0,06% | 153 NS | 31 juillet 2026 | N-PORT |
| CHRI · Global X Funds | 0,06% | 19 NS | 31 juillet 2026 | N-PORT |
| DFAU · Dimensional ETF Trust | 0,06% | 29 436 NS | 31 juillet 2026 | N-PORT |
| XRMI · Global X Funds | 0,06% | 118 NS | 31 juillet 2026 | N-PORT |
| DFAC · Dimensional ETF Trust | 0,06% | 110 966 NS | 31 juillet 2026 | N-PORT |
| PTLC · Pacer Funds Trust | 0,06% | 7 426 NS | 31 juillet 2026 | N-PORT |
| BBUS · J.P. Morgan Exchange-Traded Fund Tr… | 0,06% | 20 166 NS | 31 juillet 2026 | N-PORT |
| BKLC · BNY Mellon ETF Trust | 0,06% | 12 354 NS | 31 juillet 2026 | N-PORT |
| VOTE · TCW ETF Trust | 0,06% | 2 475 NS | 31 juillet 2026 | N-PORT |
| GSUS · Goldman Sachs ETF Trust | 0,05% | 7 647 NS | 31 août 2026 | N-PORT |
| IVV · iShares Trust | 0,05% | 1 845 934 SH | 11 septembre 2026 | Quotidien |
| ILCB · iShares Trust | 0,05% | 2 836 SH | 11 septembre 2026 | Quotidien |
| DFUS · Dimensional ETF Trust | 0,05% | 44 444 NS | 31 juillet 2026 | N-PORT |
| SPUU · Direxion Shares ETF Trust | 0,05% | 552 NS | 31 juillet 2026 | N-PORT |
| VOXP · Advisors Series Trust | 0,05% | 12 NS | 31 juillet 2026 | N-PORT |
| QDPL · Pacer Funds Trust | 0,05% | 3 501 NS | 31 juillet 2026 | N-PORT |
| VOO · VANGUARD INDEX FUNDS | 0,05% | 3 801 825 SH | 19 août 2026 | Quotidien |
| VTI · VANGUARD INDEX FUNDS | 0,05% | 4 648 421 SH | 19 août 2026 | Quotidien |
| VONE · VANGUARD SCOTTSDALE FUNDS | 0,05% | 24 536 SH | 19 août 2026 | Quotidien |
| VTHR · VANGUARD SCOTTSDALE FUNDS | 0,05% | 12 338 SH | 19 août 2026 | Quotidien |
| GLOV · Goldman Sachs ETF Trust | 0,05% | 3 842 NS | 31 août 2026 | N-PORT |
| TOV · EA Series Trust | 0,05% | 553 NS | 31 juillet 2026 | N-PORT |
| IWB · iShares Trust | 0,05% | 101 312 SH | 11 septembre 2026 | Quotidien |
| TILT · FlexShares Trust | 0,05% | 4 424 NS | 31 juillet 2026 | N-PORT |
| IYY · iShares Trust | 0,05% | 6 268 SH | 11 septembre 2026 | Quotidien |
| SCHX · SCHWAB STRATEGIC TRUST | 0,05% | 156 286 NS | 31 août 2026 | N-PORT |
| PBP · Invesco Exchange-Traded Fund Trust | 0,05% | 866 SH | 28 octobre 2026 | Quotidien |
| PBUS · Invesco Exchange-Traded Fund Trust … | 0,05% | 23 476 SH | 28 octobre 2026 | Quotidien |
| GUSA · Goldman Sachs ETF Trust II | 0,05% | 4 929 NS | 31 août 2026 | N-PORT |
| IWV · iShares Trust | 0,05% | 40 317 SH | 11 septembre 2026 | Quotidien |
| SCHK · SCHWAB STRATEGIC TRUST | 0,05% | 11 999 NS | 31 août 2026 | N-PORT |
| ITOT · iShares Trust | 0,05% | 190 671 SH | 11 septembre 2026 | Quotidien |
| SCHB · SCHWAB STRATEGIC TRUST | 0,05% | 88 238 NS | 31 août 2026 | N-PORT |
| HCMT · Direxion Shares ETF Trust | 0,04% | 1 018 NS | 31 juillet 2026 | N-PORT |
| DCOR · Dimensional ETF Trust | 0,04% | 6 013 NS | 31 juillet 2026 | N-PORT |
| SPXL · Direxion Shares ETF Trust | 0,04% | 11 448 NS | 31 juillet 2026 | N-PORT |
| PHDG · Invesco Actively Managed Exchange-T… | 0,04% | 114 SH | 28 octobre 2026 | Quotidien |
| TOK · iShares Trust | 0,04% | 401 SH | 11 septembre 2026 | Quotidien |
| URTH · iShares, Inc. | 0,04% | 13 732 SH | 11 septembre 2026 | Quotidien |
| KOKU · DBX ETF Trust | 0,04% | 1 312 NS | 31 août 2026 | N-PORT |
| DXUV · Dimensional ETF Trust | 0,04% | 843 NS | 31 juillet 2026 | N-PORT |
| SPXD · DBX ETF Trust | 0,03% | 10 NS | 31 août 2026 | N-PORT |
| ACWI · iShares Trust | 0,03% | 45 371 SH | 11 septembre 2026 | Quotidien |
| SFY · Tidal Trust I | 0,03% | 892 NS | 31 août 2026 | N-PORT |
| VFQY · VANGUARD WELLINGTON FUND | 0,03% | 683 SH | 19 août 2026 | Quotidien |
| VT · VANGUARD INTERNATIONAL EQUITY INDEX… | 0,03% | 129 539 SH | 19 août 2026 | Quotidien |
| QVML · Invesco Exchange-Traded Fund Trust … | 0,03% | 2 199 SH | 28 octobre 2026 | Quotidien |
| USNZ · DBX ETF Trust | 0,02% | 288 NS | 31 août 2026 | N-PORT |
| USCL · iShares Trust | 0,02% | 2 008 SH | 11 septembre 2026 | Quotidien |
| USCA · DBX ETF Trust | 0,02% | 2 451 NS | 31 août 2026 | N-PORT |
| BIV · VANGUARD BOND INDEX FUNDS | · | · | 15 juillet 2026 | Quotidien |
| BSV · VANGUARD BOND INDEX FUNDS | · | · | 15 juillet 2026 | Quotidien |
| BND · VANGUARD BOND INDEX FUNDS | · | · | 15 juillet 2026 | Quotidien |
| VUSB · VANGUARD BOND INDEX FUNDS | · | · | 15 juillet 2026 | Quotidien |
| VCRB · VANGUARD MALVERN FUNDS | · | · | 15 juillet 2026 | Quotidien |
| VPLS · VANGUARD MALVERN FUNDS | · | · | 15 juillet 2026 | Quotidien |
| VSDB · VANGUARD MALVERN FUNDS | · | · | 15 juillet 2026 | Quotidien |
| VCSH · VANGUARD SCOTTSDALE FUNDS | · | · | 15 juillet 2026 | Quotidien |
| VCIT · VANGUARD SCOTTSDALE FUNDS | · | · | 15 juillet 2026 | Quotidien |
| VTC · VANGUARD SCOTTSDALE FUNDS | · | · | 30 juillet 2026 | Quotidien |
| BNDW · VANGUARD SCOTTSDALE FUNDS | · | · | 30 juillet 2026 | Quotidien |
| VCEB · VANGUARD WORLD FUND | · | · | 30 juillet 2026 | Quotidien |
MTB Consensus des analystes Opinions des analystes haussières et baissières, objectif de cours à 12 mois, potentiel de hausse
Objectif de cours à 12 mois
21 analystes · 2026-10-29Objectif moyen $245.93 +11,7%
Comparaison des pairs (sous-secteur GICS) Indicateurs clés par rapport aux pairs du secteur
Base F.A., prix à la clôture de la dernière fin d'exercice de chaque société.
| Ticker | Capitalisation Boursière | P/E | Revenus Année/Année | Marge Nette | ROE | Marge Brute |
|---|---|---|---|---|---|---|
| MTB | · | 11.9 | 7.5% | 172.1% | 9.9% | · |
| TFC | $62.13B | 12.9 | 53.0% | 26.1% | 8.2% | · |
| HBAN | · | · | · | · | · | · |
| CFG | $25.07B | 15.1 | 5.6% | 22.2% | 7.1% | · |
| RF | · | 11.8 | · | 28.6% | 11.4% | · |
| EWBC | $15.46B | 11.8 | 12.2% | 45.2% | 15.5% | · |
| PNFP | $7.41B | 11.8 | 18.3% | 31.2% | 9.5% | · |
| FHN | $11.59B | 12.8 | 7.2% | 28.7% | 11.1% | · |
| WTFC | $9.36B | 12.3 | 5.9% | 310.1% | 11.4% | · |
| SSB | $9.33B | 12.0 | 56.1% | 29.8% | 8.9% | · |
| UMBF | $8.74B | 12.4 | 62.8% | 26.5% | 9.4% | · |
Dernières actualités Actualités récentes mentionnant cette entreprise
Signaux de trading Signaux d'achat/vente récents avec prix d'entrée et ratio risque/récompense
Aucun signal ouvert pour le moment — aucune carte n'est remplie, et c'est honnête.
Mes métriques Votre watchlist personnelle — lignes sélectionnées de Fondamentaux Complets
Choisissez les indicateurs qui vous importent — cliquez sur le + à côté de n'importe quelle ligne dans les Fondamentaux complets ci-dessus.
Votre sélection est enregistrée et vous suit sur tous les tickers.