
JNJ Johnson & Johnson Common Stock
About Johnson & Johnson Common Stock Company overview from Wikipedia
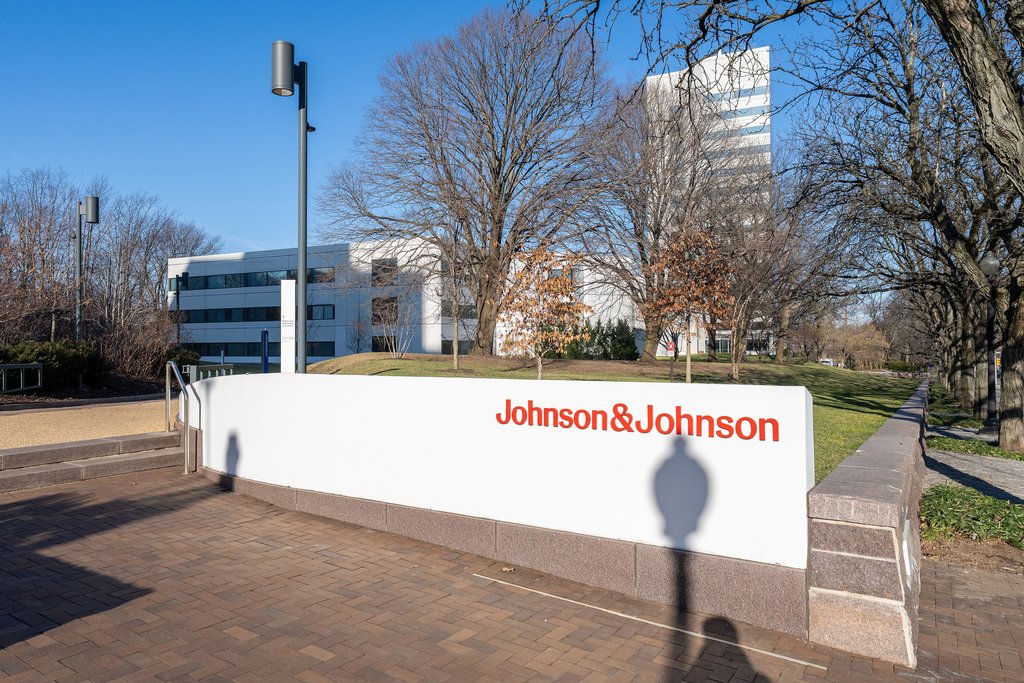
Johnson & Johnson (J&J) is an American multinational pharmaceutical, biotechnology, and medical technologies corporation headquartered in New Brunswick, New Jersey. The company is ranked No. 48 on the 2025 Fortune 500 list of the largest United States corporations. In 2025, the company was ranked 42nd in the Forbes Global 2000. Along with Microsoft, Johnson & Johnson is one of only two U.S.-based companies that has a prime credit rating of AAA from S&P Global.
Read more
Johnson & Johnson (J&J) is an American multinational pharmaceutical, biotechnology, and medical technologies corporation headquartered in New Brunswick, New Jersey. The company is ranked No. 48 on the 2025 Fortune 500 list of the largest United States corporations. In 2025, the company was ranked 42nd in the Forbes Global 2000. Along with Microsoft, Johnson & Johnson is one of only two U.S.-based companies that has a prime credit rating of AAA from S&P Global.
History
1873–1885: Before Johnson & Johnson
Robert Wood Johnson began his professional training at age 16 as a pharmaceutical apprentice at an apothecary run by his mother's cousin, James G. Wood, in Poughkeepsie, New York. Johnson co-founded his own company with George J. Seabury in 1873. The New York-based Seabury & Johnson became known for its medicated plasters. Robert Wood Johnson represented the company at the Centennial Exposition in 1876. There he heard Joseph Lister's explanation of a new procedure: antiseptic surgery. Johnson parted ways with his business partner Seabury in 1885.
1886: Founding of Johnson & Johnson
Robert Wood Johnson joined his brothers, James Wood Johnson and Edward Mead Johnson, and created a line of ready-to-use sterile surgical dressings in 1886. They founded Johnson & Johnson in 1886 with 14 employees, eight women and six men. Johnson & Johnson opened its first factory building in the old Janeway and Carpenter factory on Neilson Street in New Brunswick, New Jersey.
They manufactured sterile surgical supplies, household products, and medical guides. Those products initially featured a logo that resembled the signature of James Wood Johnson. Robert Wood Johnson served as the first president of the company.
1887–1942: Early history
The company sold medicated plasters such as Johnson & Johnson's Black Perfect Taffeta Court Plaster and also manufactured the world's first sterile surgical products, including sutures, absorbent cotton, and gauze. The company published "Modern Methods of Antiseptic Wound Treatment", a guide on how to do sterile surgery using its products, and in 1888, distributed 85,000 copies to doctors and pharmacists across the United States. The manual was translated into three languages and distributed worldwide. The first commercial first aid kit was designed in 1888 to support railroad construction workers, who were often hundreds of miles from medical care. The kits included antiseptic emergency supplies and directions for field use. In 1901, the company published the Handbook of First Aid, a guide on applying first aid.
In 1889, the company hired pharmacist Fred Kilmer as its first scientific director, who led its scientific research and wrote educational manuals. Kilmer's first achievement as scientific director was developing the industrial sterilization process. He was employed at the company until 1934.
Johnson & Johnson had more than 400 employees and 14 buildings by 1894. In 1894, the company began producing Johnson's Baby Powder, the company's first baby product.
The company introduced the world's first maternity kit in 1894 to aid at-home births, called Dr. Simpson's Maternity Packet, presumably after Scottish obstetrician James Young Simpson. The kit included a washcloth; safety pins; sterile sutures, sponges, and gauze; antiseptic soap; an obstetric sheet and ligatures; flannel to wrap the baby in; and a chart for keeping birth records. The products were later marketed separately, including "Lister's Towels", the world's first mass-produced sanitary napkins. Kilmer wrote "Hygiene in Maternity", an instructional guide for mothers before and after delivery. In 1904, the company expanded its baby care products with "Lister's Sanitary Diapers", a diaper product for infants.
During the Spanish–American War, Johnson & Johnson developed and donated 300,000 packaged compressed surgical dressings for soldiers in the field and created a trauma stretcher for field medics. The company donated its products in disaster relief efforts of the 1900 Galveston hurricane and the 1906 San Francisco earthquake.
Johnson & Johnson vaccinated all of its employees against smallpox during the 1901 smallpox epidemic. The firm employed more than 1,200 people by 1910. Women accounted for half of the company's workforce and led a quarter of its departments.
Robert Wood Johnson died in 1910, and he was succeeded as president of the company by his brother James Wood Johnson.
During World War I, Johnson & Johnson factories ran round-the-clock shifts to supply sterile dressings, gauze, and surgical sutures to the Allied forces and European hospitals.
In 1916, the company acquired Chicopee Manufacturing Company in Chicopee Falls, Massachusetts, to meet demand. Near the end of World War I, the Spanish flu broke out. The company invented and distributed an epidemic mask that helped prevent the spread of the flu.
In 1919, Johnson & Johnson opened the Gilmour Plant near Montreal, its first factory outside the United States, which produced surgical products for international customers. In 1924 the company's first overseas manufacturing facility was opened in Slough, England.
In 1920, Earle Dickson combined two Johnson & Johnson products, adhesive tape and gauze, to create the first commercial adhesive bandage. Band-Aid Brand Adhesive Bandages began sales the following year. In 1921, the company released Johnson's Baby Soap. Named after its Massachusetts facility, Johnson & Johnson built a textile mill and company town, Chicopee, outside Gainesville, Georgia. In the 1930s, the company expanded operations to Argentina, Brazil, Mexico, and South Africa. In 1931, Johnson & Johnson introduced the first prescription contraceptive gel marketed as Ortho-Gynol.
Robert Wood Johnson II became president of the company in 1932.
During the Great Depression, Johnson & Johnson kept all its workers employed and raised wages by 5%. In 1933, Robert Wood Johnson II wrote a letter to Franklin D. Roosevelt, calling for a federal law to increase wages and reduce hours for all American workers. The company also opened a new facility in Chicago during that period. Johnson wrote and distributed "Try Reality: A Discussion of Hours, Wages, and The Industrial Future" to persuade business leaders to follow his lead, advocating that business is more than profit and that companies have responsibilities to consumers, employees, and society. In "Try Reality", the section titled "An Industrial Philosophy" would later become the company's credo.
In 1935, Johnson's Baby Oil was added to its line of baby products. Both male and female Johnson & Johnson employees were drafted and enlisted during World War II. The company ensured no one would lose their job when they returned home.
Robert Wood Johnson II was appointed head of the Smaller War Plants Corporation in Washington, D.C. His work ensured U.S. factories with under 500 employees were awarded government contracts.
1943: Credo and IPO
In 1943, as the company was preparing for its initial public offering (IPO), Robert Wood Johnson wrote what the company called "Our Credo", a defining document that has been used to guide the company's decisions over the years.
The company became a public company via an initial public offering in 1944.
In 1943, Vesta Stoudt identified a need for waterproof tape for ammunition boxes in World War Two. She wrote to Franklin D. Roosevelt with the idea; the president commissioned Revolite, a subsidiary of Johnson & Johnson at the time, to develop and manufacture a cloth-based adhesive tape, later duct tape.
1944–1999: Acquisitions and international expansion
In 1944, the company began selling Johnson's Baby Lotion. The same year, the company established Ethicon Suture Laboratories. In 1947, G. F. Merson Ltd. was acquired to expand the company's suture business in the United Kingdom. The company was rebranded and absorbed into Ethicon.
Johnson & Johnson chairman of the board, Robert Wood Johnson, published Or Forfeit Freedom, in 1947. The book outlined that businesses need to develop sustainable methods of using natural resources for the future of business and the planet.
In 1955, Ethicon developed a micro-point reverse-cutting ophthalmic needle attached to the suture. Micro-point surgical needles and sutures allowed for advances in modern vision surgery.
In 1956, the company opened its first Asia-based operating company in the Philippines.
Johnson & Johnson opened its first operating company in India in 1957.
In 1959, Johnson & Johnson acquired McNeil Consumer Healthcare.
A year later, the company sold Tylenol for the first time without a prescription. In the same year, Cilag Chemie joined Johnson & Johnson as Cilag.
In 1961, Johnson & Johnson acquired Janssen Pharmaceuticals, which had been founded in 1953 by Belgian scientist Paul Janssen, the inventor of Fentanyl.
In 1963, Philip B. Hofmann succeeded Robert Wood Johnson as chairman and CEO. He was the first non-Johnson family member to become chief executive. Hofmann also helped found the Robert Wood Johnson Foundation. In the same year, the Food and Drug Administration approved a synthetic hormone contraceptive pill, Ortho-Novum.
In 1965, Johnson & Johnson acquired Codman & Shurtleff. The acquired company produced neurovascular devices and neurosurgery technologies. In 1968, the company developed the RhoGAM vaccine. The vaccine prevented Rh hemolytic disease in newborns.
In 1969, Ortho Diagnostics, a company subsidiary, launched the Sickledex Tube Test for detecting anemia. The same year, the FDA approved the Johnson & Johnson arterial graft. In 1971, the company launched Hapindex Diagnostic Test, a rapid hepatitis B test for blood donors. The test was developed to prevent the spread of hepatitis B through blood transfusions.
In the 1970s, Johnson & Johnson hired Henry N. Cobb from Pei Cobb Freed & Partners to design its new headquarters. The firm designed Johnson & Johnson Plaza across the railroad tracks from the older section of the Johnson & Johnson campus.
In 1973, Richard Sellars became chairman and CEO of Johnson & Johnson.
In 1976, James E. Burke became the company's chairman and CEO. During Burke's tenure, he managed the 1982 Tylenol tampering incident. It became a case study on crisis management. Under his leadership, the company recalled 31 million bottles of Tylenol, relaunched the product with a triple tamper-evident seal, and urged consumers not to use if tampered with. These practices became the pharmaceutical and packaged food industry norm.
Johnson & Johnson opened operating companies in China and Egypt in 1985. In 1987, Acuvue contact lenses became the first disposable contact lenses available to consumers. The lenses lasted up to one week, reducing the cost of contact lenses. In the same year, the company launched One Touch, a blood glucose monitoring system.
In 1989, Ralph S. Larsen was appointed chairman and CEO of the company.
After the dissolution of the Soviet Union, Johnson & Johnson expanded into eastern Europe. By 1991, the company had a presence in Hungary, Russia, the Czech Republic, and Poland. In the 1990s, the company acquired Clean & Clear, Neutrogena, Motrin, and Aveeno.
In 1997, Johnson & Johnson acquired Biosense Webster, based in Haifa.
DePuy was acquired by Johnson & Johnson in 1998 for $3.5 billion.
2000–2019
William C. Weldon was appointed chairman and CEO of the company in 2002.
In 2003, Ethicon launched Vicryl Plus Antibacterial Sutures. The products prevent post-surgery infection within stitches. In 2006, Johnson & Johnson acquired Pfizer's consumer healthcare business and merged it with its consumer healthcare business group. The acquisition added brands like Listerine, Bengay, and Neosporin to the company's portfolio. In the same year, Johnson & Johnson's Janssen Pharmaceuticals, launched Prezista, a protease inhibitor for patients with failed previous HIV therapies.
In October 2008, the company acquired HealthMedia, later renamed to Health & Wellness Solutions and the Human Performance Institute.
In December 2008, Johnson & Johnson acquired Mentor Corporation for $1 billion and merged its operations into Ethicon.
In October 2010, J&J acquired Crucell for $2.4 billion. The subsidiary operates as the centre for vaccines, within Johnson & Johnson pharmaceuticals business group.
In April 2012, Alex Gorsky became chairman and CEO of Johnson & Johnson.
In November 2015, Biosense Webster acquired Coherex Medical, expanding the company's range of treatment options for patients with atrial fibrillation.
In February 2017, Johnson & Johnson acquired Abbott Medical Optics from Abbott Laboratories for $4.325 billion, adding the new division into Johnson & Johnson Vision.
In June 2017, Johnson & Johnson acquired Actelion in a $30 billion deal, the largest ever purchase by the company. After the purchase, Johnson & Johnson spun off Actelion's research and development unit into a separate legal entity.
In August 2017, Johnson & Johnson Vision acquired TearScience.
In September 2017, the company acquired subscription-based contact lens startup Sightbox.
In September 2018, Johnson & Johnson Medical GmbH acquired Emerging Implant Technologies GmbH, manufacturer of 3D-printed titanium interbody implants for spinal fusion surgery.
In March 2019, the FDA approved esketamine for the treatment of severe depression, which is marketed as Spravato by Janssen Pharmaceuticals.
In 2019, Johnson & Johnson began production of photochromic contact lenses. The lenses adjust to sunlight and help eyes recover from bright light exposure faster. The lenses contain a photochromic additive that adapts visible light amounts filtered to the eyes and are the first to use such additives.
2020: COVID-19 pandemic
Johnson & Johnson committed over $1 billion toward the development of the not-for-profit Janssen COVID-19 vaccine in partnership with the Biomedical Advanced Research and Development Authority (BARDA) Office of the Assistant Secretary for Preparedness and Response (ASPR) at the U.S. Department of Health and Human Services (HHS).
Janssen Vaccines, in partnership with Beth Israel Deaconess Medical Center (BIDMC), developed the Janssen COVID-19 vaccine based on the same technology used to make its Ebola vaccine.
Demand for Tylenol surged two to four times normal levels in March 2020. In response, the company increased production globally; the Tylenol plant in Puerto Rico operated 24 hours a day, seven days a week.
In response to the shortage of ventilators, Ethicon, with Prisma Health, made and distributed the VESper Ventilator Expansion Splitter, which uses 3D printing technology, to allow one ventilator to support two patients.
In August 2020, the Federal government of the United States agreed to pay more than $1 billion to Johnson & Johnson for the production of 100 million doses of the Janssen COVID-19 vaccine. Johnson & Johnson and the National Institute of Allergy and Infectious Diseases (NIAID) began clinical trials of J&J's vaccine in September 2020.
In September 2020, Johnson & Johnson started its 60,000-person phase 3 adenovirus-based vaccine trial. The trial was paused on October 12, 2020, because a volunteer became ill, but the company said it found no evidence that the vaccine had caused the illness and announced on October 23, 2020, that it would resume the trial.
2020-present
In November 2020, Johnson & Johnson acquired Momenta Pharmaceuticals for $6.5 billion.
In January 2022, Joaquin Duato became CEO of Johnson & Johnson.
In December 2022, Johnson & Johnson acquired cardiovascular medical technology company Abiomed for $16.6 billion.
Kenvue, the consumer products division of Johnson & Johnson that owned Neutrogena, Aveeno, Tylenol, Listerine, Johnson's, Band-Aid and other brands became a public company via an initial public offering in May 2023. At that time, Johnson & Johnson maintained a controlling stake of around 91%. In July 2023, Johnson & Johnson launched an exchange offer to split-off Kenvue, reducing its stake to 9.5%. In 2024, Johnson & Johnson sold its remaining 9.5% stake in Kenvue.
Johnson & Johnson holds a patent on the tuberculosis-treating drug bedaquiline, with secondary patents in at least 25 out of 43 countries with a high burden of tuberculosis blocking affordable generic versions of the drug, preventing millions of people from accessing the life-saving treatment. Though the patent was set to expire in many countries in 2023, Johnson & Johnson applied to extend the patent. In July 2023, Stop TB Partnership announced that after negotiations with Johnson & Johnson, it had been granted licenses to produce generic versions of the drug.
Johnson & Johnson acquired Ambrx Biopharma for $2 billion in January 2024, Shockwave Medical for $13.1 billion in April 2024, and Proteologix for $850 million in May 2024.
In June 2024, Johnson & Johnson MedTech released Polyphonic, a digital surgical platform. The platform features surgery planning, surgical video, and telepresence services for laparoscopic surgeries.
In April 2025, Johnson & Johnson acquired Intra-Cellular Therapies, a company specializing in medications for behavioral disorders, including schizophrenia, depression, and bipolar disorder, for $14.6 billion.
In October 2025, Johnson & Johnson announced plans to spin off its orthopedics business as a standalone company, DePuy Synthes, targeting completion within 18 to 24 months. The business, which manufactures joint implants, surgical instruments, and other orthopaedic products, generated about $9.2 billion in sales in 2024.
In November 2025, the company acquired Halda Therapeutics for $3.05 billion.
In April 2026, the company acquired Atraverse Medical. That July, the company completed a $1 billion acquisition of Firefly Bio, a biotechnology company developing antibody-based protein-degrading treatments for cancer.
Chairmen history
Robert Wood Johnson I (1887–1910)
James Wood Johnson (1910–1932)
Robert Wood Johnson II (1932–1963)
Philip B. Hofmann (1963–1973)
Richard B. Sellars (1973–1976)
James E. Burke (1976–1989)
Ralph S. Larsen (1989–2002)
William C. Weldon (2002–2012)
Alex Gorsky (2012–2022)
Joaquin Duato (2023–present)
Business segments
The company operates 2 divisions: Innovative Medicine (64% of 2025 revenues) and MedTech (36% of 2025 revenues).
Johnson & Johnson Innovation, LLC (JJI) is a subsidiary of Johnson & Johnson. JJI focuses on early-stage, life science, and technology innovations to advance the company's research and development pipeline. JJI provides startups with sourcing, infrastructure, and capital equipment at JLABS, financing & venture capital at JJDC, Inc., and collaborations leading to the potential development of medical device technologies, pharmaceuticals, and therapeutics. There are 4 JJI Innovation Centers located in London, Shanghai, Boston (Cambridge), and the San Francisco Bay Area. There are 13 JLABS incubators located in the Bay Area (San Francisco and South San Francisco), Belgium (Beerse), Boston (Cambridge and Lowell), Houston (TMC), New York City, Philadelphia, San Diego, Shanghai, Toronto, and Washington, D.C.
Innovative Medicine
The Innovative Medicine (formerly known as pharmaceuticals) segment is focused on six therapeutic areas: immunology (rheumatoid arthritis, inflammatory bowel disease and psoriasis); infectious diseases (HIV/AIDS); neuroscience (mood disorders, neurodegenerative disorders and schizophrenia); oncology (solid tumours including lung cancer, prostate cancer and bladder cancer, and hematologic malignancies); cardiovascular, metabolism, retina (thrombosis and diabetes), and pulmonary hypertension (pulmonary arterial hypertension).
Major products produced by the Innovative Medicine division are CARVYKTI (ciltacabtagene autoleucel) for multiple myeloma (2.0% of revenues); DARZALEX (daratumumab and hyaluronidase-fihj), also for multiple myeloma (15.2% of revenues); ERLEADA (apalutamide), for prostate cancer (3.8% of revenues); REMICADE (infliximab), for inflammatory diseases (1.9% of revenues); SIMPONI/SIMPONI ARIA (golimumab), for rheumatoid arthritis, psoriatic arthritis, ankylosing spondylitis, and polyarticular juvenile idiopathic arthritis (pJIA) (2.8% of revenues); STELARA (ustekinumab), for plaque psoriasis, psoriatic arthritis, Crohn's disease, and ulcerative colitis (6.5% of revenues); TREMFYA (guselkumab), for plaque psoriasis, psoriatic arthritis, Crohn's disease, and ulcerative colitis (5.5% of revenues); INVEGA SUSTENNA/XEPLION (paliperidone palmitate), for schizophrenia (4.1% of revenues); SPRAVATO (Esketamine), a nasal spray for depression (1.8% of revenues); OPSUMIT (macitentan)/OPSYNVI (macitentan/tadalafil) for pulmonary arterial hypertension (2.5% of revenues); and UPTRAVI (selexipag) for pulmonary arterial hypertension (2.0% of revenues).
MedTech
The MedTech division produces products used for cardiovascular (9.5% of revenues), orthopaedics (DePuy Synthes) (9.8% of revenues), surgery (Ethicon) (10.8% of revenues), and vision treatments (Johnson & Johnson Vision) (5.8% of revenues).
The Cardiovascular & Specialty Solutions Group includes electrophysiology products that diagnose and treat cardiac arrhythmias; devices used in the endovascular treatment of hemorrhagic and ischemic stroke; solutions that focus on breast reconstruction and aesthetics, and ear, nose and throat procedures.
The DePuy Synthes orthopaedics portfolio is composed of specialties including joint reconstruction, trauma, extremities, craniomaxillofacial, spinal surgery and sports medicine, in addition to the VELYS digital surgery portfolio.
The Ethicon surgical portfolio includes advanced surgical innovations and solutions such as sutures, staplers, energy devices, and advanced hemostats, as well as interventional ablation, surgical robotics, and digital solutions.
In July 2026, the Food and Drug Administration granted De Novo marketing authorization for Johnson & Johnson's Ottava robotic surgical system for multiple upper-abdominal general surgery procedures, marking the company's entry into the U.S. soft-tissue robotic surgery market.
The Johnson & Johnson Vision portfolio includes contact lenses, intraocular lens, automated treatment for dry eye, and four brands of laser vision correction systems.
Corporate affairs
Financials
Board of directors
The members of the board of directors of Johnson & Johnson are:
Joaquin Duato
Mary Beckerle
Jennifer Doudna
Marillyn Hewson
Paula Johnson
Hubert Joly
Mark McClellan
John Morikis
Daniel Pinto
Mark Weinberger
Nadja West
Eugene Woods
Environmental record
In 2017, Johnson & Johnson was ranked 10th on the "Green Rankings" by Newsweek.
In 2020, the company agreed to spend $800 million to change its packaging to make it more sustainable by using only recyclable, reusable or compostable plastic, and recycled paper and pulp-based packaging.
Johnson & Johnson operates a 75 kilowatt solar electric system in Spring House, Pennsylvania.
Independent climate-data platforms show that most of Johnson & Johnson's emissions come from its supply chain rather than from its own buildings. Tracenable and DitchCarbon estimate that "purchased goods and services" – the production of medicines, medical devices and packaging that J&J buys – accounts for about 72% of its Scope 3 emissions, roughly 4.8 million metric tons of CO₂e per year. This matches wider health-care research finding that about 70% of the sector's climate footprint is embedded in global supply chains for drugs, equipment and other goods.
Contributions
Johnson & Johnson has provided funding to nonprofit organizations including the Institute for Advanced Study, the Human Rights Campaign, Women Deliver, the Foundation for the National Institutes of Health (FNIH), the Pandemic Action Network, and the C. D. Howe Institute.
Recalls and litigation
1982 Chicago Tylenol murders
On September 29, 1982, a "Tylenol scare" began when the first of seven individuals died in Chicago metropolitan area, after ingesting Extra Strength Tylenol that had been deliberately laced with cyanide. Within a week, the company pulled 31 million bottles of capsules back from retailers, making it one of the first major recalls in American history. The incident led to reforms in the packaging of over-the-counter substances and to federal anti-tampering laws. The case remains unsolved and no suspects have been charged. Johnson & Johnson's quick response, including a nationwide recall, was widely praised by public relations experts and the media and was the gold standard for corporate crisis management.
2010 children's product recall
In April 2010, McNeil Consumer Healthcare, a subsidiary of Johnson & Johnson, voluntarily recalled 43 over-the-counter children's medicines, including Tylenol, Tylenol Plus, Motrin, Zyrtec and Benadryl. The recall was conducted after a routine inspection at a manufacturing facility in Fort Washington, Pennsylvania, United States, revealed that some "products may not fully meet the required manufacturing specifications". Affected products may contain a "higher concentration of active ingredients" or exhibit other manufacturing defects. Products shipped to Canada, Dominican Republic, Mexico, Guam, Guatemala, Jamaica, Puerto Rico, Panama, Trinidad and Tobago, the United Arab Emirates, Kuwait and Fiji were included in the recall. A dedicated website was established by the company listing affected products and other consumer information.
2010 hip-replacement recall
In August 2010, DePuy Synthes, a division of Johnson & Johnson, recalled its ASR (articular surface replacement) hip prostheses from the market. DePuy said the recall was due to unpublished National Joint Registry data showing a 12% revision rate for resurfacing at five years and an ASR XL revision rate of 13%. All hip prostheses fail in some patients, but it is expected that the rate will be about 1% a year.
Pathologically, the failing prosthesis had several effects. Metal debris from wear of the implant led to a reaction that destroyed the soft tissues surrounding the joint, leaving some patients with long term disability. Ions of cobalt and chromium – the metals from which the implant was made – were also released into the blood and cerebrospinal fluid in some patients.
In March 2013, a jury in Los Angeles ordered Johnson & Johnson to pay more than $8.3 million in damages to a Montana man in the first related case.
The issue was estimated to affect 8,000 patients in the U.S. In November 2013, the company announced a settlement of the issue in the U.S., estimating a cost of $2.5 billion.
2010 Tylenol recall
In 2010 and 2011, Johnson & Johnson voluntarily recalled some over-the-counter products, including Tylenol, due to an odor caused by 2,4,6-Tribromoanisole, which was used to treat wooden pallets on which product packaging materials were transported and stored.
Shareholders lawsuit
In 2010, a group of shareholders sued the board for allegedly failing to take action to prevent serious failings and illegalities since the 1990s, including manufacturing problems, bribing officials, covering up adverse effects and misleading marketing for unapproved uses. In 2012, Johnson and Johnson proposed a settlement with the shareholders, whereby the company would institute new oversight, quality and compliance procedures binding for five years.
Illegal marketing of Risperdal
In November 2013, Johnson & Johnson agreed to pay $2.2 billion to resolve criminal and civil liability arising from allegations relating to Risperdal, Invega, and Natrecor, including promotion for uses not approved by the Food and Drug Administration (FDA) and payment of kickbacks to physicians and to long-term care pharmacy providers. The settlement amount includes criminal fines and forfeiture totaling $485 million and civil settlements with the federal government and states totaling $1.72 billion. States that have awarded damages include Texas ($158 million), South Carolina ($327 million), Louisiana ($258 million), and Arkansas ($1.2 billion).
In 2010, the United States Department of Justice joined a whistleblowers suit accusing the company of illegally marketing Risperdal through Omnicare, the largest company supplying pharmaceuticals to nursing homes. The allegations include that J&J were warned by the FDA to not promote Risperdal as effective and safe for elderly patients, but it did so, and that it paid Omnicare to promote the drug to care home physicians. The settlement was finalized on November 4, 2013, with J&J agreeing to pay a penalty of around $2.2 billion, "including criminal fines and forfeiture totaling $485 million and civil settlements with the federal government and states totaling $1.72 billion".
Johnson & Johnson has also been subject to congressional investigations related to payments given to psychiatrists to promote its products and ghost write articles, notably Joseph Biederman and his pediatric bipolar disorder research unit.
Foreign bribery
In 2011, J&J settled litigation brought by the US Securities and Exchange Commission under the Foreign Corrupt Practices Act and paid around $70M in disgorgement and fines. J&J's employees had given kickbacks and bribes to doctors in Greece, Poland, and Romania to obtain business selling drugs and medical devices and had bribed officials in Iraq to win contracts under the Oil for Food program. J&J fully cooperated with the investigation once the problems came to light.
Consumer fraud settlements
In May 2017, J&J reached an agreement to pay $33 million to several states to settle consumer fraud allegations in some of the company's over-the-counter drugs.
Use of the Red Cross symbol
Johnson & Johnson registered the Red Cross as a U.S. trademark for "medicinal and surgical plasters" in 1905 and has used the design since 1887. The Geneva Conventions, which reserved the Red Cross emblem for specific uses, were first approved in 1864 and ratified by the United States in 1882. However, the emblem was not protected by U.S. law for the use of the American Red Cross (ARC) and the U.S. military until after Johnson & Johnson had obtained its trademark. A clause in this law (now 18 U.S.C. 706) permits this pre-existing use of the Red Cross to continue.
A declaration made by the U.S. upon its ratification of the 1949 Geneva Conventions includes a reservation that pre-1905 U.S. domestic uses of the Red Cross, such as Johnson & Johnson's, would remain lawful as long as the cross is not used on "aircraft, vessels, vehicles, buildings or other structures, or upon the ground", i.e., uses which could be confused with its military uses. This means that the U.S. did not agree to any interpretation of the 1949 Geneva Conventions that would overrule Johnson & Johnson's trademark. The American Red Cross continues to recognize the validity of Johnson & Johnson's trademark.
In August 2007, Johnson & Johnson filed a lawsuit against the American Red Cross, demanding that the charity halt the use of the red cross symbol on products it sells to the public, though the company takes no issue with the charity's use of the mark for nonprofit purposes. In May 2008, the judge in the case dismissed most of Johnson & Johnson's claims, and, a month later, the two organizations settled the case, allowing both parties to use the symbol.
Boston Scientific lawsuits
Beginning in 2003, Johnson & Johnson and Boston Scientific were involved in a series of patent disputes involving coronary stents and related medical devices. In September 2009, Boston Scientific agreed to pay Johnson & Johnson $716 million to settle 14 patent-infringement lawsuits, followed by a $1.73 billion settlement of three additional stent patent disputes in February 2010.
Separately, Johnson & Johnson sued Guidant and Abbott Laboratories in 2006, alleging that Guidant had breached its merger agreement with Johnson & Johnson before being acquired by Boston Scientific. The case went to trial in 2014, with Johnson & Johnson seeking more than $5 billion in damages and interest. In February 2015, Boston Scientific agreed to pay Johnson & Johnson $600 million to settle the lawsuit, without admitting liability on Guidant's behalf, and Johnson & Johnson agreed to permanently dismiss the case.
Humira patent-infringement case against Abbott
In 2007, Johnson & Johnson sued Abbott Laboratories over the development and sale of Humira, claiming Abbott used technology licensed exclusively to Johnson & Johnson's Centocor division. Johnson & Johnson won the court case, and in 2009 Abbott was ordered to pay Johnson & Johnson $1.17 billion in lost revenues and $504 million in royalties. The judge also added $175.6 million in interest to bring the total to $1.84 billion, at the time the largest patent-infringement award in U.S. history. In 2010, Abbott appealed the verdict and in 2011, it won the appeal. The United States Supreme Court elected not to hear the case.
Vaginal mesh implants
Tens of thousands of women worldwide have taken legal action against Johnson & Johnson after suffering serious complications following a vaginal mesh implant procedure. In Australia, more than 700 women began a class action against the company in the Federal Court of Australia in 2017, telling the court they "suffered irreparable, debilitating pain after the devices began to erode into surrounding tissue and organs, causing infections and complications". The class action alleged that Johnson & Johnson, which "aggressively marketed" the implants "failed to properly warn patients and surgeons of the risk, or test the devices adequately". Emails between executives show the company was aware of the risks in 2005 but still went ahead and made the product available. In November 2019 the Federal Court of Australia found Johnson & Johnson negligent. The judgment was appealed, with the appeals court upholding all findings of Justice Anna Katzmann. Ethicon then sought a High Court decision but this was not permitted by the High Court of Australia. Subsequently (September 2022) a A$300,000,000 compensation agreement was reached between Shine Lawyers and J&J but this agreement remains subject to approval by the Federal Court of Australia.
In 2016, California and Washington filed a lawsuit against the company, accusing it of deception. In October 2019, the company and its subsidiary, Ethicon, reached a settlement with 41 states and the District of Columbia, with no admission of liability, in a suit alleging deceptive marketing of transvaginal surgical-mesh devices. The suit also alleges that the company failed to disclose risks associated with the product, which J&J pulled from the US market in 2012. The amount settled in the suit was about $117 million.
Cancer links to talc-based baby powder
Johnson & Johnson has been the subject of over 60,000 lawsuits claiming that its baby powder causes ovarian cancer. The lawsuits focus on claims that the talc-based powder is contaminated with asbestos, a known carcinogen commonly found in places where talc is mined.
In 2016, J&J was ordered to pay $72 million in damages to the family of Jacqueline Fox, a 62-year-old woman who died of ovarian cancer in 2015. The company said it would appeal. A year later, over 1,000 U.S. women had sued J&J for covering up the possible cancer risk from its Baby Powder product. The company says that adults use 70% of its Baby Powder. Later that year, a California jury ordered Johnson & Johnson to pay $417 million to a woman who claimed she developed ovarian cancer after using the company's talc-based products like Johnson's Baby Powder for feminine hygiene. The verdict included $70 million in compensatory damages and $347 million in punitive damages. J&J said it would appeal the verdict. The Missouri Eastern District appeals court later negated a $72 million jury verdict in the Jacqueline Fox lawsuit, ruling it lacked jurisdiction in Missouri because of a U.S. Supreme Court decision that imposed limits on where injury lawsuit can be filed. Subsequently, this ruling killed three other recent St. Louis jury verdicts of more than $200 million combined. Fox, 62, of Birmingham, Alabama, died in 2015, about four months before her trial was held in St. Louis Circuit Court. She was among 65 plaintiffs, of whom only two were from Missouri.
A St. Louis jury awarded nearly $4.7 billion in damages to 22 women and their families in 2018 after they claimed that asbestos in Johnson & Johnson talcum powder caused their ovarian cancer. In August, J&J said that it removed several chemicals from baby powder products and re-engineered them to make consumers more confident that products were safer for children. The company was forced to release internal documents with 11,700 people suing J&J over cancers allegedly caused by baby powder. The documents showed that the company had known about asbestos contamination since at least as early as 1971 and had spent decades finding ways to conceal the evidence from the public.
The company lost its request to reverse a jury verdict that ruled in favor of the accusers, which required the company to pay $4.14 billion in punitive damages and $550 million in compensatory damages. A 2003 meta-analysis involving 11,933 subjects found a 33% relative risk increase of ovarian cancer for regular genital talc use, increased from a baseline of 0.0121% to 0.0161%. Two more studies over the next twelve years, which also relied on self-reporting, had similar results; however, none of the three studies showed a relationship between how long someone used talc and how much their cancer risk increased, which is expected in experiments with carcinogens and other toxic substances (see dose–response relationship).
Conversely, a St. Louis jury ruled in favor of Johnson & Johnson in a case involving a single plaintiff who had used the company's talc-containing baby powder for 30 years, with a similar claim. The company's CEO, Alex Gorsky, declined to appear at a United States congressional hearing on the safety of J&J's Baby Powder and other talc-based cosmetics. J&J spokesman Ernie Knewitz said that the subcommittee had rejected the company's offers to send a talc testing expert or a J&J executive in charge of consumer products. In response to declining demand, J&J announced it would discontinue the sale of talc-based baby powder in the United States and Canada in 2020, but would continue to sell it in other markets. In a statement, the company said that the existing retail inventory of the talc-based powder will sell until it runs out, while the company's corn starch-based baby powder will continue to sell in the United States and Canada.
The Supreme Court of Missouri refused to consider J&J's appeal of a $2.12 billion damages award to women who blamed their ovarian cancer on its talc-based products.
The Supreme Court of the United States also refused to consider an appeal from J&J, leaving in place a judgment from a state appeal court that had cut the original award to $2.1 billion. Two of the justices had to recuse: Samuel Alito because either he and/or his wife owning or recently owning stock in J&J, and Brett Kavanaugh, whose father led an industry group lobbying against safety warnings on talc products. Representing the affected women during the trial, W. Mark Lanier remarked that the Supreme Court's decision sent "a clear message to the rich and powerful: You will be held to account when you cause grievous harm under our system of equal justice under law." J&J had argued that the combined claims in the St. Louis trial were too different, yet the short jury deliberation and identical payouts were, therefore, a violation of the company's due process and also that the high punitive award was unconstitutional.
In 2021, Johnson & Johnson subsidiary LTL Management LLC, using a process called a Texas two-step bankruptcy, filed for Chapter 11 bankruptcy in North Carolina. The process permitted by Texas law allows a company to create a separate subsidiary to assume liabilities, while the existing company continues operating normally. The new company, with a different name, can be located in a state such as North Carolina, where bankruptcy laws differ and then declare bankruptcy, paying less than the original company would have. In the case of LTL, a $2 billion trust will be created, compared to $25 billion if Johnson & Johnson had declared bankruptcy. According to the filing, a company known as Old JJCI assumed the baby powder-related liabilities in 1979, while Johnson & Johnson remained a defendant. LTL and New JJCI were created, with LTL taking the baby powder-related liabilities and some assets, and New JJCI taking the remaining assets. Johnson & Johnson says LTL is now based in New Jersey. The cases were dismissed as bad-faith filings.
The company announced that it would stop making talc-based powder by 2023 and replace it with cornstarch-based powders. The company says the talc-based powder is safe to use and does not contain asbestos.
Lawsuits showed connections between Johnson & Johnson and the Holmesburg Prison experiments.
In 2023, the number of lawsuits regarding talc-based baby powder exceeded 40,000 as more claimants came forward to say that the company's product caused them to have cancer. Johnson & Johnson offered $9 billion to settle all the lawsuits against the company, up from the previous figure of $2 billion.
In February 2025, as the number of talc-based powder-related lawsuits stood at over 62,000, Johnson & Johnson offered a $10 billion settlement to end litigation, funded by a subsidiary's Chapter 11 bankruptcy filing. In April 2025, a judge rejected the bankruptcy and thereby rejected the offer. The company then said it would "return to the tort system to litigate and defeat these meritless talc claims"
In October 2025, a Los Angeles court ordered J&J to pay $966 million to the family of a woman who died from mesothelioma in 2021. The ruling came days after a South Carolina court rejected a lawsuit by a man who similarly claimed asbestos fibers in baby powder caused his cancer. J&J called the ruling unconstitutional and said it would appeal. Since this ruling, J&J has seen a 17% rise in talc cancer-related suits.
In December 2025, a jury awarded $40 million to women who said talc was to blame for cancer.
In July 2026, Johnson & Johnson agreed to pay an estimated $5.5 billion to resolve about 76,000 existing claims alleging that its talc-based products caused ovarian cancer. The agreement covers nearly all of the remaining ovarian-cancer talc claims and would become final if at least 95 percent of the claimants accept it. Unlike the company's earlier bankruptcy-based proposals, the agreement applies only to existing claims and does not cover future lawsuits. Johnson & Johnson continued to deny that its talc products caused cancer.
Opioid epidemic
By 2018, the company had become embroiled in the opioid epidemic in the United States and had become a target of lawsuits.
In Idaho, J&J is part of a lawsuit accusing the company for being partially to blame for opioid-related overdose deaths. The first major trial began in Oklahoma in May 2019. On August 26, 2019, the Oklahoma judge ordered J&J to pay $572 million for its part in the opioid crisis, and in October J&J paid $20.4 million to two Ohio counties fighting the opioid epidemic. In January 2022, Johnson & Johnson agreed to pay up to $5 billion as part of a $26 billion settlement which included McKesson, AmerisourceBergen, and Cardinal Health. Had the states gone to court, the companies could have faced up to $95 billion in penalties.
Northeastern Ohio settlement
In October 2019, the company agreed to a settlement of $20.4 million with northeastern Ohio's most populous counties of Cuyahoga (containing Cleveland) and Summit (Akron). The settlement allows the company avoidance of a trial accusing J&J and many other pharmaceutical manufacturers of helping to spark the US opioid epidemic. The trial was thought to be an indicator for thousands of opioid-related lawsuits against many drug manufacturers. The arrangement, which contains no admission of liability by the company, provides the counties $10 million in cash, $5 million for legal expenses and $5.4 million in contributions to opioid-related nonprofit organizations in the counties.
Source: Wikipedia, CC BY-SA 4.0 · View on Wikipedia ↗
JNJ Stock Snapshot Price, market cap, P/E, EPS, ROE, debt/equity, 52-week range
JNJ Stock Price Chart Daily OHLCV with technical indicators — pan, zoom, and customize your view
10-Year Performance Revenue, net income, margins and EPS trends
Valuation P/E, P/S, P/B, EV/EBITDA ratios — is the stock expensive or cheap?
Profitability Gross, operating and net margins; ROE, ROA, ROIC
Financial Health Debt, liquidity, solvency — balance sheet strength
Growth Revenue, EPS and net income growth: YoY, 3Y CAGR, 5Y CAGR
Capital Efficiency Asset turnover, inventory turnover, receivables turnover
Dividends Yield, payout ratio, dividend history, 5Y CAGR
| Ex-date | Amount |
|---|---|
| May 26, 2026 | $1.3400 |
| Feb. 24, 2026 | $1.3000 |
| Nov. 25, 2025 | $1.3000 |
| Aug. 26, 2025 | $1.3000 |
| May 27, 2025 | $1.3000 |
| Feb. 18, 2025 | $1.2400 |
| Nov. 26, 2024 | $1.2400 |
| Aug. 27, 2024 | $1.2400 |
| May 20, 2024 | $1.2400 |
| Feb. 16, 2024 | $1.1900 |
| Nov. 20, 2023 | $1.1900 |
| Aug. 25, 2023 | $1.1900 |
| May 22, 2023 | $1.1900 |
| Feb. 17, 2023 | $1.1300 |
| Nov. 21, 2022 | $1.1300 |
| Aug. 22, 2022 | $1.1300 |
| May 23, 2022 | $1.1300 |
| Feb. 18, 2022 | $1.0600 |
| Nov. 22, 2021 | $1.0600 |
| Aug. 23, 2021 | $1.0600 |
JNJ Analyst Consensus Bullish and bearish analyst opinions, 12-month price target, upside
- Strong Buy 7 22.6%
- Buy 15 48.4%
- Hold 9 29.0%
- Sell 0 0.0%
- Strong Sell 0 0.0%
12-Month Price Target
22 analysts · 2026-08-21Earnings History EPS actual vs estimate, surprise %, beat rate, next earnings date
| Period | EPS Actual | EPS Est | Surprise |
|---|---|---|---|
| June 30, 2026 | $2.90 | $2.87 | 0.03% |
| March 31, 2026 | $2.70 | $2.69 | 0.01% |
| Dec. 31, 2025 | $2.46 | $2.46 | -0.00% |
| Sept. 30, 2025 | $2.80 | $2.78 | 0.02% |
| June 30, 2025 | $2.77 | $2.71 | 0.06% |
| March 31, 2025 | $2.77 | $2.61 | 0.16% |
Peer comparison (GICS sub-industry) Key metrics vs sector peers
| Ticker | Market Cap | P/E | Rev YoY | Net Margin | ROE | Gross Margin |
|---|---|---|---|---|---|---|
| JNJ | — | 18.8 | 6.0% | 28.5% | 35.0% | 67.9% |
| LLY | — | 46.8 | 44.7% | 31.7% | 101.2% | — |
| MRK | — | 14.5 | 1.3% | 28.1% | 36.9% | — |
| PFE | — | 18.3 | -1.7% | 12.4% | 8.9% | — |
| BMY | — | 15.6 | -0.22% | 14.6% | 40.5% | — |
| RPRX | — | 21.7 | 5.1% | 32.4% | 8.0% | — |
| ZTS | $53.46B | 20.9 | 2.3% | 28.2% | 66.0% | — |
| VTRS | — | -4.2 | -3.0% | -24.6% | -23.2% | 35.1% |
| CORT | $3.69B | 42.4 | 12.8% | 13.1% | 15.5% | — |
| ELAN | $11.25B | -48.1 | 6.2% | -4.9% | -3.5% | 55.0% |
Full Fundamentals All metrics by year — income statement, balance sheet, cash flow
Income Statement 17
| Metric | Trend | 2025 | 2024 | 2023 | 2022 | 2021 | 2020 | 2019 | 2018 | 2017 | 2016 | 2015 | 2014 |
|---|---|---|---|---|---|---|---|---|---|---|---|---|---|
| Revenue | $94.19B | $88.82B | $85.16B | $79.99B | $78.74B | $82.58B | $82.06B | $81.58B | $76.45B | $71.89B | $70.07B | $74.33B | |
| Cost of Revenue | $30.26B | $27.47B | $26.55B | $24.60B | $23.40B | $28.43B | $27.56B | $27.09B | $25.44B | $21.79B | $21.54B | $22.75B | |
| Gross Profit | $63.94B | $61.35B | $58.61B | $55.39B | $55.34B | $54.16B | $54.50B | $54.49B | $51.01B | $50.10B | $48.54B | $51.59B | |
| R&D Expense | $109M | $1.84B | $483M | $0 | $0 | · | · | · | · | · | · | · | |
| SG&A Expense | $23.68B | $22.87B | $21.51B | $20.25B | $20.12B | $22.08B | $22.18B | $22.54B | $21.52B | $20.07B | $21.20B | $21.95B | |
| Operating Income | · | · | · | · | · | · | · | · | · | · | · | $21.59B | |
| Interest Expense | · | · | $772M | $276M | $183M | $201M | $318M | $1.00B | $934M | $726M | $552M | $533M | |
| Interest Income | $1.06B | $1.33B | $1.26B | $490M | $53M | $111M | $357M | $611M | $385M | $368M | $128M | $67M | |
| Other Non-op | $7.21B | $-4.69B | $-6.63B | $-810M | $-526M | $-2.90B | $-2.52B | $-1.41B | $42M | $-210M | $2.06B | $70M | |
| Pretax Income | $32.58B | $16.69B | $15.06B | $19.36B | $19.18B | $16.50B | $17.33B | $18.00B | $17.67B | $19.80B | $19.20B | $20.56B | |
| Income Tax | $5.78B | $2.62B | $1.74B | $2.99B | $1.38B | $1.78B | $2.21B | $2.70B | $16.37B | $3.26B | $3.79B | $4.24B | |
| Net Income | $26.80B | $14.07B | $35.15B | $17.94B | $20.88B | $14.71B | $15.12B | $15.30B | $1.30B | $16.54B | $15.41B | $16.32B | |
| EPS (Basic) | $11.13 | $5.84 | $13.88 | $6.83 | $7.93 | $5.59 | $5.72 | $5.70 | $0.48 | $6.04 | $5.56 | $5.80 | |
| EPS (Diluted) | $11.03 | $5.79 | $13.72 | $6.73 | $7.81 | $5.51 | $5.63 | $5.61 | $0.47 | $5.93 | $5.48 | $5.70 | |
| Shares (Basic) | 2,407,400,000 | 2,407,300,000 | 2,533,500,000 | 2,625,200,000 | 2,632,100,000 | 2,632,800,000 | 2,645,100,000 | 2,681,500,000 | 2,692,000,000 | 2,737,300,000 | 2,771,800,000 | 2,815,200,000 | |
| Shares (Diluted) | 2,429,400,000 | 2,429,400,000 | 2,560,400,000 | 2,663,900,000 | 2,674,000,000 | 2,670,700,000 | 2,684,300,000 | 2,728,700,000 | 2,745,300,000 | 2,788,900,000 | 2,812,900,000 | 2,863,900,000 | |
| EBITDA | $7.50B | $7.34B | $7.49B | $6.97B | $7.39B | $7.23B | $7.01B | $6.93B | $5.64B | $3.75B | $3.75B | $25.48B |
Balance Sheet 29
| Metric | Trend | 2025 | 2024 | 2023 | 2022 | 2021 | 2020 | 2019 | 2018 | 2017 | 2016 | 2015 | 2014 |
|---|---|---|---|---|---|---|---|---|---|---|---|---|---|
| Cash & Equivalents | $19.71B | $24.11B | $21.86B | $12.89B | $14.49B | $13.98B | $17.30B | $18.11B | $17.82B | $18.97B | $13.73B | $14.52B | |
| Short-term Investments | $393M | $417M | $1.07B | $9.39B | $17.12B | $11.20B | $1.98B | $1.58B | $472M | $22.93B | $24.64B | $18.57B | |
| Receivables | $17.18B | $14.84B | $14.87B | $14.04B | $15.28B | $13.58B | $14.48B | $14.10B | $13.49B | $11.70B | $10.73B | $10.98B | |
| Inventory | $14.19B | $12.44B | $11.18B | $10.27B | $10.39B | $9.34B | $9.02B | $8.60B | $8.77B | $8.14B | $8.05B | $8.18B | |
| Prepaid Expense | $4.15B | $4.08B | $4.51B | $2.88B | $3.70B | $3.13B | $2.39B | $2.70B | $2.54B | $3.28B | $3.05B | $3.49B | |
| Current Assets | $55.62B | $55.89B | $53.49B | $55.29B | $60.98B | $51.24B | $45.27B | $46.03B | $43.09B | $65.03B | $60.21B | $55.74B | |
| PP&E (Net) | $23.17B | $20.52B | $19.90B | $17.98B | $18.96B | $18.77B | $17.66B | $17.04B | $17.00B | $15.91B | $15.90B | $16.13B | |
| PP&E (Gross) | $54.36B | $48.77B | $47.78B | $43.53B | $47.68B | $46.80B | $43.33B | $41.85B | $41.47B | $37.77B | $36.65B | $36.69B | |
| Accum. Depreciation | $31.20B | $28.25B | $27.88B | $25.55B | $28.72B | $28.04B | $25.67B | $24.82B | $24.46B | $21.86B | $20.74B | $20.56B | |
| Goodwill | $48.77B | $44.20B | $36.56B | $36.05B | $25.44B | $36.39B | $33.64B | $30.45B | $31.91B | $22.80B | $21.63B | $21.83B | |
| Intangibles | $50.40B | $37.62B | $34.17B | $38.49B | $46.39B | $53.40B | $47.64B | $47.61B | $53.23B | $26.88B | $25.76B | $27.22B | |
| Other Non-current Assets | $14.37B | $11.41B | $14.15B | $9.21B | $10.22B | $6.56B | $5.70B | $4.18B | $4.97B | $4.43B | $4.41B | $3.23B | |
| Total Assets | $199.21B | $180.10B | $167.56B | $187.38B | $182.02B | $174.89B | $157.73B | $152.95B | $157.30B | $141.21B | $133.41B | $130.36B | |
| Accounts Payable | $11.99B | $10.31B | $9.63B | $9.89B | $11.05B | $9.51B | $8.54B | $7.54B | $7.31B | $6.92B | $6.67B | $7.63B | |
| Accrued Liabilities | $8.59B | $8.55B | $10.21B | $10.72B | $13.61B | $13.97B | $9.71B | $7.60B | $7.30B | $5.63B | $5.41B | $6.55B | |
| Short-term Debt | $8.49B | $5.98B | $3.45B | $12.76B | $3.77B | $2.63B | $1.20B | $2.80B | $3.91B | $4.68B | $7.00B | $3.64B | |
| Current Liabilities | $54.13B | $50.32B | $46.28B | $55.80B | $45.23B | $42.49B | $35.96B | $31.23B | $30.54B | $26.29B | $27.75B | $25.03B | |
| Capital Leases | · | · | · | · | · | · | $716M | · | · | · | · | · | |
| Deferred Tax | $6.79B | $2.45B | $3.19B | $3.99B | $7.49B | $7.21B | $5.96B | $7.51B | $8.37B | $2.91B | $2.56B | $2.45B | |
| Other Non-current Liabilities | $9.87B | $17.55B | $13.40B | $10.15B | $10.69B | $11.94B | $11.73B | $8.59B | $9.02B | $9.54B | $10.24B | $8.03B | |
| Total Liabilities | $117.67B | $108.61B | $98.78B | $110.57B | $108.00B | $111.62B | $98.26B | $93.20B | $97.14B | $70.79B | $62.26B | $60.61B | |
| Long-term Debt | $41.44B | $32.40B | $27.35B | $28.44B | $32.12B | $34.43B | · | $30.28B | $32.17B | $24.14B | · | · | |
| Total Debt | $49.93B | $38.38B | $30.80B | $41.21B | $35.88B | $35.27B | $27.70B | $33.08B | $36.08B | $27.13B | $19.86B | $18.76B | |
| Common Stock | $3.12B | $3.12B | $3.12B | $3.12B | $3.12B | $3.12B | $3.12B | $3.12B | $3.12B | $3.12B | $3.12B | $3.12B | |
| Retained Earnings | $168.98B | $155.79B | $153.84B | $128.34B | $123.06B | $113.89B | $110.66B | $106.22B | $101.79B | $110.55B | $103.88B | $97.25B | |
| Treasury Stock | $75.62B | $75.68B | $75.66B | $41.69B | $39.10B | $38.49B | $38.42B | $34.36B | $31.55B | $28.35B | $22.68B | $19.89B | |
| AOCI | $-14.93B | $-11.74B | $-12.53B | $-12.97B | $-13.06B | $-15.24B | $-15.89B | $-15.22B | $-13.20B | $-14.90B | $-13.16B | $-10.72B | |
| Stockholders' Equity | $81.54B | $71.49B | $68.77B | $76.80B | $74.02B | $63.28B | $59.47B | $59.75B | $60.16B | $70.42B | $71.15B | $69.75B | |
| Liabilities + Equity | $199.21B | $180.10B | $167.56B | $187.38B | $182.02B | $174.89B | $157.73B | $152.95B | $157.30B | $141.21B | $133.41B | $130.36B |
Cash Flow 18
| Metric | Trend | 2025 | 2024 | 2023 | 2022 | 2021 | 2020 | 2019 | 2018 | 2017 | 2016 | 2015 | 2014 |
|---|---|---|---|---|---|---|---|---|---|---|---|---|---|
| D&A | $7.50B | $7.34B | $7.49B | $6.97B | $7.39B | $7.23B | $7.01B | $6.93B | $5.64B | $3.75B | $3.75B | $3.90B | |
| Stock-based Comp | $1.35B | $1.18B | $1.16B | $1.14B | $1.14B | $1.00B | $977M | $978M | $962M | $878M | $874M | $792M | |
| Deferred Tax | $1.54B | $-2.18B | $-4.19B | $-1.66B | $-2.08B | $-1.14B | $-2.48B | $-1.02B | $2.41B | $-341M | $-270M | $441M | |
| Amort. of Intangibles | $4.60B | $4.50B | $4.50B | $3.90B | $4.20B | $4.70B | $4.50B | $4.40B | $3.00B | $1.20B | $1.20B | $1.40B | |
| Restructuring | $228M | $234M | $489M | $275M | $209M | $247M | $266M | $251M | $309M | $491M | $509M | $0 | |
| Other Non-cash | $-12.67B | $3.87B | $-16.82B | $-3.19B | $-3.91B | $1.73B | $2.79B | $13M | $10.75B | $-2.06B | $-480M | $-2.98B | |
| Operating Cash Flow | $24.53B | $24.27B | $22.79B | $21.19B | $23.41B | $23.54B | $23.42B | $22.20B | $21.06B | $18.77B | $19.57B | $18.71B | |
| CapEx | $4.83B | $4.42B | $4.54B | $4.01B | $3.65B | $3.35B | $3.50B | $3.67B | $3.28B | $3.23B | $3.46B | $3.71B | |
| Investing Cash Flow | $-23.59B | $-18.60B | $878M | $-12.37B | $-8.68B | $-20.82B | $-6.19B | $-3.17B | $-14.87B | $-4.76B | $-7.74B | $-12.30B | |
| Debt Issued | $9.14B | $6.66B | $0 | $2M | $5M | $7.43B | $3M | $5M | $8.99B | $12.00B | $75M | $2.10B | |
| Net Debt Issued | $7.38B | $5.21B | $-1.55B | $-2.13B | $-1.80B | $6.37B | $-2.82B | $-1.55B | $7.21B | $9.78B | $7M | $254M | |
| Stock Repurchased | $5.95B | $2.43B | $5.05B | $6.04B | $3.46B | $3.22B | $6.75B | $5.87B | $6.36B | $8.98B | $5.29B | $7.12B | |
| Net Stock Activity | $-5.95B | $-2.43B | $-5.05B | $-6.04B | $-3.46B | $-3.22B | $-6.75B | $-5.87B | $-6.36B | $-8.98B | $-5.29B | $-7.12B | |
| Financing Cash Flow | $-5.54B | $-3.13B | $-15.82B | $-8.87B | $-14.05B | $-6.12B | $-18.02B | $-18.51B | $-7.67B | $-8.55B | $-11.14B | $-12.50B | |
| Net Change in Cash | $-4.40B | $2.25B | $7.73B | $-360M | $502M | $-3.32B | $-802M | $283M | $-1.15B | $5.24B | $-791M | $-6.40B | |
| Taxes Paid | $6.54B | $6.71B | $8.57B | · | · | · | · | · | · | · | · | · | |
| Free Cash Flow | $19.70B | $19.84B | $18.25B | $17.18B | $19.76B | $20.19B | $19.92B | $18.53B | $17.78B | $15.54B | $15.82B | $14.76B | |
| Levered FCF | · | · | $17.56B | $16.96B | $19.59B | $20.01B | $19.64B | $17.68B | $17.71B | $14.93B | $15.37B | $14.33B |
Profitability 8
| Metric | Trend | 2025 | 2024 | 2023 | 2022 | 2021 | 2020 | 2019 | 2018 | 2017 | 2016 | 2015 | 2014 |
|---|---|---|---|---|---|---|---|---|---|---|---|---|---|
| Gross Margin | 67.9% | 69.1% | 68.8% | 67.3% | 68.2% | 65.6% | 66.4% | 66.8% | 66.8% | 69.8% | 69.3% | 69.4% | |
| Operating Margin | · | · | · | · | · | · | · | · | · | · | · | 29.0% | |
| Net Margin | 28.5% | 15.8% | 41.3% | 18.9% | 22.3% | 17.8% | 18.4% | 18.8% | 1.7% | 23.0% | 22.0% | 22.0% | |
| Pretax Margin | 34.6% | 18.8% | 17.7% | 22.9% | 24.3% | 20.0% | 21.1% | 22.1% | 23.1% | 27.6% | 27.4% | 27.7% | |
| EBITDA Margin | 8.0% | 8.3% | 8.8% | 7.3% | 7.9% | 8.8% | 8.5% | 8.5% | 7.4% | 5.2% | 5.3% | 34.3% | |
| ROA | 14.1% | 8.1% | 19.8% | 9.7% | 11.7% | 8.8% | 9.7% | 9.9% | 0.87% | 12.0% | 11.7% | 12.4% | |
| ROE | 35.0% | 20.1% | 48.3% | 23.4% | 28.9% | 23.0% | 25.7% | 24.6% | 2.0% | 23.4% | 21.9% | 22.7% | |
| ROIC | · | · | · | · | · | · | · | · | · | · | · | 19.4% |
Liquidity & Solvency 5
| Metric | Trend | 2025 | 2024 | 2023 | 2022 | 2021 | 2020 | 2019 | 2018 | 2017 | 2016 | 2015 | 2014 |
|---|---|---|---|---|---|---|---|---|---|---|---|---|---|
| Current Ratio | 1.0 | 1.1 | 1.2 | 1.0 | 1.3 | 1.2 | 1.3 | 1.5 | 1.4 | 2.5 | 2.2 | 2.4 | |
| Quick Ratio | 0.7 | 0.8 | 0.8 | 0.7 | 1.0 | 0.9 | 0.9 | 1.1 | 1.0 | 2.0 | 1.8 | 1.8 | |
| Debt / Equity | 0.6 | 0.5 | 0.4 | 0.5 | 0.5 | 0.6 | 0.5 | 0.6 | 0.6 | 0.4 | 0.3 | 0.3 | |
| LT Debt / Equity | 0.5 | 0.4 | 0.4 | 0.4 | 0.4 | 0.5 | 0.4 | 0.5 | 0.5 | 0.3 | 0.2 | 0.2 | |
| Interest Coverage | · | · | · | · | · | · | · | · | · | · | · | 40.5 |
Efficiency 3
| Metric | Trend | 2025 | 2024 | 2023 | 2022 | 2021 | 2020 | 2019 | 2018 | 2017 | 2016 | 2015 | 2014 |
|---|---|---|---|---|---|---|---|---|---|---|---|---|---|
| Asset Turnover | 0.5 | 0.5 | 0.5 | 0.5 | 0.5 | 0.5 | 0.5 | 0.5 | 0.5 | 0.5 | 0.5 | 0.6 | |
| Inventory Turnover | 2.3 | 2.3 | 2.5 | 2.7 | 3.0 | 3.1 | 3.1 | 3.1 | 3.0 | 2.7 | 2.7 | 2.8 | |
| Receivables Turnover | 5.9 | 6.0 | 5.9 | 6.0 | 6.5 | 5.9 | 5.7 | 5.9 | 6.1 | 6.4 | 6.5 | 6.5 |
Growth Rates 9
| Metric | Trend | 2025 | 2024 | 2023 | 2022 | 2021 | 2020 | 2019 | 2018 | 2017 | 2016 | 2015 | 2014 |
|---|---|---|---|---|---|---|---|---|---|---|---|---|---|
| Revenue YoY | 6.0% | 4.3% | 6.5% | 1.6% | -4.7% | · | · | · | · | · | · | · | |
| Revenue CAGR 3Y | 5.6% | 4.1% | 1.0% | · | · | · | · | · | · | · | · | · | |
| Revenue CAGR 5Y | 2.7% | · | · | · | · | · | · | · | · | · | · | · | |
| EPS YoY | 90.5% | -57.8% | 103.9% | -13.8% | 41.7% | · | · | · | · | · | · | · | |
| EPS CAGR 3Y | 17.9% | -9.5% | 35.5% | · | · | · | · | · | · | · | · | · | |
| EPS CAGR 5Y | 14.9% | · | · | · | · | · | · | · | · | · | · | · | |
| Net Income YoY | 90.6% | -60.0% | 95.9% | -14.1% | 41.9% | · | · | · | · | · | · | · | |
| Net Income CAGR 3Y | 14.3% | -12.3% | 33.7% | · | · | · | · | · | · | · | · | · | |
| Net Income CAGR 5Y | 12.7% | · | · | · | · | · | · | · | · | · | · | · |
Valuation (TTM) 4
| Metric | Trend | 2025 | 2024 | 2023 | 2022 | 2021 | 2020 | 2019 | 2018 | 2017 | 2016 | 2015 | 2014 |
|---|---|---|---|---|---|---|---|---|---|---|---|---|---|
| Revenue TTM | $94.19B | $88.82B | $85.16B | $79.99B | $78.74B | $82.58B | $82.06B | $81.58B | $76.45B | $71.89B | $70.07B | $74.33B | |
| Net Income TTM | $26.80B | $14.07B | $35.15B | $17.94B | $20.88B | $14.71B | $15.12B | $15.30B | $1.30B | $16.54B | $15.41B | $16.32B | |
| P/E | 18.8 | 25.1 | 11.4 | 26.2 | 21.9 | 28.6 | 25.9 | 22.7 | 297.3 | 19.4 | 18.7 | 18.4 | |
| Earnings Yield | 5.3% | 4.0% | 8.8% | 3.8% | 4.6% | 3.5% | 3.9% | 4.4% | 0.34% | 5.1% | 5.3% | 5.4% |
Income Statement 15
| Metric | Trend | Q2 2027 | Q1 2027 | Q4 2025 | Q3 2025 | Q2 2025 | Q1 2025 | Q4 2024 | Q3 2024 | Q2 2024 | Q1 2024 | Q4 2023 | Q3 2023 | Q2 2023 | Q4 2022 |
|---|---|---|---|---|---|---|---|---|---|---|---|---|---|---|---|
| Revenue | $25.31B | $24.06B | $24.56B | $23.99B | $23.74B | $21.89B | $22.52B | $22.47B | $22.45B | $21.38B | $19.32B | $21.52B | $20.89B | $10.22B | |
| Cost of Revenue | $8.05B | $8.11B | $7.97B | $7.30B | $7.63B | $7.36B | $7.13B | $6.96B | $6.87B | $6.51B | $5.81B | $6.46B | $6.69B | $2.02B | |
| Gross Profit | $17.26B | $15.96B | $16.60B | $16.69B | $16.11B | $14.54B | $15.39B | $15.51B | $15.58B | $14.87B | $13.51B | $15.06B | $14.21B | $8.21B | |
| SG&A Expense | $6.43B | $6.03B | $6.75B | $5.92B | $5.89B | $5.11B | $6.45B | $5.48B | $5.68B | $5.26B | $5.27B | $5.40B | $4.91B | $2.65B | |
| Interest Expense | · | · | · | · | · | · | · | · | · | $155M | · | $346M | $212M | · | |
| Interest Income | $219M | $229M | $237M | $227M | $260M | $332M | $281M | $292M | $395M | $364M | $715M | $326M | $198M | $389M | |
| Other Non-op | $-331M | $-294M | $-483M | $478M | $-107M | $7.32B | $161M | $-1.80B | $-653M | $-2.40B | $-180M | $384M | $-6.94B | $-1.52B | |
| Pretax Income | $6.75B | $5.99B | $4.97B | $7.49B | $6.49B | $13.63B | $3.89B | $3.34B | $5.75B | $3.71B | $4.18B | $6.31B | $-1.29B | $228M | |
| Income Tax | $1.21B | $755M | $-150M | $2.34B | $954M | $2.63B | $456M | $644M | $1.06B | $459M | $889M | $930M | $-796M | $18M | |
| Net Income | $5.53B | $5.24B | $5.12B | $5.15B | $5.54B | $11.00B | $3.43B | $2.69B | $4.69B | $3.25B | $24.93B | $5.14B | $-68M | $1.78B | |
| EPS (Basic) | $2.30 | $2.17 | $2.12 | $2.14 | $2.30 | $4.57 | $1.42 | $1.12 | $1.95 | $1.35 | $9.97 | $1.98 | $-0.03 | $0.69 | |
| EPS (Diluted) | $2.27 | $2.14 | $2.08 | $2.12 | $2.29 | $4.54 | $1.41 | $1.11 | $1.93 | $1.34 | $9.86 | $1.96 | $-0.03 | $0.68 | |
| Shares (Basic) | 2,407,400,000 | 2,408,700,000 | -4,814,400,000 | 2,408,300,000 | 2,406,300,000 | 2,407,200,000 | -4,814,900,000 | 2,407,200,000 | 2,406,800,000 | 2,408,200,000 | -5,299,600,000 | 2,598,400,000 | 2,605,500,000 | -5,265,200,000 | |
| Shares (Diluted) | 2,440,100,000 | 2,445,200,000 | -4,842,100,000 | 2,428,600,000 | 2,419,100,000 | 2,423,800,000 | -4,850,600,000 | 2,427,900,000 | 2,422,000,000 | 2,430,100,000 | -5,337,300,000 | 2,625,700,000 | 2,605,500,000 | -5,343,200,000 | |
| EBITDA | · | $2.00B | · | · | · | $1.77B | · | · | · | $1.81B | · | · | $1.88B | · |
Balance Sheet 28
| Metric | Trend | Q2 2027 | Q1 2027 | Q4 2025 | Q3 2025 | Q2 2025 | Q1 2025 | Q4 2024 | Q3 2024 | Q2 2024 | Q1 2024 | Q4 2023 | Q3 2023 | Q2 2023 | Q4 2022 |
|---|---|---|---|---|---|---|---|---|---|---|---|---|---|---|---|
| Cash & Equivalents | $20.42B | $21.69B | $19.71B | $18.23B | $18.58B | $38.47B | $24.11B | $19.98B | $24.88B | $25.47B | · | $21.18B | $19.17B | · | |
| Short-term Investments | $336M | $363M | $393M | $331M | $303M | $307M | $417M | $317M | $597M | $745M | · | $7.32B | $5.44B | · | |
| Receivables | $19.05B | $17.72B | $17.18B | $17.61B | $17.85B | $16.02B | $14.84B | $16.17B | $15.79B | $14.95B | · | $16.78B | $16.35B | · | |
| Inventory | $15.14B | $14.58B | $14.19B | $14.15B | $13.41B | $12.66B | $12.44B | $12.60B | $12.17B | $11.38B | · | $12.89B | $12.81B | · | |
| Prepaid Expense | $4.83B | $4.82B | $4.15B | $4.29B | $4.36B | $4.09B | $4.08B | $4.17B | $4.38B | $4.46B | · | $2.40B | $2.92B | · | |
| Current Assets | $59.77B | $59.17B | $55.62B | $54.61B | $54.50B | $71.55B | $55.89B | $53.25B | $57.82B | $57.00B | · | $60.57B | $64.39B | · | |
| PP&E (Net) | $23.58B | $23.27B | $23.17B | $22.34B | $21.95B | $20.87B | $20.52B | $20.48B | $19.75B | $19.63B | · | $20.58B | $20.17B | · | |
| PP&E (Gross) | $55.52B | $54.70B | $54.36B | $53.38B | $52.47B | $49.88B | $48.77B | $49.27B | $48.03B | $47.59B | · | $51.22B | $50.37B | · | |
| Accum. Depreciation | $31.94B | $31.43B | $31.20B | $31.04B | $30.52B | $29.01B | $28.25B | $28.80B | $28.29B | $27.95B | · | $30.64B | $30.19B | · | |
| Goodwill | $48.48B | $48.56B | $48.77B | $48.05B | $48.12B | $44.47B | $44.20B | $44.80B | $44.25B | $36.62B | $36.56B | $45.44B | $45.58B | $36.05B | |
| Intangibles | $48.23B | $49.06B | $50.40B | $48.74B | $49.84B | $36.76B | $37.62B | $39.49B | $39.73B | $34.29B | · | $46.25B | $47.45B | · | |
| Other Non-current Assets | $14.27B | $14.11B | $14.37B | $12.42B | $12.19B | $11.53B | $11.41B | $10.92B | $10.54B | $14.12B | · | $10.08B | $9.57B | · | |
| Total Assets | $201.06B | $200.89B | $199.21B | $192.82B | $193.39B | $193.67B | $180.10B | $178.29B | $181.09B | $171.97B | · | $191.69B | $195.97B | · | |
| Accounts Payable | $9.22B | $10.46B | $11.99B | $9.62B | $9.46B | $9.54B | $10.31B | $8.95B | $8.85B | $8.17B | · | $10.44B | $9.91B | · | |
| Accrued Liabilities | $9.46B | $7.40B | $8.59B | $7.60B | $7.40B | $7.91B | $8.55B | $11.45B | $10.54B | $10.32B | · | $10.61B | $11.20B | · | |
| Short-term Debt | $11.69B | $17.46B | $8.49B | $6.39B | $11.53B | $13.90B | $5.98B | $4.46B | $9.86B | $8.55B | · | $11.70B | $17.98B | · | |
| Current Liabilities | $54.90B | $57.72B | $54.13B | $50.87B | $54.18B | $56.90B | $50.32B | $51.76B | $53.93B | $48.73B | · | $54.17B | $60.37B | · | |
| Deferred Tax | $6.61B | $7.01B | $6.79B | $5.99B | $3.80B | $2.43B | $2.45B | $2.95B | $2.63B | $3.17B | · | $3.63B | $4.42B | · | |
| Other Non-current Liabilities | $10.10B | $10.21B | $9.87B | $9.93B | $10.26B | $10.44B | $17.55B | $14.92B | $14.09B | $15.07B | · | $14.58B | $14.42B | · | |
| Total Liabilities | $116.09B | $119.71B | $117.67B | $113.54B | $114.92B | $115.56B | $108.61B | $108.13B | $109.55B | $101.95B | · | $115.28B | $125.10B | · | |
| Long-term Debt | · | · | $41.44B | · | · | · | $32.40B | · | · | · | · | · | · | · | |
| Total Debt | $49.04B | $54.99B | · | $45.80B | $50.76B | $52.25B | · | $35.75B | $41.49B | $33.63B | · | · | · | · | |
| Common Stock | $3.12B | $3.12B | $3.12B | $3.12B | $3.12B | $3.12B | $3.12B | $3.12B | $3.12B | $3.12B | · | $3.12B | $3.12B | · | |
| Retained Earnings | $171.66B | $169.16B | $168.98B | $167.28B | $165.37B | $162.63B | $155.79B | $155.18B | $155.36B | $153.38B | · | $129.38B | $124.56B | · | |
| Treasury Stock | $75.86B | $76.26B | $75.62B | $75.89B | $75.71B | $75.91B | $75.68B | $75.62B | $75.69B | $75.71B | $75.66B | $44.22B | $44.18B | $41.69B | |
| AOCI | $-13.95B | $-14.83B | $-14.93B | $-15.24B | $-14.30B | $-11.74B | $-11.74B | $-12.52B | $-11.25B | $-10.77B | · | $-13.13B | $-12.63B | · | |
| Stockholders' Equity | $84.97B | $81.19B | $81.54B | $79.28B | $78.47B | $78.11B | $71.49B | $70.16B | $71.54B | $70.02B | $68.77B | $75.15B | $70.87B | $76.80B | |
| Liabilities + Equity | $201.06B | $200.89B | $199.21B | $192.82B | $193.39B | $193.67B | $180.10B | $178.29B | $181.09B | $171.97B | · | $191.69B | $195.97B | · |
Cash Flow 17
| Metric | Trend | Q2 2027 | Q1 2027 | Q4 2025 | Q3 2025 | Q2 2025 | Q1 2025 | Q4 2024 | Q3 2024 | Q2 2024 | Q1 2024 | Q4 2023 | Q3 2023 | Q2 2023 | Q4 2022 |
|---|---|---|---|---|---|---|---|---|---|---|---|---|---|---|---|
| D&A | $1.96B | $2.00B | $2.01B | $1.78B | $1.94B | $1.77B | $1.90B | $1.85B | $1.78B | $1.81B | $1.84B | · | $1.88B | $1.77B | |
| Stock-based Comp | $458M | $300M | $309M | $347M | $410M | $288M | $238M | $295M | $341M | $302M | $178M | · | $306M | $213M | |
| Deferred Tax | $-479M | $159M | $-3.68B | $2.22B | $825M | $2.17B | $-16M | $90M | $-695M | $-1.56B | $-2.41B | · | $-1.54B | $825M | |
| Amort. of Intangibles | $1.20B | $1.20B | $1.20B | $1.00B | $1.30B | $1.10B | $1.10B | $1.20B | $1.10B | $1.10B | $1.20B | $1.10B | $1.10B | $500M | |
| Restructuring | $34M | $32M | $84M | $63M | $64M | $17M | $42M | $41M | $-13M | $164M | $144M | $145M | $130M | $67M | |
| Other Non-cash | · | $-5.18B | · | · | · | $-11.06B | · | · | · | $-153M | · | · | $2.68B | · | |
| Operating Cash Flow | $8.62B | $2.51B | $7.31B | $9.17B | $3.88B | $4.17B | $6.98B | $7.99B | $5.63B | $3.66B | $7.86B | · | $3.26B | $5.35B | |
| CapEx | $1.32B | $1.05B | $1.84B | $1.16B | $1.04B | $795M | $1.61B | $1.03B | $976M | $807M | $1.59B | · | $863M | $1.59B | |
| Investing Cash Flow | $-1.11B | $-1.04B | $-4.49B | $-542M | $-18.26B | $-297M | $-1.32B | $-3.13B | $-13.69B | $-464M | $-1.20B | · | $3.31B | $-4.40B | |
| Debt Issued | $0 | $0 | $0 | $0 | $0 | $9.14B | $0 | $1M | $6.66B | $2M | $0 | · | $7.67B | $1M | |
| Net Debt Issued | · | $0 | · | · | · | $9.14B | · | · | · | $1M | · | · | $7.17B | · | |
| Stock Repurchased | $221M | $4.03B | $1.92B | $1.90B | $0 | $2.13B | $282M | $539M | $136M | $1.48B | $216M | · | $3.54B | $1.32B | |
| Net Stock Activity | · | $-4.03B | · | · | · | $-2.13B | · | · | · | $-1.48B | · | · | $-3.54B | · | |
| Financing Cash Flow | $-8.78B | $530M | $-1.37B | $-8.93B | $-5.67B | $10.42B | $-1.34B | $-9.88B | $7.54B | $546M | $-4.66B | · | $6.14B | $1.70B | |
| Net Change in Cash | $-1.27B | $1.98B | $1.48B | $-346M | $-19.90B | $14.37B | $4.12B | $-4.90B | $-595M | $3.61B | $2.13B | · | $12.74B | $2.77B | |
| Free Cash Flow | · | $1.47B | · | · | · | $3.38B | · | · | · | $2.85B | · | · | $2.39B | · | |
| Levered FCF | · | · | · | · | · | · | · | · | · | $2.71B | · | · | $2.37B | · |
Profitability 6
| Metric | Trend | Q2 2027 | Q1 2027 | Q4 2025 | Q3 2025 | Q2 2025 | Q1 2025 | Q4 2024 | Q3 2024 | Q2 2024 | Q1 2024 | Q4 2023 | Q3 2023 | Q2 2023 | Q4 2022 |
|---|---|---|---|---|---|---|---|---|---|---|---|---|---|---|---|
| Gross Margin | 68.2% | 66.3% | · | 69.6% | 67.9% | 66.4% | · | 69.0% | 69.4% | 69.5% | · | 67.8% | 66.1% | · | |
| Net Margin | 21.9% | 21.8% | · | 21.5% | 23.3% | 50.2% | · | 12.0% | 20.9% | 15.2% | · | 20.2% | -0.27% | · | |
| Pretax Margin | 26.7% | 24.9% | · | 31.2% | 27.3% | 62.3% | · | 14.8% | 25.6% | 17.4% | · | 26.5% | -3.0% | · | |
| EBITDA Margin | · | 8.3% | · | · | · | 8.1% | · | · | · | 8.5% | · | · | 7.6% | · | |
| ROA | 2.8% | 2.6% | · | 2.8% | 3.0% | 6.0% | · | 1.6% | 2.5% | 1.8% | · | · | · | · | |
| ROE | 6.8% | 6.6% | · | 6.9% | 7.4% | 14.8% | · | 3.8% | 6.4% | 4.6% | · | · | · | · |
Liquidity & Solvency 4
| Metric | Trend | Q2 2027 | Q1 2027 | Q4 2025 | Q3 2025 | Q2 2025 | Q1 2025 | Q4 2024 | Q3 2024 | Q2 2024 | Q1 2024 | Q4 2023 | Q3 2023 | Q2 2023 | Q4 2022 |
|---|---|---|---|---|---|---|---|---|---|---|---|---|---|---|---|
| Current Ratio | 1.1 | 1.0 | · | 1.1 | 1.0 | 1.3 | · | 1.0 | 1.1 | 1.2 | · | · | · | · | |
| Quick Ratio | 0.7 | 0.7 | · | 0.7 | 0.7 | 1.0 | · | 0.7 | 0.8 | 0.8 | · | · | · | · | |
| Debt / Equity | 0.6 | 0.7 | · | 0.6 | 0.6 | 0.7 | · | 0.5 | 0.6 | 0.5 | · | · | · | · | |
| LT Debt / Equity | 0.4 | 0.5 | · | 0.5 | 0.5 | 0.5 | · | 0.4 | 0.4 | 0.4 | · | · | · | · |
Efficiency 3
| Metric | Trend | Q2 2027 | Q1 2027 | Q4 2025 | Q3 2025 | Q2 2025 | Q1 2025 | Q4 2024 | Q3 2024 | Q2 2024 | Q1 2024 | Q4 2023 | Q3 2023 | Q2 2023 | Q4 2022 |
|---|---|---|---|---|---|---|---|---|---|---|---|---|---|---|---|
| Asset Turnover | 0.1 | 0.1 | · | 0.1 | 0.1 | 0.1 | · | 0.1 | 0.1 | 0.1 | · | · | · | · | |
| Inventory Turnover | 0.6 | 0.6 | · | 0.5 | 0.6 | 0.6 | · | 0.6 | 0.5 | 0.5 | · | · | · | · | |
| Receivables Turnover | 1.4 | 1.4 | · | 1.4 | 1.4 | 1.4 | · | 1.5 | 1.4 | 1.4 | · | · | · | · |
Valuation (TTM) 4
| Metric | Trend | Q2 2027 | Q1 2027 | Q4 2025 | Q3 2025 | Q2 2025 | Q1 2025 | Q4 2024 | Q3 2024 | Q2 2024 | Q1 2024 | Q4 2023 | Q3 2023 | Q2 2023 | Q4 2022 |
|---|---|---|---|---|---|---|---|---|---|---|---|---|---|---|---|
| Revenue TTM | $97.11B | $93.69B | · | $92.10B | $90.55B | $88.19B | · | $87.70B | $86.58B | $85.65B | · | $86.14B | · | · | |
| Net Income TTM | $21.46B | $26.92B | · | $24.38B | $23.92B | $21.63B | · | $14.68B | $38.02B | $38.48B | · | $13.05B | · | · | |
| P/E | 28.9 | 21.7 | · | 17.9 | 15.4 | 18.4 | · | 26.7 | 9.6 | 10.4 | · | 33.5 | · | · | |
| Earnings Yield | 3.5% | 4.6% | · | 5.6% | 6.5% | 5.5% | · | 3.8% | 10.4% | 9.6% | · | 3.0% | · | · |
Financial Statements Income statement, balance sheet, cash flow — annual, last 5 years
Income Statement
| 2025-12-28 | 2024-12-29 | 2023-12-31 | 2023-01-01 | 2022-01-02 | |
|---|---|---|---|---|---|
| Revenue | $94.19B | $88.82B | $85.16B | $79.99B | $78.74B |
| Gross Margin % | 67.9% | 69.1% | 68.8% | 67.3% | 68.2% |
| Net Income | $26.80B | $14.07B | $35.15B | $17.94B | $20.88B |
| Diluted EPS | $11.03 | $5.79 | $13.72 | $6.73 | $7.81 |
Balance Sheet
| 2025-12-28 | 2024-12-29 | 2023-12-31 | 2023-01-01 | 2022-01-02 | |
|---|---|---|---|---|---|
| Debt / Equity | 0.6 | 0.5 | 0.4 | 0.5 | 0.5 |
| Current Ratio | 1.0 | 1.1 | 1.2 | 1.0 | 1.3 |
| Quick Ratio | 0.7 | 0.8 | 0.8 | 0.7 | 1.0 |
Cash Flow
| 2025-12-28 | 2024-12-29 | 2023-12-31 | 2023-01-01 | 2022-01-02 | |
|---|---|---|---|---|---|
| Free Cash Flow | $19.70B | $19.84B | $18.25B | $17.18B | $19.76B |
Latest News Recent headlines mentioning this company
- J&J's Proposed $5.5 Billion Talc Settlement May "Lift Remaining Overhang" On Shares, Says Guggenheim
- Jim Cramer Said To Buy Johnson & Johnson (NYSE:JNJ)’s Shares – Here’s What Happened Next
- Better Dividend King to Buy Right Now: AbbVie or Johnson & Johnson?
- J&J Finally Has a Rival to da Vinci. 1 Number in Intuitive Surgical’s Last Quarter Says It Won’t Be Enough to Move the Needle for JNJ Stock.
- This Dividend King Has Raised Its Payout for More Than 60 Straight Years. But Is the Stock Still a Buy?
- 64 With $1.1 Million in a Traditional IRA. Yield Volatility Is Back. Here’s Where I’m Allocating Capital
- Why a Dividend Portfolio That Pays Your Rent May Beat Homeownership by $500,000 Over 20 Years
- Johnson & Johnson Just Paid $1 Billion for a Technology That Could Crack One of Cancer's Most "Undruggable" Targets. Why That's Very Good News for Investors.
- AbbVie Reports Promising New Clinical Updates. Here's What It Means for the Company's Dividend.
- Why Johnson & Johnson May Be the Closest Thing Investors Can Find to a Bulletproof Dividend Stock
My Metrics Your personal watchlist — selected rows from Full Fundamentals
Pick the metrics that matter to you — click the ➕ next to any row in Full Fundamentals above.
Your selection is saved and follows you across all tickers.
Institutional owners (13F) 5,077 filers · $274.8B total · As of June 30, 2026
Institutions that report holding this stock in their quarterly SEC Form 13F. Long positions only; a single filer may appear twice for separate option legs. Large offsetting put/call legs typically reflect market-making or hedged inventory, not directional conviction.
| New positions | Exited positions | Increased | Decreased | Net shares change |
|---|---|---|---|---|
| 167 (-178 vs prior Q) | 107 (-8 vs prior Q) | 2,028 (+340 vs prior Q) | 1,873 (-286 vs prior Q) | +46.7M |
Compared to Q1 2026. SEC Form 13F filings are due within 45 days of quarter-end plus a short buffer for late filers — quarters still inside that window are skipped in favor of the most recent fully-reported pair.
| Institution | Value | Shares | % of tracked 13F | Type |
|---|---|---|---|---|
| VANGUARD CAPITAL MANAGEMENT LLC | $39,930,782,204 | 157,226,374 | 14.53% | Shares |
| STATE STREET CORP | $33,975,097,069 | 133,776,025 | 12.36% | Shares |
| VANGUARD PORTFOLIO MANAGEMENT LLC | $16,348,256,139 | 64,370,816 | 5.95% | Shares |
| GEODE CAPITAL MANAGEMENT, LLC | $12,958,440,117 | 51,166,740 | 4.71% | Shares |
| NORGES BANK | $8,082,616,583 | 31,825,084 | 2.94% | Shares |
| WELLINGTON MANAGEMENT GROUP LLP | $5,549,231,802 | 21,849,950 | 2.02% | Shares |
| STATE FARM MUTUAL AUTOMOBILE INSURANCE CO | $5,544,876,216 | 21,832,800 | 2.02% | Shares |
| Capital World Investors | $3,864,157,554 | 15,215,015 | 1.41% | Shares |
| DIMENSIONAL FUND ADVISORS LP | $3,484,562,326 | 13,720,369 | 1.27% | Shares |
| VANGUARD FIDUCIARY TRUST CO | $3,432,930,268 | 13,517,070 | 1.25% | Shares |
| Fisher Asset Management, LLC | $3,379,593,434 | 13,307,056 | 1.23% | Shares |
| FMR LLC | $3,354,629,851 | 13,208,764 | 1.22% | Shares |
| AMERIPRISE FINANCIAL INC | $2,752,349,971 | 10,837,150 | 1.00% | Shares |
| HighTower Advisors, LLC | $2,512,466,026 | 9,892,767 | 0.91% | Shares |
| Capital Research Global Investors | $2,073,562,156 | 8,164,545 | 0.75% | Shares |
| UBS Group AG | $1,983,817,321 | 7,811,227 | 0.72% | Shares |
| Grantham, Mayo, Van Otterloo & Co. LLC | $1,805,761,048 | 7,110,133 | 0.66% | Shares |
| BANK OF AMERICA CORP /DE/ | $1,782,933,090 | 7,020,251 | 0.65% | Shares |
| BlackRock, Inc. | $1,750,119,461 | 6,891,048 | 0.64% | Shares |
| Swiss National Bank | $1,725,321,576 | 6,793,407 | 0.63% | Shares |
| Ninety One UK Ltd | $1,721,057,957 | 6,776,620 | 0.63% | Shares |
| JOURNEY STRATEGIC WEALTH LLC | $1,705,878,125 | 6,978,719 | 0.62% | Shares |
| ALLIANCEBERNSTEIN L.P. | $1,678,634,257 | 6,867,265 | 0.61% | Shares |
| RAYMOND JAMES FINANCIAL INC | $1,671,784,874 | 6,582,608 | 0.61% | Shares |
| Legal & General Group Plc | $1,647,461,740 | 6,486,836 | 0.60% | Shares |
| Mitsubishi UFJ Asset Management Co., Ltd. | $1,542,961,890 | 6,075,370 | 0.56% | Shares |
| Sumitomo Mitsui Trust Group, Inc. | $1,437,687,090 | 5,660,854 | 0.52% | Shares |
| Clearbridge Investments, LLC | $1,352,022,842 | 5,323,554 | 0.49% | Shares |
| CANADA PENSION PLAN INVESTMENT BOARD | $1,342,031,830 | 5,284,214 | 0.49% | Shares |
| Vanguard Global Advisers, LLC | $1,331,855,506 | 5,244,145 | 0.48% | Shares |
| National Pension Service | $1,327,493,063 | 5,226,968 | 0.48% | Shares |
| LPL Financial LLC | $1,283,854,730 | 5,055,143 | 0.47% | Shares |
| California Public Employees Retirement System | $1,262,226,329 | 4,969,982 | 0.46% | Shares |
| VANGUARD ASSET MANAGEMENT, Ltd | $1,259,708,724 | 4,960,069 | 0.46% | Shares |
| PeakShares LLC | $1,248,770,000 | 4,917 | 0.45% | Shares |
| ENVESTNET ASSET MANAGEMENT INC | $1,247,239,584 | 4,910,996 | 0.45% | Shares |
| TD Asset Management Inc | $1,242,199,016 | 4,891,125 | 0.45% | Shares |
| WELLS FARGO & COMPANY/MN | $1,148,432,649 | 4,521,923 | 0.42% | Shares |
| VANGUARD GROUP INC | $1,093,795,525 | 5,285,313 | 0.40% | Shares |
| GOLDMAN SACHS GROUP INC | $1,077,672,069 | 4,243,305 | 0.39% | Shares |
| MACKENZIE FINANCIAL CORP | $1,033,234,532 | 4,068,333 | 0.38% | Shares |
| NEUBERGER BERMAN GROUP LLC | $1,018,530,514 | 4,007,808 | 0.37% | Shares |
| JANE STREET GROUP, LLC | $974,914,639 | 3,838,700 | 0.35% | Put option |
| RHUMBLINE ADVISERS | $960,197,598 | 3,780,752 | 0.35% | Shares |
| MANUFACTURERS LIFE INSURANCE COMPANY, THE | $951,486,414 | 3,746,452 | 0.35% | Shares |
| CALIFORNIA STATE TEACHERS RETIREMENT SYSTEM | $915,044,518 | 3,743,432 | 0.33% | Shares |
| NORDEA INVESTMENT MANAGEMENT AB | $827,927,813 | 3,251,749 | 0.30% | Shares |
| UBS AM, a distinct business unit of UBS ASSET MANAGEMENT AMERICAS LLC | $781,557,545 | 3,197,339 | 0.28% | Shares |
| Independent Franchise Partners LLP | $772,877,948 | 3,043,186 | 0.28% | Shares |
| PNC Financial Services Group, Inc. | $772,728,106 | 3,042,596 | 0.28% | Shares |
| BARCLAYS PLC | $752,517,682 | 2,963,018 | 0.27% | Shares |
| AMERICAN CENTURY COMPANIES INC | $748,128,061 | 2,945,732 | 0.27% | Shares |
| MORGAN STANLEY | $729,254,283 | 2,871,419 | 0.27% | Shares |
| NEW YORK STATE COMMON RETIREMENT FUND | $722,251,569 | 2,843,846 | 0.26% | Shares |
| BNP PARIBAS FINANCIAL MARKETS | $710,953,967 | 2,799,362 | 0.26% | Shares |
| JANE STREET GROUP, LLC | $702,963,563 | 2,767,900 | 0.26% | Call option |
| Bank Julius Baer & Co. Ltd, Zurich | $694,518,672 | 2,722,956 | 0.25% | Shares |
| VICTORY CAPITAL MANAGEMENT INC | $665,637,275 | 2,620,929 | 0.24% | Shares |
| ADAGE CAPITAL PARTNERS GP, L.L.C. | $651,838,132 | 2,566,595 | 0.24% | Shares |
| Caisse de depot et placement du Quebec | $573,768,008 | 2,259,196 | 0.21% | Shares |
| PRUDENTIAL FINANCIAL INC | $559,140,352 | 2,201,600 | 0.20% | Shares |
| Universal- Beteiligungs- und Servicegesellschaft mbH | $551,532,313 | 2,206,076 | 0.20% | Shares |
| AVIVA PLC | $549,263,205 | 2,162,709 | 0.20% | Shares |
| 1832 Asset Management L.P. | $549,091,775 | 2,162,034 | 0.20% | Shares |
| Ensign Peak Advisors, Inc | $524,358,145 | 2,064,646 | 0.19% | Shares |
| STATE BOARD OF ADMINISTRATION OF FLORIDA RETIREMENT SYSTEM | $519,978,432 | 2,047,401 | 0.19% | Shares |
| Capital International Investors | $518,230,847 | 2,040,519 | 0.19% | Shares |
| Bahl & Gaynor LLC | $500,543,363 | 1,970,876 | 0.18% | Shares |
| Robeco Institutional Asset Management B.V. | $499,332,703 | 1,966,109 | 0.18% | Shares |
| FIFTH THIRD BANCORP | $493,708,019 | 1,943,962 | 0.18% | Shares |
| Assenagon Asset Management S.A. | $492,540,275 | 1,939,364 | 0.18% | Shares |
| Point72 Asset Management, L.P. | $483,838,247 | 1,905,100 | 0.18% | Put option |
| ACR Alpine Capital Research, LLC | $476,346,389 | 1,875,601 | 0.17% | Shares |
| Eurizon Capital SGR S.p.A. | $474,571,274 | 1,860,763 | 0.17% | Shares |
| Pictet Asset Management Holding SA | $470,681,350 | 1,853,258 | 0.17% | Shares |
| Korea Investment CORP | $469,771,865 | 1,849,714 | 0.17% | Shares |
| US BANCORP \DE\ | $457,121,111 | 1,799,902 | 0.17% | Shares |
| CITIGROUP INC | $451,787,233 | 1,778,900 | 0.16% | Put option |
| Quantinno Capital Management LP | $446,029,503 | 1,756,229 | 0.16% | Shares |
| PineStone Asset Management Inc. | $440,344,361 | 1,733,844 | 0.16% | Shares |
| JONES FINANCIAL COMPANIES LLLP | $431,938,990 | 1,696,140 | 0.16% | Shares |
| WEALTH ENHANCEMENT ADVISORY SERVICES, LLC | $429,122,801 | 1,833,813 | 0.16% | Shares |
| PINNACLE ASSOCIATES LTD | $420,805,981 | 1,656,912 | 0.15% | Shares |
| WELLCOME TRUST LTD (THE) as trustee of the WELLCOME TRUST | $406,352,000 | 1,600,000 | 0.15% | Shares |
| Brandywine Global Investment Management, LLC | $403,777,662 | 1,951,088 | 0.15% | Shares |
| PFA Pension, Forsikringsaktieselskab | $403,665,514 | 1,589,422 | 0.15% | Shares |
| LONDON CO OF VIRGINIA | $393,611,148 | 1,549,812 | 0.14% | Shares |
| Focus Partners Wealth | $377,984,622 | 1,488,289 | 0.14% | Shares |
| CITADEL ADVISORS LLC | $374,150,636 | 1,473,208 | 0.14% | Shares |
| Baird Financial Group, Inc. | $370,780,061 | 1,459,936 | 0.13% | Shares |
| Zurcher Kantonalbank (Zurich Cantonalbank) | $359,417,836 | 1,415,198 | 0.13% | Shares |
| LAZARD ASSET MANAGEMENT LLC | $345,296,169 | 1,359,594 | 0.13% | Shares |
| KEYBANK NATIONAL ASSOCIATION/OH | $343,492,962 | 1,352,494 | 0.12% | Shares |
| BANK OF MONTREAL /CAN/ | $337,932,736 | 1,330,601 | 0.12% | Shares |
| Mitsubishi UFJ Trust & Banking Corp | $337,446,383 | 1,328,686 | 0.12% | Shares |
| SEB Asset Management AB | $331,038,376 | 1,303,456 | 0.12% | Shares |
| COMGEST GLOBAL INVESTORS S.A.S. | $327,501,426 | 1,289,528 | 0.12% | Shares |
| STATE OF WISCONSIN INVESTMENT BOARD | $326,163,258 | 1,284,259 | 0.12% | Shares |
| ROYAL BANK OF CANADA | $324,447,000 | 1,277,500 | 0.12% | Call option |
| YACKTMAN ASSET MANAGEMENT LP | $319,996,359 | 1,259,977 | 0.12% | Shares |
Company insiders 75 insiders · 20 officers · 22 directors
| Insider | Role | Last activity | Shares owned | Buys 12m | Sells 12m | Net 12m |
|---|---|---|---|---|---|---|
| Joseph J Wolk | Exec VP, CFO | Feb. 17, 2026 M | 14,000 | 0 | 4 | $-21,767,827 |
| Jennifer L Taubert | EVP, WWC. Innovative Medicine | Aug. 17, 2026 M | 194,451 | 0 | 2 | $-13,991,509 |
| Vanessa Broadhurst | EVP, Global Corp Affairs | July 20, 2026 M | 23,003 | 0 | 2 | $-7,301,067 |
| Kathryn E Wengel | EVP, Chief TO and Risk Officer | June 11, 2026 M | 114,288 | 0 | 1 | $-2,411,500 |
| REED JOHN C | EVP, Innovative Medicine, R&D | May 1, 2026 M | 24,911 | 0 | 4 | $-17,291,087 |
| Robert J Decker | VP Corporate Controller | Feb. 27, 2026 M | 23,682 | 0 | 1 | $-1,010,070 |
| Timothy Schmid | EVP, WW Chair, MedTech | Feb. 20, 2026 S | 25,447 | 0 | 3 | $-5,852,269 |
| James D. Swanson | EVP, CIO | Feb. 17, 2026 M | 25,698 | 0 | 3 | $-15,109,760 |
| Kristen Mulholland | EVP, Chief HR Officer | Feb. 15, 2026 A | 19,830 | 0 | 0 | $0 |
| Stephen J Cosgrove | Corporate Controller | Feb. 9, 2015 A | 97,011 | 0 | 0 | $0 |
| Russell C Deyo | VP, General Counsel | Feb. 22, 2012 S | 2,478 | 0 | 0 | $0 |
| Sherilyn S Mccoy | Member, Executive Committee | Jan. 31, 2012 J | 6,455 | 0 | 0 | $0 |
| Colleen A Goggins | Member, Executive Committee | Jan. 10, 2011 A | 107,832 | 0 | 0 | $0 |
| Kaye I Foster-Cheek | VP, Human Resources | Dec. 31, 2009 A | 1,181 | 0 | 0 | $0 |
| Christine A Poon | Vice Chairman | Feb. 13, 2009 M | 55,711 | 0 | 0 | $0 |
| Donald M Casey Jr. | Member, Executive Committee | Feb. 11, 2009 M | 26,095 | 0 | 0 | $0 |
| Robert J Darretta | Vice Chairman | Feb. 16, 2007 A | 1,938 | 0 | 0 | $0 |
| Per A Peterson | Executive Committee Member | Jan. 31, 2007 J | 790 | 0 | 0 | $0 |
| Michael J Dormer | Member, Executive Committee | Oct. 24, 2006 M | 878 | 0 | 0 | $0 |
| Joann Heffernan Heisen | VP, Chief Information Officer | Dec. 30, 2005 J | 4,996 | 0 | 0 | $0 |
| Eugene A. Woods | Director | June 9, 2026 A | — | 0 | 0 | $0 |
| Daniel E Pinto | Director | June 9, 2026 A | — | 0 | 0 | $0 |
| Marillyn A Hewson | Director | June 9, 2026 A | 3,000 | 0 | 0 | $0 |
| Nadja West | Director | April 23, 2026 A | — | 0 | 0 | $0 |
| Mark A Weinberger | Director | April 23, 2026 A | 1,000 | 0 | 0 | $0 |
| Jennifer A Doudna | Director | April 23, 2026 A | — | 0 | 0 | $0 |
| Mark B. Mcclellan | Director | April 23, 2026 A | — | 0 | 0 | $0 |
| Mary C Beckerle | Director | April 23, 2026 A | — | 0 | 0 | $0 |
| Hubert Joly | Director | April 23, 2026 A | 5,000 | 0 | 0 | $0 |
| Paula A Johnson | Director | April 23, 2026 A | — | 0 | 0 | $0 |
| John G Morikis | Director | April 23, 2026 A | 1,849 | 1 | 0 | $257,688 |
| Susan L Lindquist | Director | Sept. 6, 2016 A | 14,605 | 0 | 0 | $0 |
| Mary Sue Coleman | Director | Feb. 8, 2016 A | 11,952 | 0 | 0 | $0 |
| Leo F Mullin | Director | Feb. 9, 2015 A | 26,195 | 0 | 0 | $0 |
| James Cullen | Director | Feb. 9, 2015 A | 1,489 | 0 | 0 | $0 |
| Michael M E Johns | Director | Feb. 10, 2014 A | 14,356 | 0 | 0 | $0 |
| David Satcher | Director | Feb. 11, 2013 A | 15,393 | 0 | 0 | $0 |
| Arnold G Langbo | Director | March 9, 2010 J | 424 | 0 | 0 | $0 |
| Steven Reinemund | Director | March 11, 2008 J | 7,567 | 0 | 0 | $0 |
| Ann Dibble Jordan | Director | March 13, 2007 J | 13,290 | 0 | 0 | $0 |
| JOHNSON & JOHNSON | 10% owner | April 28, 2004 C | 4,448,076 | 0 | 0 | $0 |
| Joaquin Duato | — | Aug. 13, 2026 M | 275,967 | 0 | 7 | $-89,386,933 |
| Elizabeth Forminard | — | Aug. 6, 2026 M | 16,994 | 0 | 2 | $-4,090,993 |
| Darius Adamczyk | — | April 25, 2024 A | — | 0 | 0 | $0 |
| Scott D Davis | — | April 25, 2024 A | — | 0 | 0 | $0 |
| Anne M Mulcahy | — | April 25, 2024 A | 6,537 | 0 | 0 | $0 |
| William Hait | — | Feb. 15, 2024 A | 38,647 | 0 | 0 | $0 |
| Peter Fasolo | — | Feb. 15, 2024 A | 112,076 | 0 | 0 | $0 |
| Ashley Mcevoy | — | Aug. 23, 2023 D | 52,038 | 0 | 0 | $0 |
| Eugene A. Washington | — | March 7, 2023 A | — | 0 | 0 | $0 |
Insiders from SEC Form 3/4/5 filings; net = open-market P/S only
Activists & 5%+ owners 4 positions
Investors who filed SEC Schedule 13D — beneficial ownership above 5% with an intent to influence the issuer (activist stakes, board campaigns, M&A). Each row shows the most recent known state of that filer's position.
| Filer | Filed | Stake | Status | Purpose | Filing |
|---|---|---|---|---|---|
| Johnson & Johnson ×7 filings | Dec. 6, 2010 | — | Initial filing | — | SEC |
| Undisclosed reporting person | Jan. 27, 2003 | — | Initial filing | — | SEC |
| Undisclosed reporting person | Nov. 21, 2002 | — | Initial filing | — | SEC |
| Undisclosed reporting person | Feb. 5, 2001 | — | Initial filing | — | SEC |
Purpose is an automated classification of the filer's own stated purpose (SEC Item 4) — not investment advice. "—" means no clear purpose was stated or the text could not be classified.
ETF ownership Held by 318 ETFs
Weight reflects direct equity holdings (N-PORT) only; leveraged or derivative-based funds may hold additional swap exposure not shown.
| Fund | Weight | Units | As of | Source |
|---|---|---|---|---|
| IHE · iShares Trust | 22.16% | 1,426,758 SH | Aug. 21, 2026 | Daily |
| IYH · iShares Trust | 9.95% | 1,437,371 SH | Aug. 21, 2026 | Daily |
| FHLC · FIDELITY COVINGTON TRUST | 8.94% | 1,110,650 NS | April 30, 2026 | N-PORT |
| VHT · VANGUARD WORLD FUND | 8.89% | 7,140,555 SH | Aug. 19, 2026 | Daily |
| GDOC · Goldman Sachs ETF Trust | 8.07% | 7,204 NS | May 31, 2026 | N-PORT |
| CURE · Direxion Shares ETF Trust | 7.99% | 48,053 NS | April 30, 2026 | N-PORT |
| RXL · ProShares Trust | 7.86% | 25,129 NS | May 31, 2026 | N-PORT |
| FTXH · First Trust Exchange-Traded Fund VI | 6.96% | 9,939 NS | June 30, 2026 | N-PORT |
| IXJ · iShares Trust | 6.91% | 1,124,264 SH | Aug. 21, 2026 | Daily |
| JDOC · J.P. Morgan Exchange-Traded Fund Tr… | 6.20% | 3,001 NS | April 30, 2026 | N-PORT |
| DIVL · Madison ETFs Trust | 5.49% | 12,987 NS | June 30, 2026 | N-PORT |
| PJP · Invesco Exchange-Traded Fund Trust | 5.09% | 100,619 SH | Aug. 21, 2026 | Daily |
| OUSA · ALPS ETF Trust | 5.06% | 166,868 NS | May 31, 2026 | N-PORT |
| SPMO · Invesco Exchange-Traded Fund Trust … | 4.64% | 3,827,496 SH | Aug. 21, 2026 | Daily |
| SPVU · Invesco Exchange-Traded Fund Trust … | 4.44% | 26,614 NS | May 31, 2026 | N-PORT |
| DJD · Invesco Exchange-Traded Fund Trust | 4.38% | 82,468 SH | Aug. 21, 2026 | Daily |
| QLTY · GMO ETF Trust | 4.22% | 844,279 NS | May 31, 2026 | N-PORT |
| CCOR · Listed Funds Trust | 4.12% | 4,942 NS | April 30, 2026 | N-PORT |
| QLV · FlexShares Trust | 4.11% | 30,303 NS | April 30, 2026 | N-PORT |
| MTUM · iShares Trust | 3.63% | 3,366,987 SH | Aug. 21, 2026 | Daily |
| PSIL · AdvisorShares Trust | 3.61% | 6,308 NS | June 30, 2026 | N-PORT |
| HRTS · Tema ETF Trust | 3.59% | 8,274 NS | May 31, 2026 | N-PORT |
| PWV · Invesco Exchange-Traded Fund Trust | 3.52% | 244,422 SH | Aug. 21, 2026 | Daily |
| EDOW · First Trust Exchange-Traded Fund | 3.46% | 41,790 NS | June 30, 2026 | N-PORT |
| XT · iShares Trust | 3.43% | 504,767 SH | Aug. 21, 2026 | Daily |
| RFFC · ALPS ETF Trust | 3.42% | 4,511 NS | May 31, 2026 | N-PORT |
| LCOW · Pacer Funds Trust | 3.27% | 3,266 NS | April 30, 2026 | N-PORT |
| AGQI · First Trust Exchange-Traded Fund VI… | 3.26% | 8,108 NS | May 31, 2026 | N-PORT |
| USMC · Principal Exchange-Traded Funds | 3.20% | 439,492 NS | June 30, 2026 | N-PORT |
| ESGG · FlexShares Trust | 3.19% | 15,060 NS | April 30, 2026 | N-PORT |
| DGRO · iShares Trust | 3.15% | 5,134,101 SH | Aug. 21, 2026 | Daily |
| GEND · Spinnaker ETF Series | 3.10% | 599 | April 30, 2026 | N-PORT |
| FLV · AMERICAN CENTURY ETF TRUST | 3.08% | 48,203 NS | May 31, 2026 | N-PORT |
| TBG · EA Series Trust | 3.03% | 30,300 NS | April 30, 2026 | N-PORT |
| BDIV · ETF Series Solutions | 2.97% | 812 NS | April 30, 2026 | N-PORT |
| MGV · VANGUARD WORLD FUND | 2.88% | 1,513,022 SH | Aug. 19, 2026 | Daily |
| AGNG · Global X Funds | 2.88% | 10,447 NS | May 31, 2026 | N-PORT |
| DJIA · Global X Funds | 2.87% | 21,113 NS | April 30, 2026 | N-PORT |
| YOKE · EA Series Trust | 2.87% | 28,113 NS | April 30, 2026 | N-PORT |
| DYLG · Global X Funds | 2.86% | 732 NS | April 30, 2026 | N-PORT |
| RFDA · ALPS ETF Trust | 2.82% | 10,938 NS | May 31, 2026 | N-PORT |
| CAPE · DoubleLine ETF Trust | 2.81% | 26,392 NS | June 30, 2026 | N-PORT |
| GDIV · Harbor ETF Trust | 2.76% | 27,085 NS | April 30, 2026 | N-PORT |
| ASLV · ALLSPRING EXCHANGE-TRADED FUNDS TRU… | 2.69% | 26,096 NS | April 30, 2026 | N-PORT |
| QDF · FlexShares Trust | 2.68% | 247,500 NS | April 30, 2026 | N-PORT |
| VIG · VANGUARD SPECIALIZED FUNDS | 2.66% | 13,599,531 SH | Aug. 19, 2026 | Daily |
| BKDV · BNY Mellon ETF Trust II | 2.63% | 158,124 NS | April 30, 2026 | N-PORT |
| VLLU · Harbor ETF Trust | 2.62% | 496 NS | April 30, 2026 | N-PORT |
| TOPT · iShares Trust | 2.62% | 65,064 SH | Aug. 21, 2026 | Daily |
| QDEF · FlexShares Trust | 2.58% | 59,511 NS | April 30, 2026 | N-PORT |